| Param | Original file | Final file |
|---|---|---|
| Filename | modeM0/AS1T04_095T01_9000005080_35483cztM0_level2.evt | modeM0/AS1T04_095T01_9000005080_35483cztM0_level2_quad_clean.evt |
| Size (bytes) | 493,027,200 | 106,182,720 |
| Size | 470.2 MB | 101.3 MB |
| Events in quadrant A | 2,859,915 | 710,927 |
| Events in quadrant B | 3,699,461 | 714,189 |
| Events in quadrant C | 4,408,278 | 698,474 |
| Events in quadrant D | 3,560,902 | 677,214 |
| Mode M0 | |||
|---|---|---|---|
| Quadrant | BADHDUFLAG | Total packets | Discarded packets |
| A | 0 | 12180 | 3 |
| B | 0 | 14940 | 2 |
| C | 0 | 16942 | 2 |
| D | 0 | 14293 | 2 |
| Mode M9 | |||
|---|---|---|---|
| Quadrant | BADHDUFLAG | Total packets | Discarded packets |
| A | 0 | 15 | 0 |
| B | 0 | 15 | 0 |
| C | 0 | 15 | 0 |
| D | 0 | 15 | 0 |
| Mode SS | |||
|---|---|---|---|
| Quadrant | BADHDUFLAG | Total packets | Discarded packets |
| A | 0 | 120 | 0 |
| B | 0 | 120 | 0 |
| C | 0 | 120 | 0 |
| D | 0 | 120 | 0 |
| Quadrant | Total seconds | Saturated seconds | Saturation percentage |
|---|---|---|---|
| A | 5935 | 8 | 0.134794% |
| B | 5935 | 227 | 3.824768% |
| C | 5935 | 219 | 3.689975% |
| D | 5936 | 120 | 2.021563% |
Noise dominated data is calculated using 1-second bins in cleaned event files. If a bin has >2000 counts, and if more than 50% of those come from <1% of pixels, then it is considered to be noise-dominated and hence unusable.
| Quadrant | # 1 sec bins | Bins with >0 counts | Bins with >2000 counts | High rate bins dominated by noise | Noise dominated (total time) | Noise dominated (detector-on time) | Marked lightcurve |
|---|---|---|---|---|---|---|---|
| A | 7459 | 5936 | 3 | 3 | 0.04% | 0.05% | 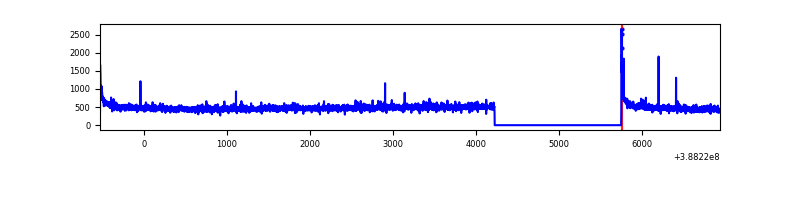 |
| B | 7459 | 5936 | 122 | 122 | 1.64% | 2.06% | 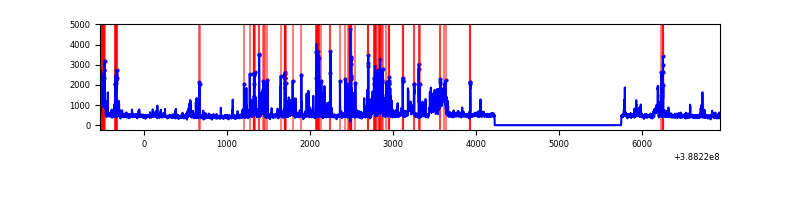 |
| C | 7459 | 5936 | 170 | 170 | 2.28% | 2.86% | 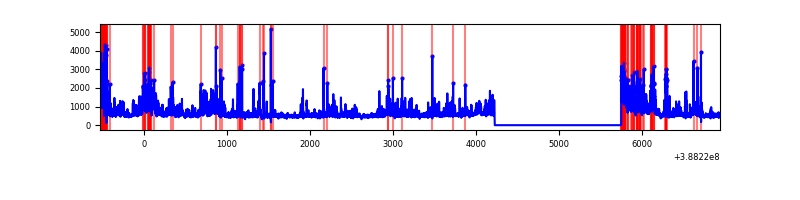 |
| D | 7460 | 5937 | 104 | 104 | 1.39% | 1.75% | 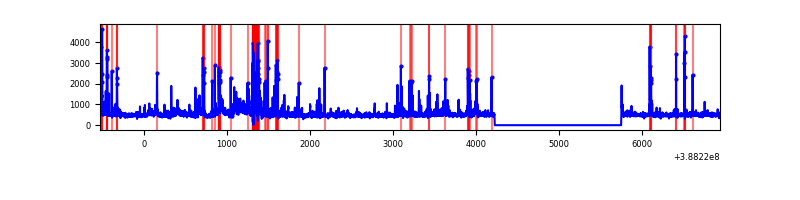 |
Top three noisy pixels from each quadrant. If the there are fewer than three noisy pixels in the level2.evt file, extra rows are filled as -1
| Pixel properties | Quadrant properties | ||||||
|---|---|---|---|---|---|---|---|
| Quadrant | DetID | PixID | Counts | Sigma | Mean | Median | Sigma |
| A | 10 | 83 | 144736 | 1050.52 | 678 | 664 | 137.1 |
| A | 15 | 169 | 66042 | 476.71 | 678 | 664 | 137.1 |
| A | 13 | 6 | 15246 | 106.33 | 678 | 664 | 137.1 |
| B | 5 | 172 | 375348 | 2986.27 | 664 | 650 | 125.5 |
| B | 5 | 236 | 313147 | 2490.54 | 664 | 650 | 125.5 |
| B | 5 | 200 | 185497 | 1473.19 | 664 | 650 | 125.5 |
| C | 4 | 254 | 862172 | 5696.71 | 654 | 657 | 151.2 |
| C | 0 | 207 | 363502 | 2399.29 | 654 | 657 | 151.2 |
| C | 0 | 10 | 302423 | 1995.41 | 654 | 657 | 151.2 |
| D | 7 | 80 | 226939 | 1414.69 | 661 | 642 | 160.0 |
| D | 8 | 195 | 146968 | 914.75 | 661 | 642 | 160.0 |
| D | 2 | 153 | 95216 | 591.23 | 661 | 642 | 160.0 |
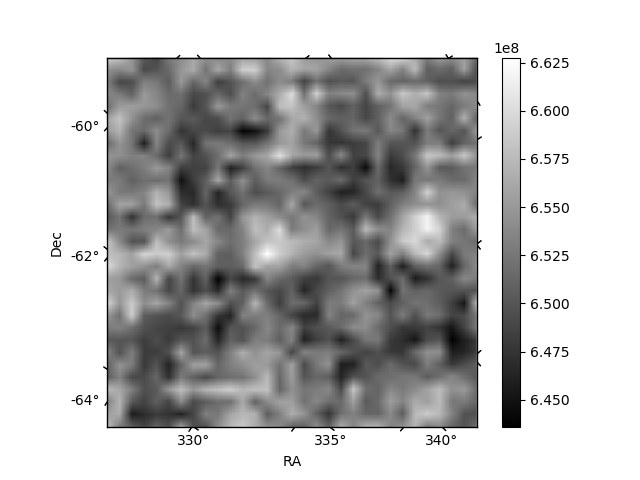
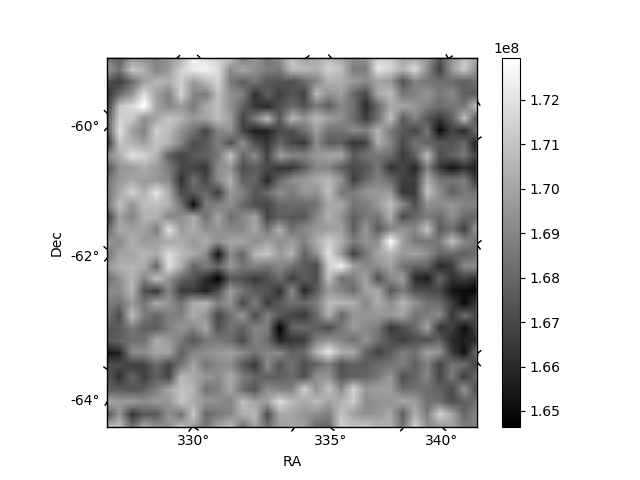
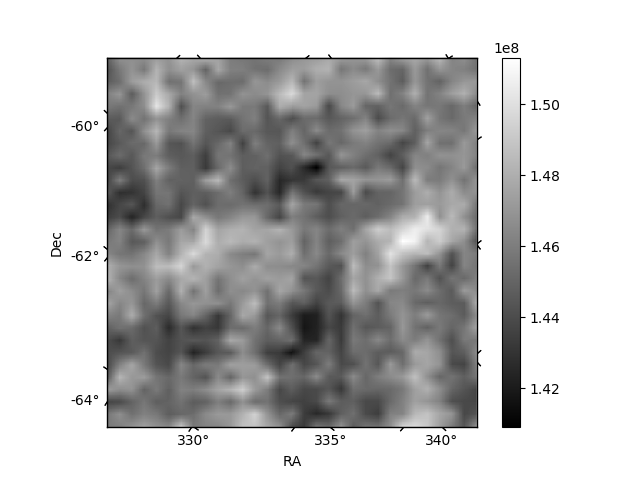
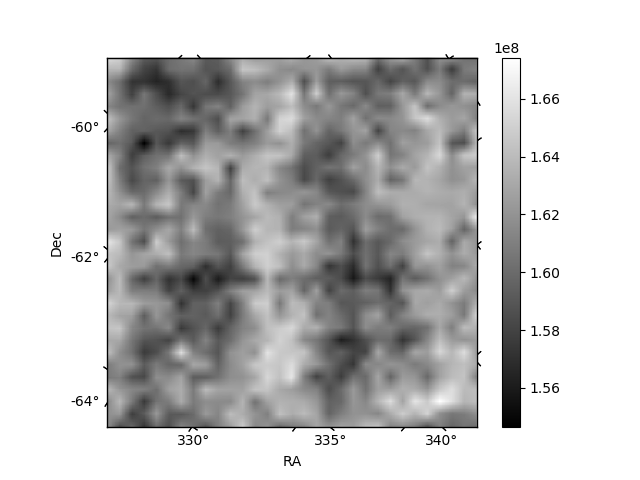
Histogram calculated using DETX and DETY for each event in the final _common_clean file
| Quadrant A | 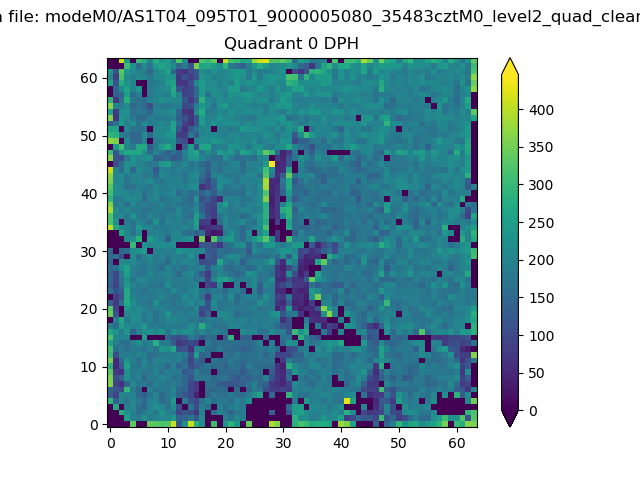 |
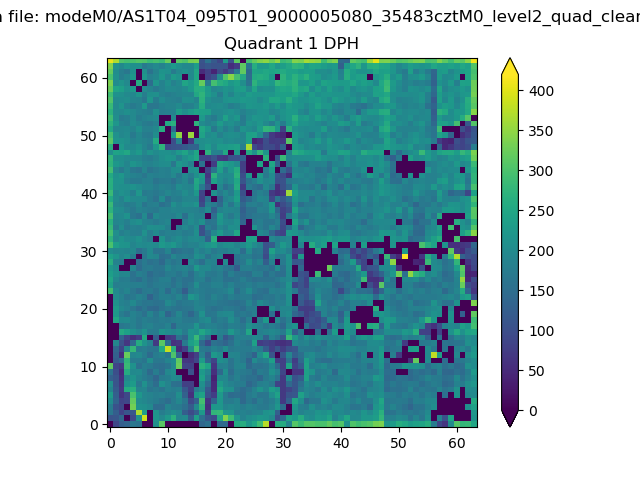 |
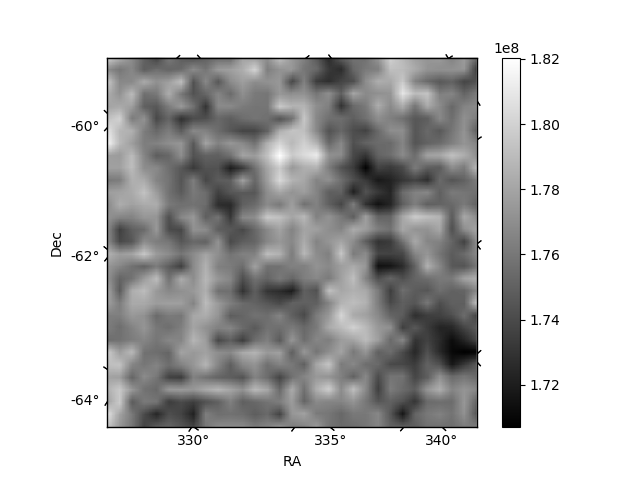
Quadrant B |
|---|---|---|---|
| Quadrant D | 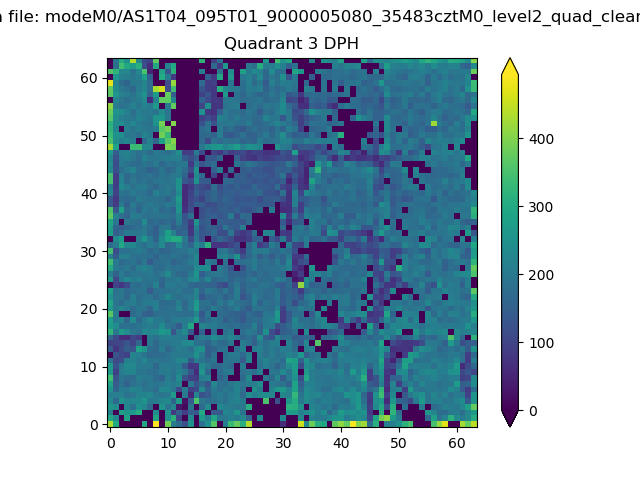 |
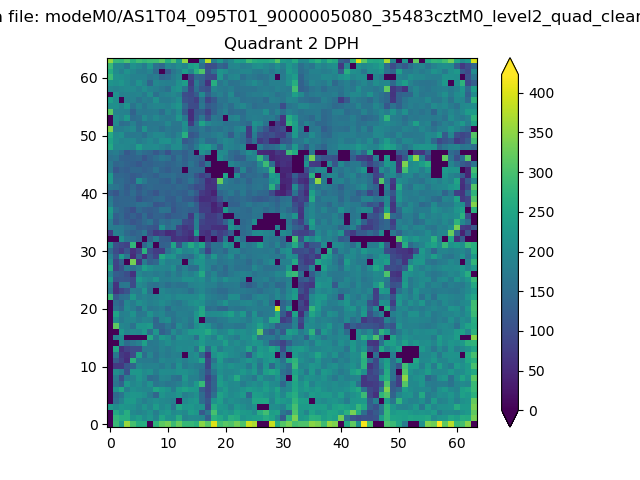 |
Quadrant C |
| Plot type | Count rate plots | Images |
|---|---|---|
| Comparison with Poisson distribution Blue bars denote a histogram of data divided into 1 sec bins. Red curve is a Poisson curve with rate = median count rate of data. |
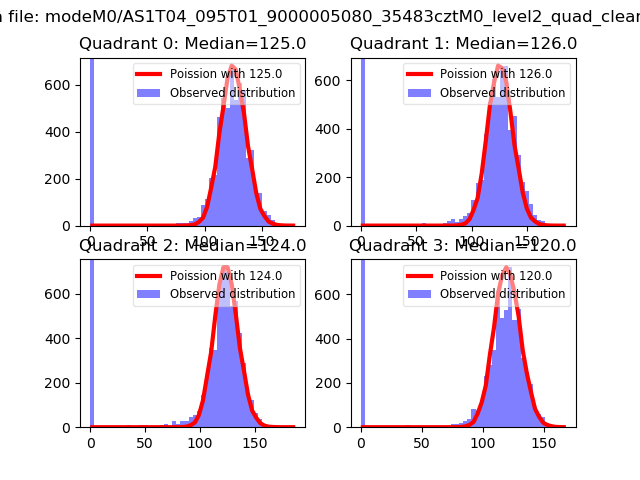 |
 |
| Quadrant-wise count rates Data is divided into 100 sec bins |
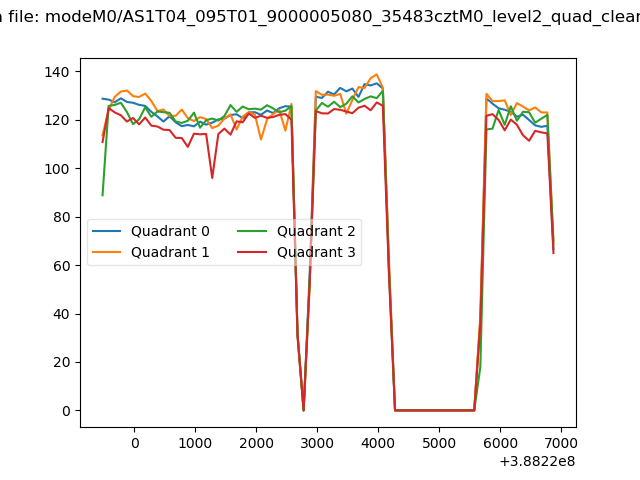 |
|
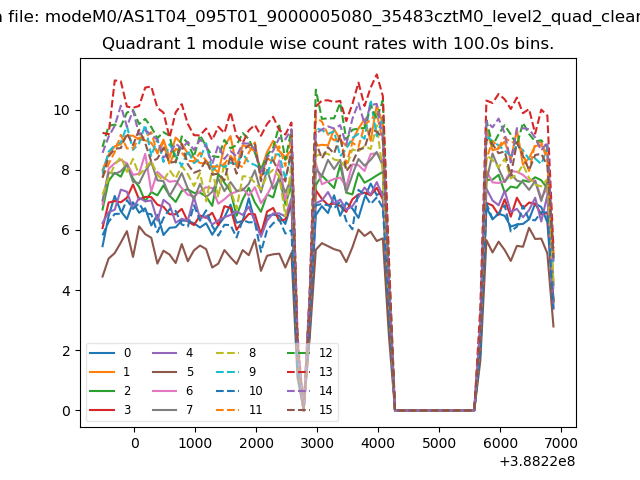
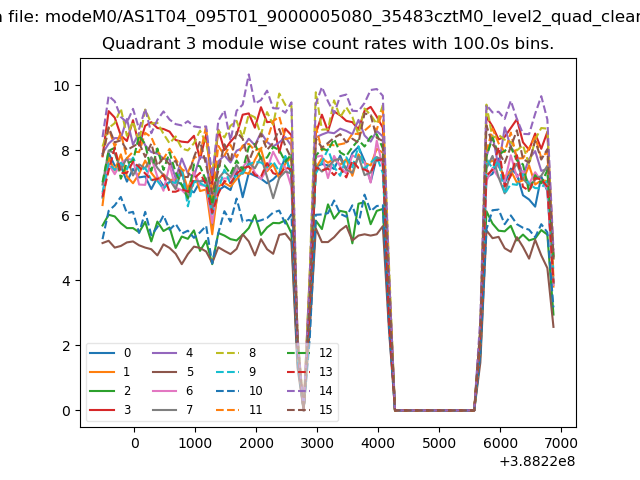
| Module-wise count rates for Quadrant A Data is divided into 100 sec bins |
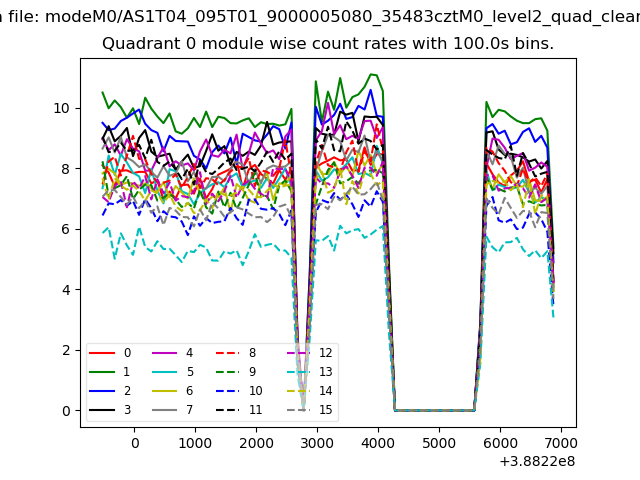 |
 |
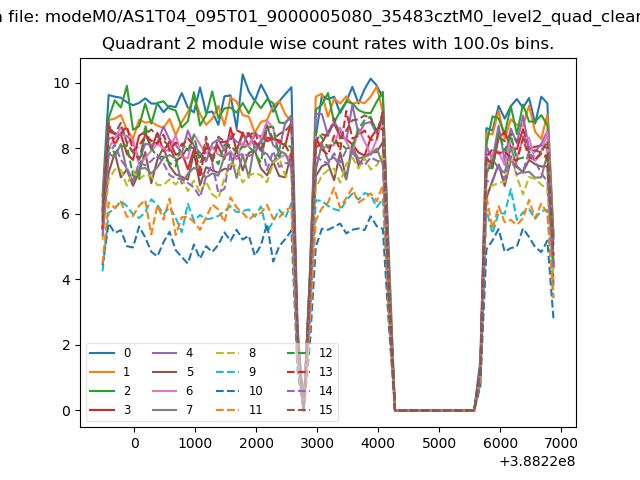
| Module-wise count rates for Quadrant B Data is divided into 100 sec bins |
 |
 |
| Module-wise count rates for Quadrant C Data is divided into 100 sec bins |
 |
 |
| Module-wise count rates for Quadrant D Data is divided into 100 sec bins |
 |
 |
| Parameter | Plot |
|---|---|
| CZT HV Monitor | 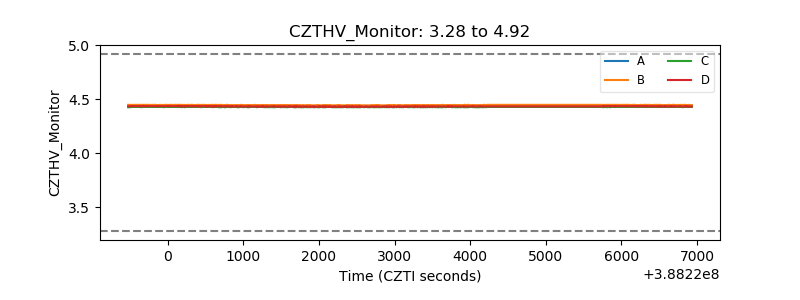 |
| D_VDD | 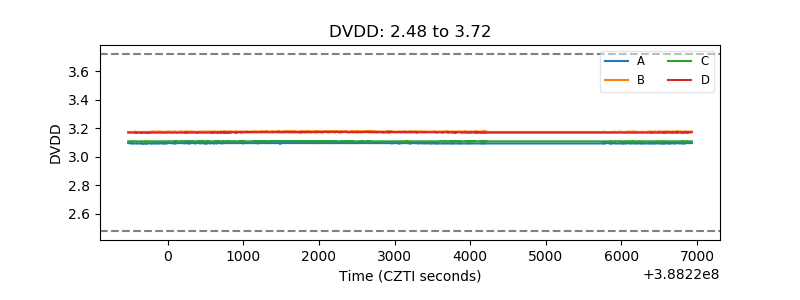 |
| Temperature 1 | 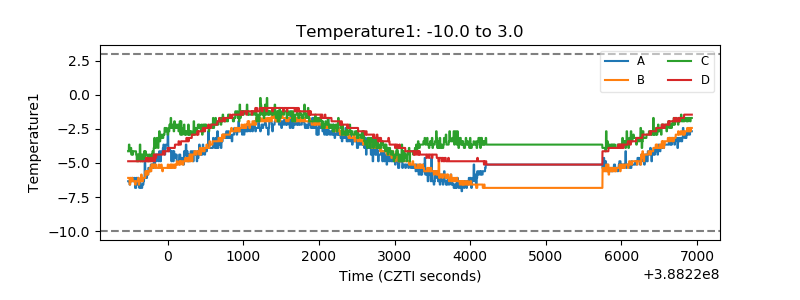 |
| Veto HV Monitor | 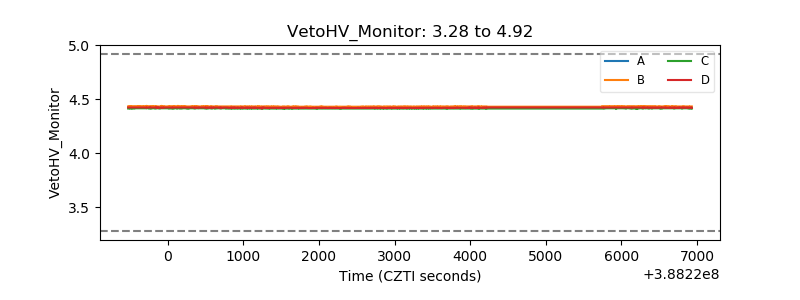 |
| Veto LLD | 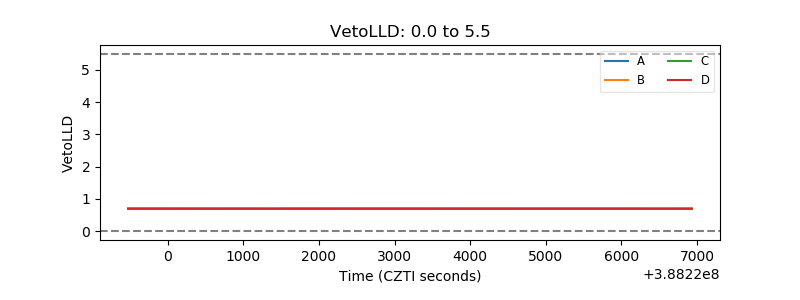 |
| Alpha Counter | 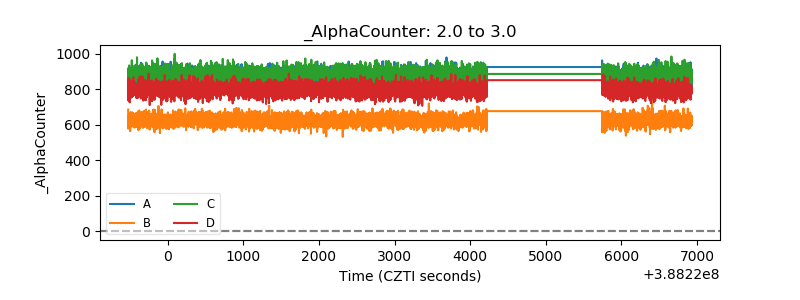 |
| _CPM_Rate |  |
| CZT Counter | 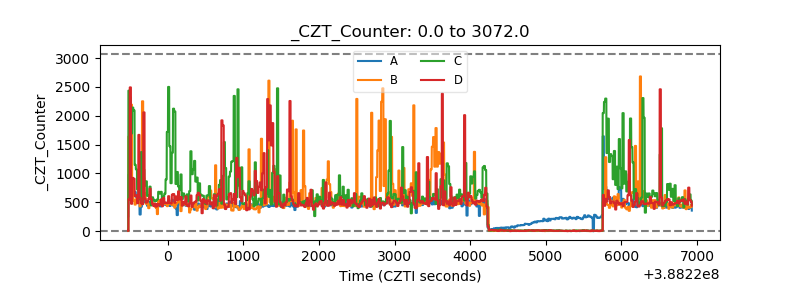 |
| +2.5 Volts monitor |  |
| +5 Volts monitor |  |
| _ROLL_ROT | 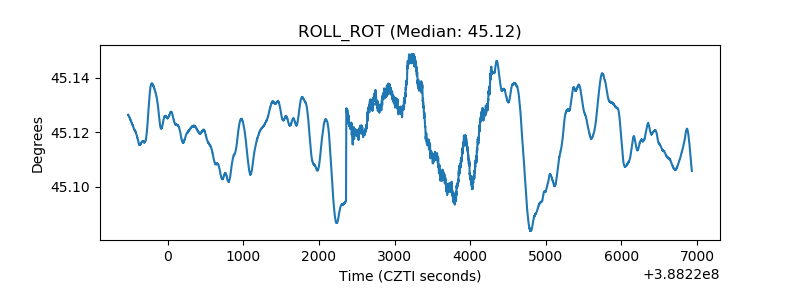 |
| _Roll_DEC | 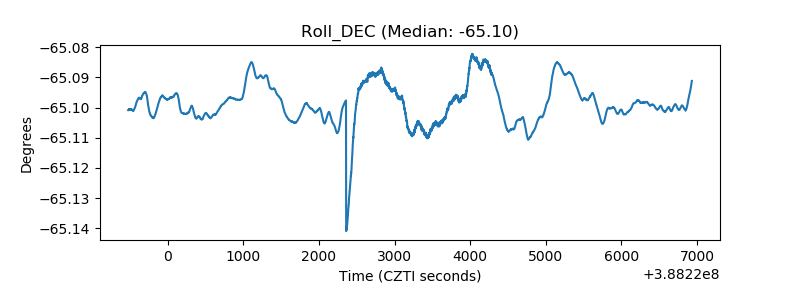 |
| _Roll_RA | 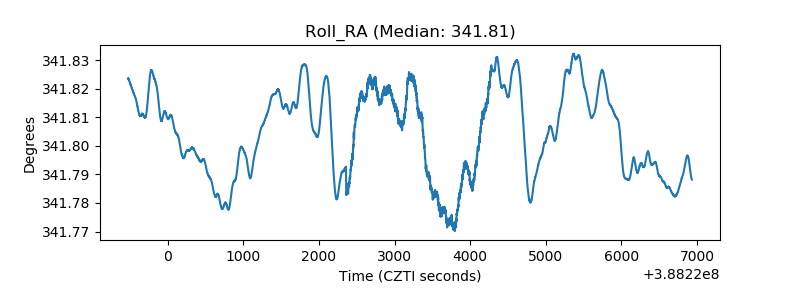 |
| Veto Counter | 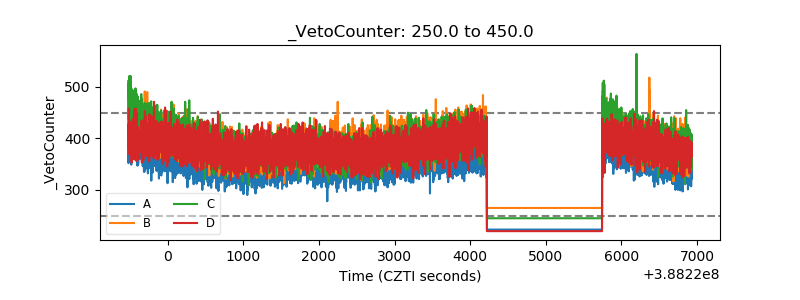 |