| Param | Original file | Final file |
|---|---|---|
| Filename | modeM0/AS1A11_097T22_9000005082cztM0_level2.fits | modeM0/AS1A11_097T22_9000005082cztM0_level2_quad_clean.evt |
| Size (bytes) | 684,106,560 | 730,843,200 |
| Size | 652.4 MB | 697.0 MB |
| Events in quadrant A | 3,958,328 | 4,166,723 |
| Events in quadrant B | 3,928,026 | 4,380,312 |
| Events in quadrant C | 4,160,196 | 4,479,729 |
| Events in quadrant D | 3,600,750 | 4,042,388 |
| Mode M9 | |||
|---|---|---|---|
| Quadrant | BADHDUFLAG | Total packets | Discarded packets |
| A | 0 | 289 | 0 |
| B | 0 | 289 | 0 |
| C | 0 | 289 | 0 |
| D | 0 | 289 | 0 |
| Mode M0 | |||
|---|---|---|---|
| Quadrant | BADHDUFLAG | Total packets | Discarded packets |
| A | 0 | 194893 | 0 |
| B | 0 | 205101 | 0 |
| C | 0 | 177031 | 0 |
| D | 0 | 182009 | 0 |
| Mode SS | |||
|---|---|---|---|
| Quadrant | BADHDUFLAG | Total packets | Discarded packets |
| A | 0 | 1508 | 0 |
| B | 0 | 1508 | 0 |
| C | 0 | 1508 | 0 |
| D | 0 | 1508 | 0 |
| Quadrant | Total seconds | Saturated seconds | Saturation percentage |
|---|---|---|---|
| A | 73870 | 6637 | 8.984703% |
| B | 73870 | 5583 | 7.557872% |
| C | 73870 | 1656 | 2.241776% |
| D | 73870 | 2069 | 2.800866% |
Noise dominated data is calculated using 1-second bins in cleaned event files. If a bin has >2000 counts, and if more than 50% of those come from <1% of pixels, then it is considered to be noise-dominated and hence unusable.
| Quadrant | # 1 sec bins | Bins with >0 counts | Bins with >2000 counts | High rate bins dominated by noise | Noise dominated (total time) | Noise dominated (detector-on time) | Marked lightcurve |
|---|---|---|---|---|---|---|---|
| A | 102718 | 72510 | 0 | 0 | 0.00% | 0.00% |  |
| B | 102718 | 73817 | 0 | 0 | 0.00% | 0.00% | 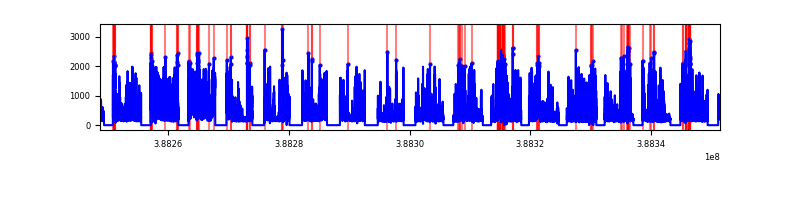 |
| C | 102718 | 73860 | 0 | 0 | 0.00% | 0.00% | 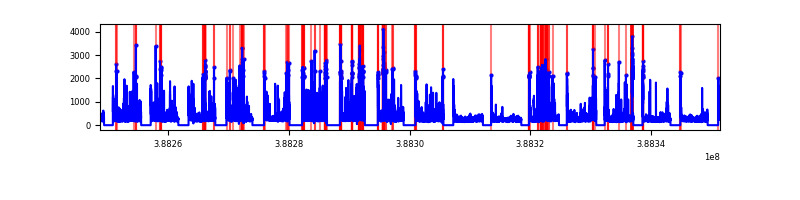 |
| D | 102718 | 73846 | 0 | 0 | 0.00% | 0.00% |  |
Top three noisy pixels from each quadrant. If the there are fewer than three noisy pixels in the level2.evt file, extra rows are filled as -1
| Pixel properties | Quadrant properties | ||||||
|---|---|---|---|---|---|---|---|
| Quadrant | DetID | PixID | Counts | Sigma | Mean | Median | Sigma |
| A | 7 | 110 | 3283 | 8.97 | 1033 | 970 | 257.7 |
| A | 9 | 19 | 3213 | 8.7 | 1033 | 970 | 257.7 |
| A | 0 | 29 | 3142 | 8.43 | 1033 | 970 | 257.7 |
| B | 2 | 9 | 3429 | 12.01 | 1040 | 997 | 202.5 |
| B | 3 | 80 | 3035 | 10.06 | 1040 | 997 | 202.5 |
| B | 2 | 8 | 2840 | 9.1 | 1040 | 997 | 202.5 |
| C | 1 | 81 | 3436 | 8.47 | 1099 | 1031 | 283.7 |
| C | 1 | 80 | 3386 | 8.3 | 1099 | 1031 | 283.7 |
| C | 3 | 203 | 3284 | 7.94 | 1099 | 1031 | 283.7 |
| D | 7 | 3 | 2687 | 6.29 | 1029 | 940 | 277.8 |
| D | 4 | 160 | 2642 | 6.13 | 1029 | 940 | 277.8 |
| D | 3 | 14 | 2638 | 6.11 | 1029 | 940 | 277.8 |
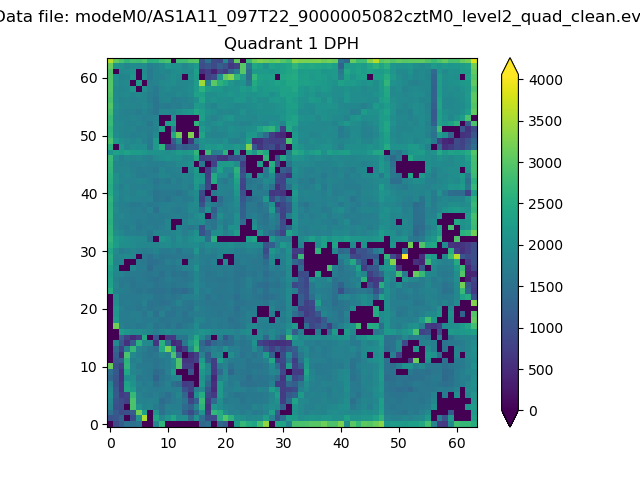
Histogram calculated using DETX and DETY for each event in the final _common_clean file
| Quadrant A |  |
 |
Quadrant B |
|---|---|---|---|
| Quadrant D |  |
 |
Quadrant C |
| Plot type | Count rate plots | Images |
|---|---|---|
| Comparison with Poisson distribution Blue bars denote a histogram of data divided into 1 sec bins. Red curve is a Poisson curve with rate = median count rate of data. |
 |
 |
| Quadrant-wise count rates Data is divided into 100 sec bins |
 |
|
| Module-wise count rates for Quadrant A Data is divided into 100 sec bins |
 |
 |
| Module-wise count rates for Quadrant B Data is divided into 100 sec bins |
 |
 |
| Module-wise count rates for Quadrant C Data is divided into 100 sec bins |
 |
 |
| Module-wise count rates for Quadrant D Data is divided into 100 sec bins |
 |
 |
| Parameter | Plot |
|---|---|
| CZT HV Monitor |  |
| D_VDD |  |
| Temperature 1 | 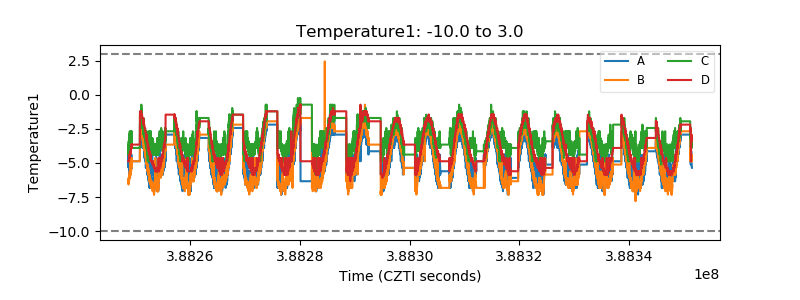 |
| Veto HV Monitor |  |
| Veto LLD |  |
| Alpha Counter |  |
| _CPM_Rate |  |
| CZT Counter |  |
| +2.5 Volts monitor |  |
| +5 Volts monitor |  |
| _ROLL_ROT |  |
| _Roll_DEC |  |
| _Roll_RA | 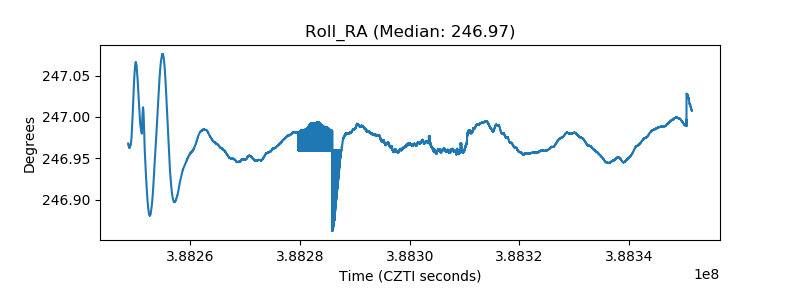 |
| Veto Counter | 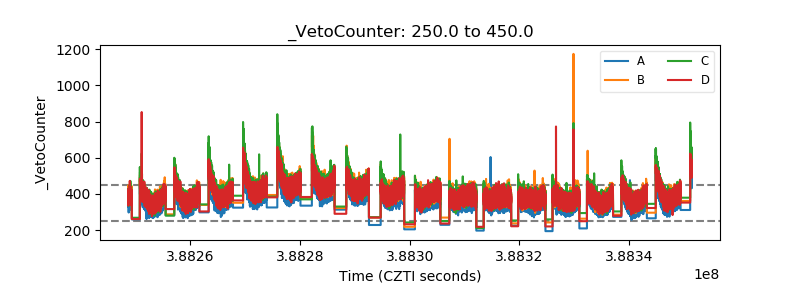 |