| Param | Original file | Final file |
|---|---|---|
| Filename | modeM0/AS1A11_097T22_9000005082_35489cztM0_level2.evt | modeM0/AS1A11_097T22_9000005082_35489cztM0_level2_quad_clean.evt |
| Size (bytes) | 520,796,160 | 98,772,480 |
| Size | 496.7 MB | 94.2 MB |
| Events in quadrant A | 3,257,444 | 642,081 |
| Events in quadrant B | 5,508,416 | 635,235 |
| Events in quadrant C | 3,518,582 | 673,993 |
| Events in quadrant D | 3,096,347 | 636,077 |
| Mode M9 | |||
|---|---|---|---|
| Quadrant | BADHDUFLAG | Total packets | Discarded packets |
| A | 0 | 33 | 0 |
| B | 0 | 33 | 0 |
| C | 0 | 33 | 0 |
| D | 0 | 33 | 0 |
| Mode M0 | |||
|---|---|---|---|
| Quadrant | BADHDUFLAG | Total packets | Discarded packets |
| A | 0 | 13503 | 3 |
| B | 0 | 20317 | 2 |
| C | 0 | 14081 | 2 |
| D | 0 | 13167 | 2 |
| Mode SS | |||
|---|---|---|---|
| Quadrant | BADHDUFLAG | Total packets | Discarded packets |
| A | 0 | 118 | 0 |
| B | 0 | 118 | 0 |
| C | 0 | 118 | 0 |
| D | 0 | 118 | 0 |
| Quadrant | Total seconds | Saturated seconds | Saturation percentage |
|---|---|---|---|
| A | 5780 | 187 | 3.235294% |
| B | 5780 | 739 | 12.785467% |
| C | 5780 | 92 | 1.591696% |
| D | 5780 | 108 | 1.868512% |
Noise dominated data is calculated using 1-second bins in cleaned event files. If a bin has >2000 counts, and if more than 50% of those come from <1% of pixels, then it is considered to be noise-dominated and hence unusable.
| Quadrant | # 1 sec bins | Bins with >0 counts | Bins with >2000 counts | High rate bins dominated by noise | Noise dominated (total time) | Noise dominated (detector-on time) | Marked lightcurve |
|---|---|---|---|---|---|---|---|
| A | 9064 | 5782 | 164 | 164 | 1.81% | 2.84% | 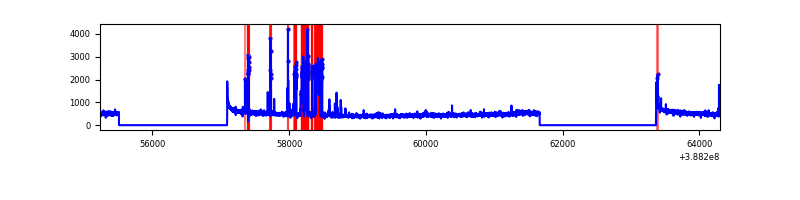 |
| B | 9064 | 5782 | 481 | 481 | 5.31% | 8.32% | 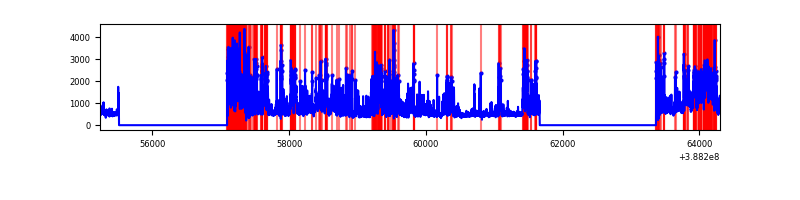 |
| C | 9064 | 5782 | 52 | 52 | 0.57% | 0.90% | 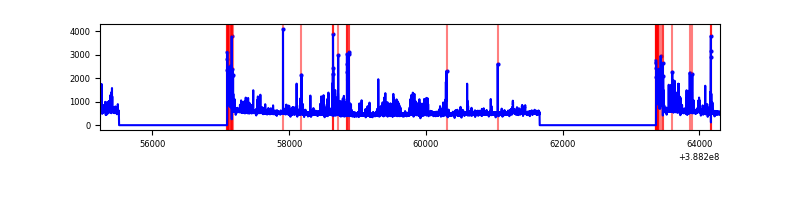 |
| D | 9064 | 5782 | 87 | 87 | 0.96% | 1.50% | 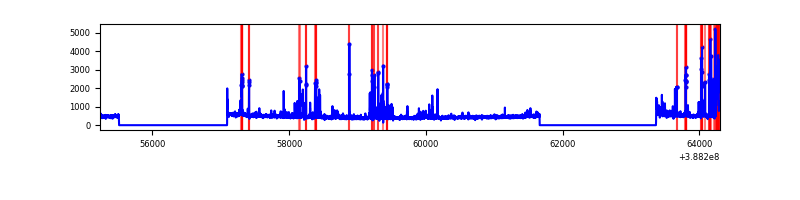 |
Top three noisy pixels from each quadrant. If the there are fewer than three noisy pixels in the level2.evt file, extra rows are filled as -1
| Pixel properties | Quadrant properties | ||||||
|---|---|---|---|---|---|---|---|
| Quadrant | DetID | PixID | Counts | Sigma | Mean | Median | Sigma |
| A | 15 | 169 | 531438 | 3974.06 | 664 | 652 | 133.6 |
| A | 10 | 83 | 138915 | 1035.19 | 664 | 652 | 133.6 |
| A | 9 | 143 | 16402 | 117.92 | 664 | 652 | 133.6 |
| B | 4 | 171 | 1425150 | 11725.6 | 640 | 624 | 121.5 |
| B | 5 | 236 | 935668 | 7696.56 | 640 | 624 | 121.5 |
| B | 5 | 172 | 353710 | 2906.33 | 640 | 624 | 121.5 |
| C | 0 | 10 | 325681 | 2108.04 | 664 | 670 | 154.2 |
| C | 15 | 214 | 236435 | 1529.18 | 664 | 670 | 154.2 |
| C | 4 | 254 | 139876 | 902.9 | 664 | 670 | 154.2 |
| D | 13 | 249 | 204324 | 1290.32 | 657 | 639 | 157.9 |
| D | 10 | 118 | 74967 | 470.86 | 657 | 639 | 157.9 |
| D | 12 | 6 | 62183 | 389.87 | 657 | 639 | 157.9 |
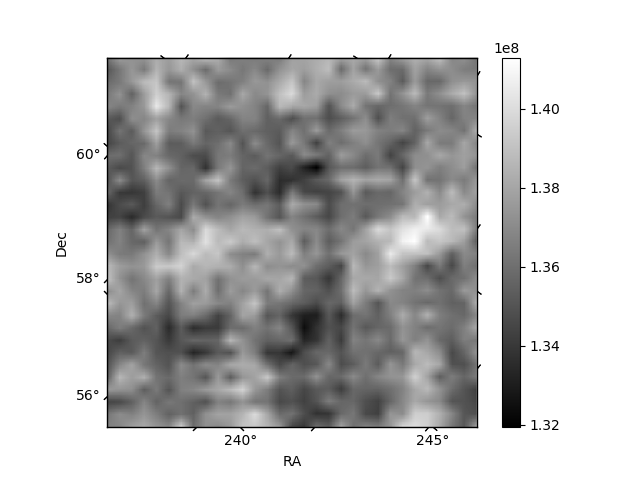
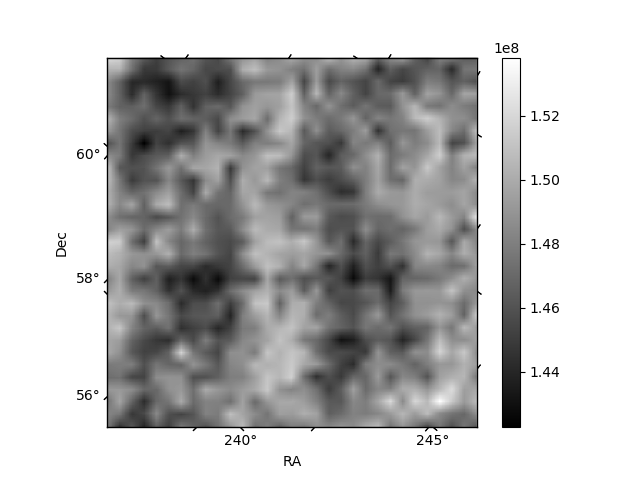
Histogram calculated using DETX and DETY for each event in the final _common_clean file
| Quadrant A |  |
 |
Quadrant B |
|---|---|---|---|
| Quadrant D |  |
 |
Quadrant C |
| Plot type | Count rate plots | Images |
|---|---|---|
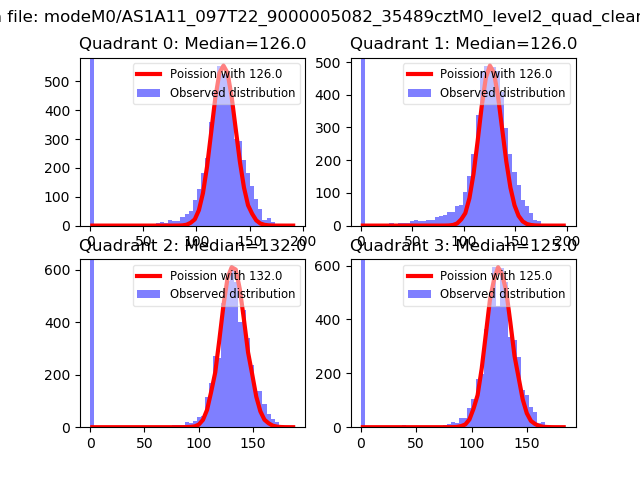
| Comparison with Poisson distribution Blue bars denote a histogram of data divided into 1 sec bins. Red curve is a Poisson curve with rate = median count rate of data. |
 |
 |
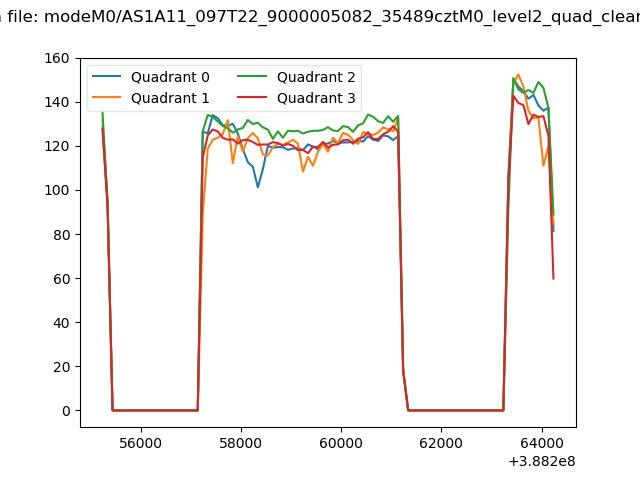
| Quadrant-wise count rates Data is divided into 100 sec bins |
 |
|
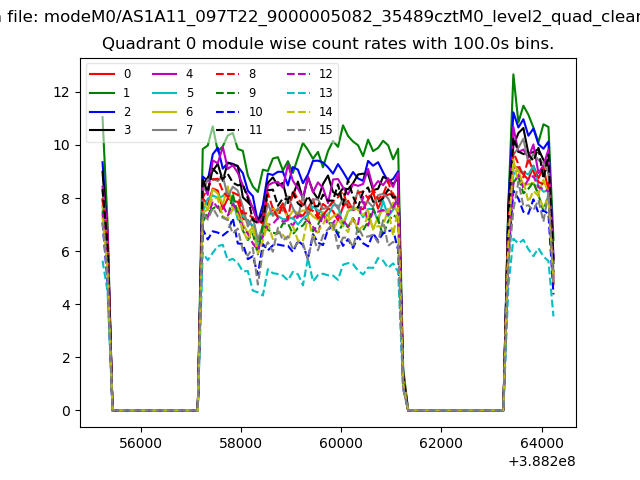
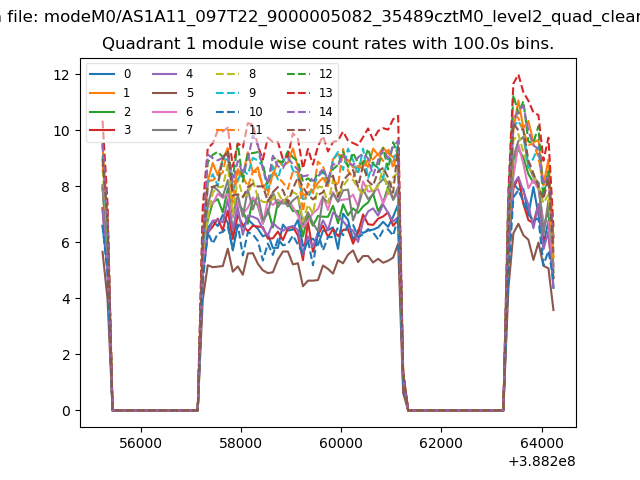
| Module-wise count rates for Quadrant A Data is divided into 100 sec bins |
 |
 |
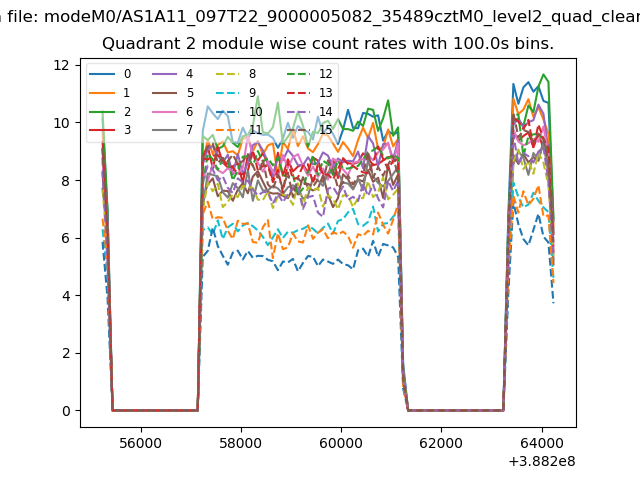
| Module-wise count rates for Quadrant B Data is divided into 100 sec bins |
 |
 |
| Module-wise count rates for Quadrant C Data is divided into 100 sec bins |
 |
 |
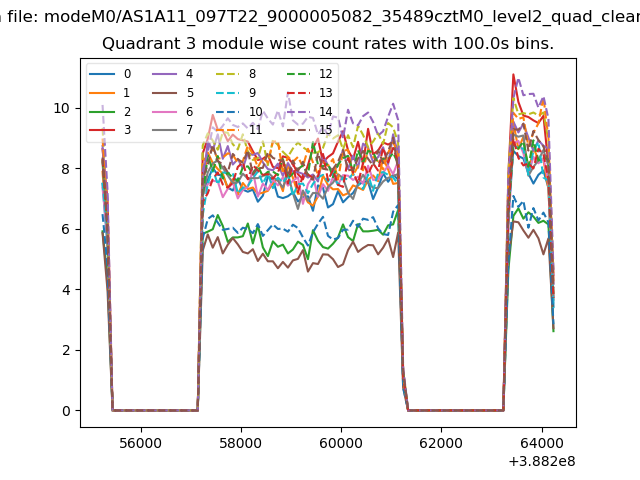
| Module-wise count rates for Quadrant D Data is divided into 100 sec bins |
 |
 |
| Parameter | Plot |
|---|---|
| CZT HV Monitor | 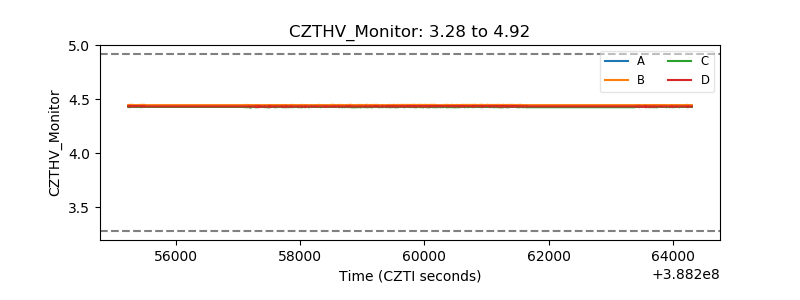 |
| D_VDD | 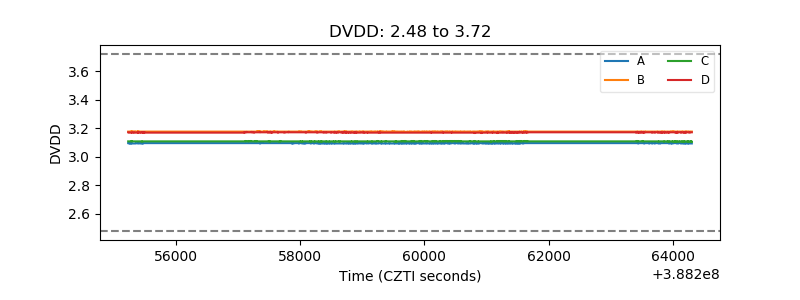 |
| Temperature 1 | 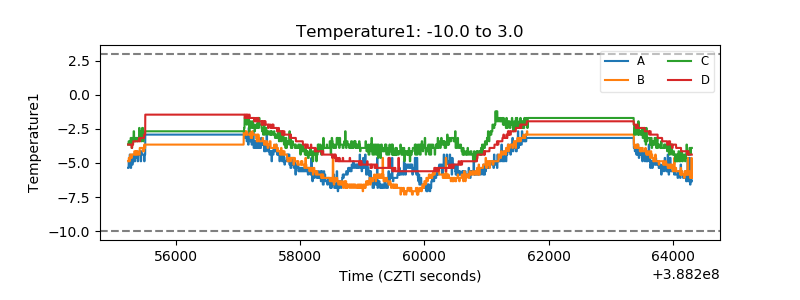 |
| Veto HV Monitor |  |
| Veto LLD | 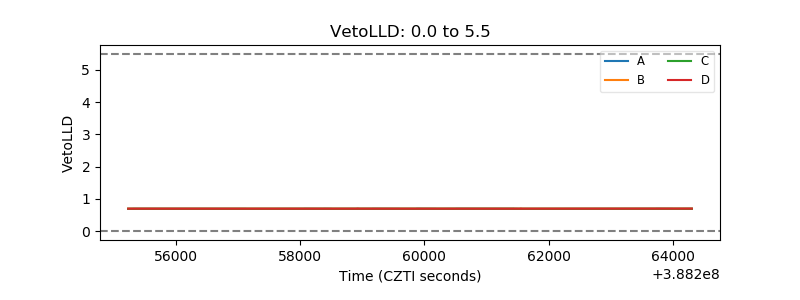 |
| Alpha Counter |  |
| _CPM_Rate | 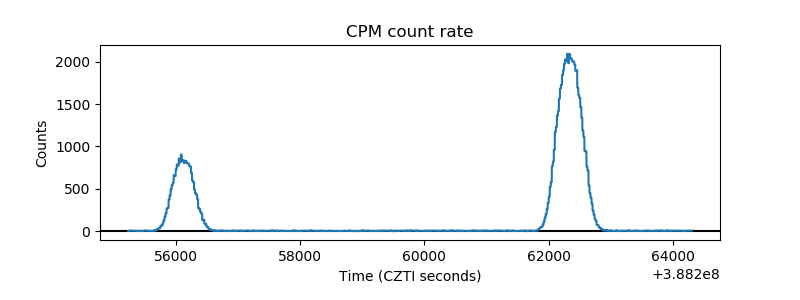 |
| CZT Counter | 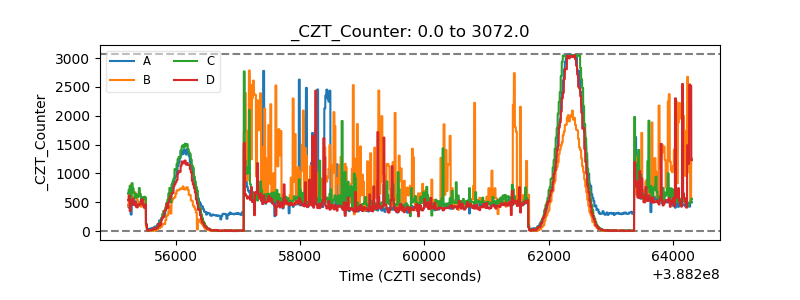 |
| +2.5 Volts monitor |  |
| +5 Volts monitor | 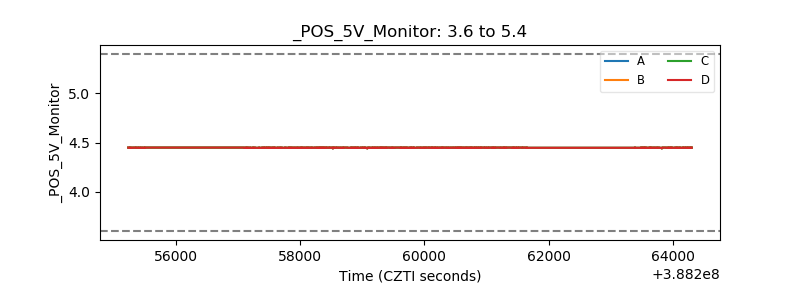 |
| _ROLL_ROT | 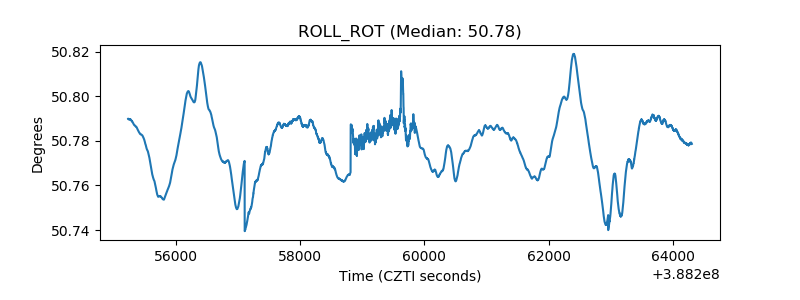 |
| _Roll_DEC |  |
| _Roll_RA | 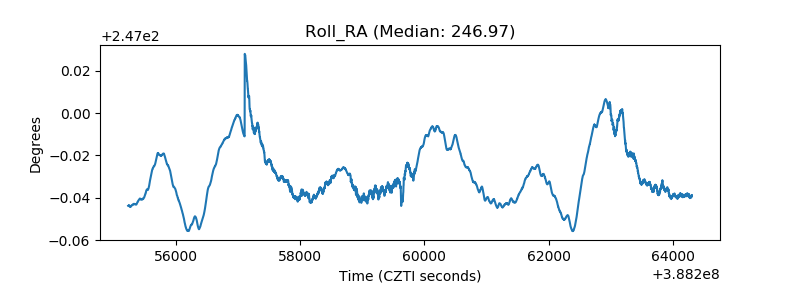 |
| Veto Counter | 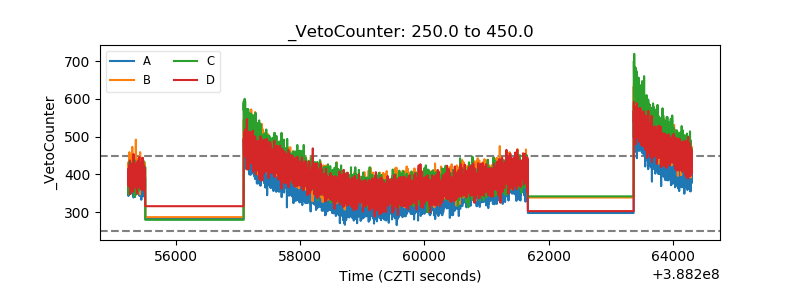 |