| Param | Original file | Final file |
|---|---|---|
| Filename | modeM0/AS1A11_097T22_9000005082_35492cztM0_level2.evt | modeM0/AS1A11_097T22_9000005082_35492cztM0_level2_quad_clean.evt |
| Size (bytes) | 473,135,040 | 90,835,200 |
| Size | 451.2 MB | 86.6 MB |
| Events in quadrant A | 3,251,747 | 571,487 |
| Events in quadrant B | 3,770,807 | 604,500 |
| Events in quadrant C | 3,712,908 | 617,172 |
| Events in quadrant D | 3,233,982 | 586,618 |
| Mode M9 | |||
|---|---|---|---|
| Quadrant | BADHDUFLAG | Total packets | Discarded packets |
| A | 0 | 38 | 0 |
| B | 0 | 38 | 0 |
| C | 0 | 38 | 0 |
| D | 0 | 38 | 0 |
| Mode M0 | |||
|---|---|---|---|
| Quadrant | BADHDUFLAG | Total packets | Discarded packets |
| A | 0 | 12925 | 3 |
| B | 0 | 14706 | 2 |
| C | 0 | 14347 | 2 |
| D | 0 | 13140 | 2 |
| Mode SS | |||
|---|---|---|---|
| Quadrant | BADHDUFLAG | Total packets | Discarded packets |
| A | 0 | 110 | 0 |
| B | 0 | 110 | 0 |
| C | 0 | 110 | 0 |
| D | 0 | 110 | 0 |
| Quadrant | Total seconds | Saturated seconds | Saturation percentage |
|---|---|---|---|
| A | 5296 | 227 | 4.286254% |
| B | 5296 | 463 | 8.742447% |
| C | 5296 | 223 | 4.210725% |
| D | 5296 | 70 | 1.321752% |
Noise dominated data is calculated using 1-second bins in cleaned event files. If a bin has >2000 counts, and if more than 50% of those come from <1% of pixels, then it is considered to be noise-dominated and hence unusable.
| Quadrant | # 1 sec bins | Bins with >0 counts | Bins with >2000 counts | High rate bins dominated by noise | Noise dominated (total time) | Noise dominated (detector-on time) | Marked lightcurve |
|---|---|---|---|---|---|---|---|
| A | 9092 | 5298 | 158 | 158 | 1.74% | 2.98% | 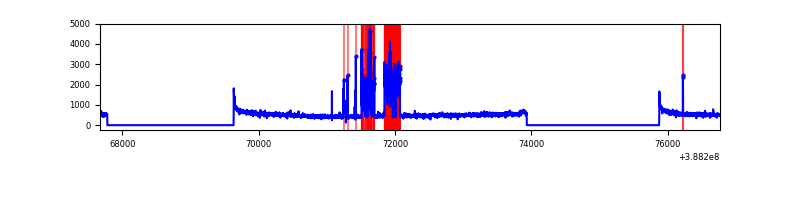 |
| B | 9092 | 5298 | 310 | 310 | 3.41% | 5.85% | 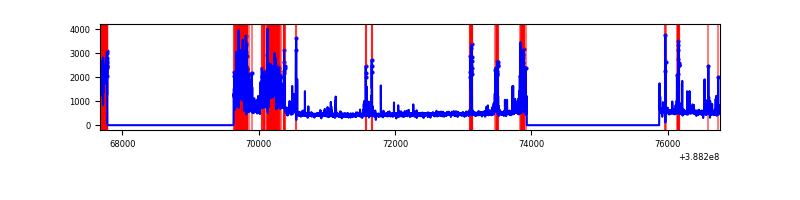 |
| C | 9092 | 5298 | 165 | 165 | 1.81% | 3.11% | 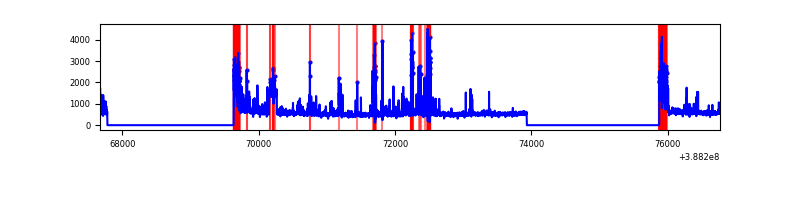 |
| D | 9092 | 5298 | 55 | 55 | 0.60% | 1.04% | 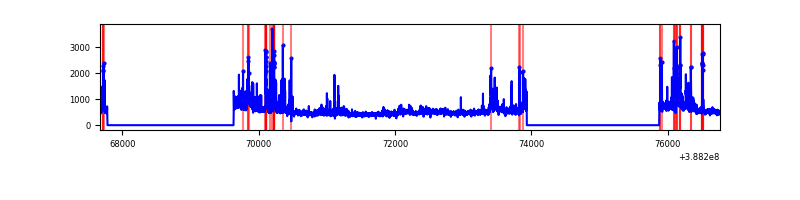 |
Top three noisy pixels from each quadrant. If the there are fewer than three noisy pixels in the level2.evt file, extra rows are filled as -1
| Pixel properties | Quadrant properties | ||||||
|---|---|---|---|---|---|---|---|
| Quadrant | DetID | PixID | Counts | Sigma | Mean | Median | Sigma |
| A | 15 | 169 | 717513 | 5850.65 | 617 | 606 | 122.5 |
| A | 10 | 83 | 127957 | 1039.31 | 617 | 606 | 122.5 |
| A | 9 | 143 | 14939 | 116.97 | 617 | 606 | 122.5 |
| B | 4 | 171 | 848816 | 7336.07 | 620 | 606 | 115.6 |
| B | 5 | 172 | 362477 | 3129.78 | 620 | 606 | 115.6 |
| B | 5 | 236 | 86960 | 746.87 | 620 | 606 | 115.6 |
| C | 0 | 207 | 454650 | 3185.55 | 627 | 635 | 142.5 |
| C | 0 | 10 | 370924 | 2598.09 | 627 | 635 | 142.5 |
| C | 15 | 214 | 215707 | 1509.03 | 627 | 635 | 142.5 |
| D | 7 | 80 | 243708 | 1644.57 | 621 | 606 | 147.8 |
| D | 13 | 249 | 217695 | 1468.6 | 621 | 606 | 147.8 |
| D | 8 | 195 | 157583 | 1061.94 | 621 | 606 | 147.8 |
Histogram calculated using DETX and DETY for each event in the final _common_clean file
| Quadrant A | 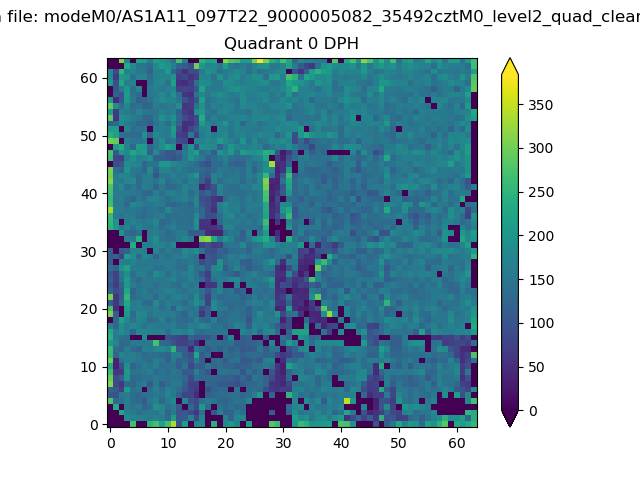 |
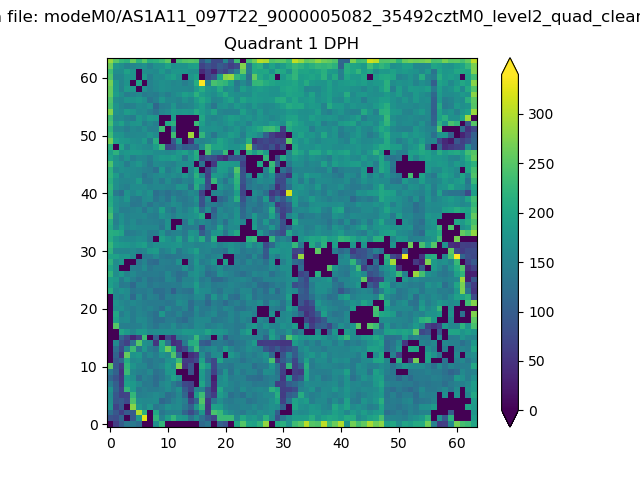 |
Quadrant B |
|---|---|---|---|
| Quadrant D | 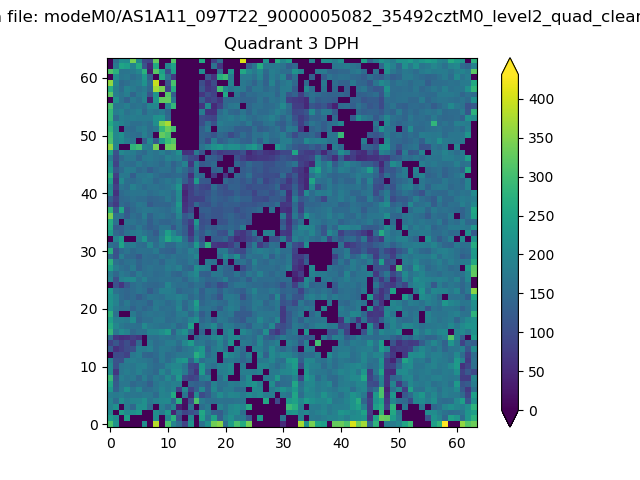 |
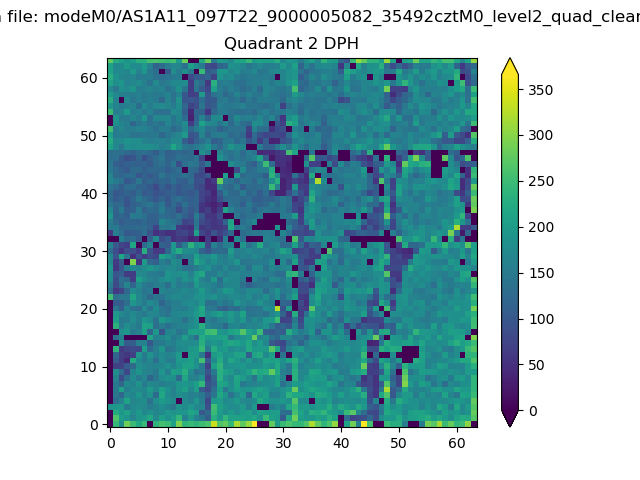 |
Quadrant C |
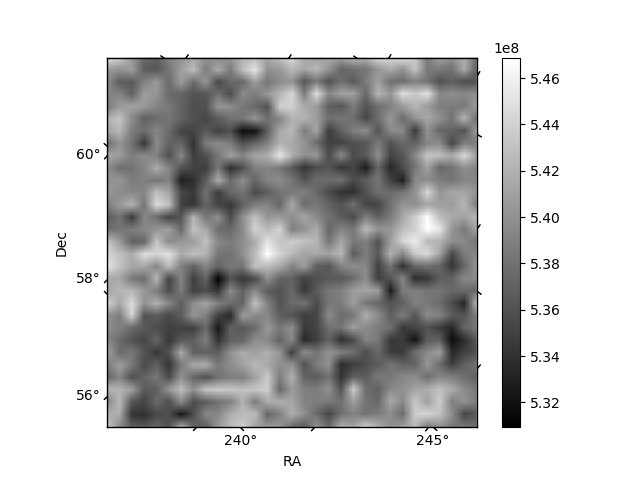
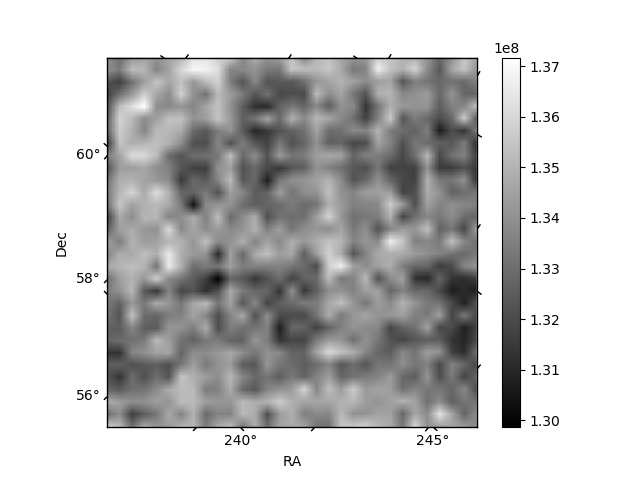
| Plot type | Count rate plots | Images |
|---|---|---|
| Comparison with Poisson distribution Blue bars denote a histogram of data divided into 1 sec bins. Red curve is a Poisson curve with rate = median count rate of data. |
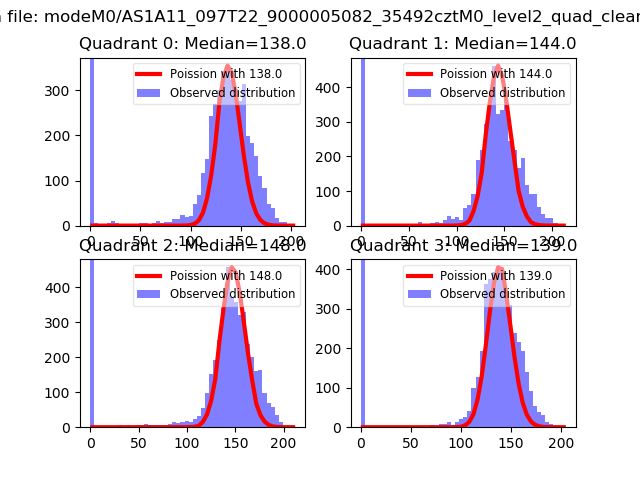 |
 |
| Quadrant-wise count rates Data is divided into 100 sec bins |
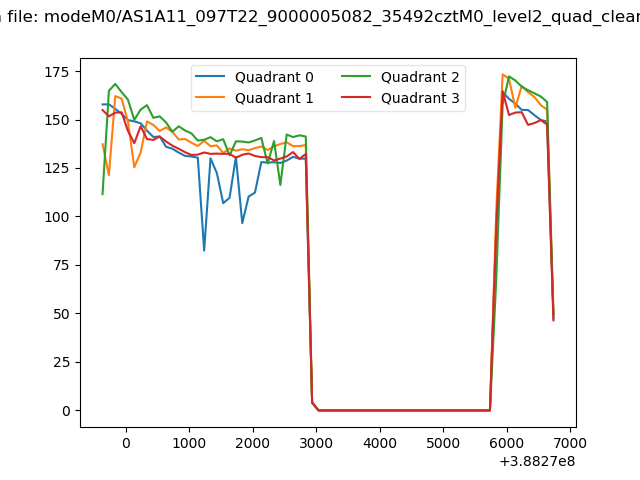 |
|
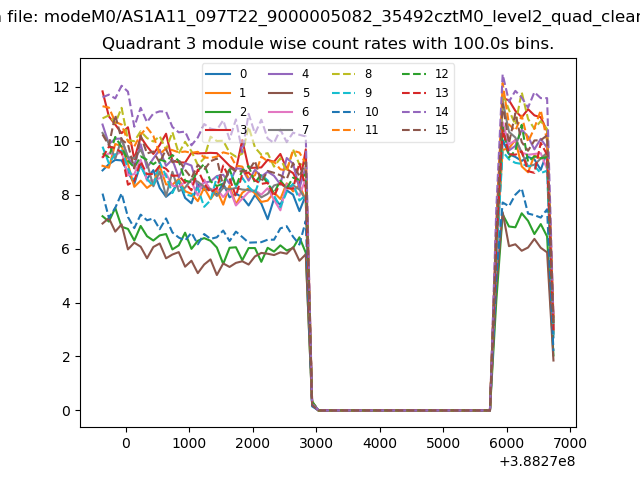
| Module-wise count rates for Quadrant A Data is divided into 100 sec bins |
 |
 |
| Module-wise count rates for Quadrant B Data is divided into 100 sec bins |
 |
 |
| Module-wise count rates for Quadrant C Data is divided into 100 sec bins |
 |
 |
| Module-wise count rates for Quadrant D Data is divided into 100 sec bins |
 |
 |
| Parameter | Plot |
|---|---|
| CZT HV Monitor |  |
| D_VDD | 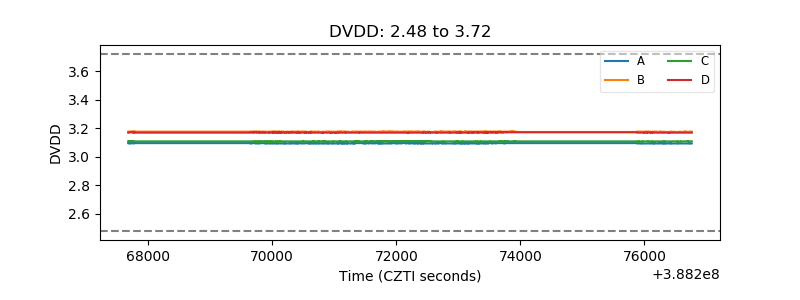 |
| Temperature 1 | 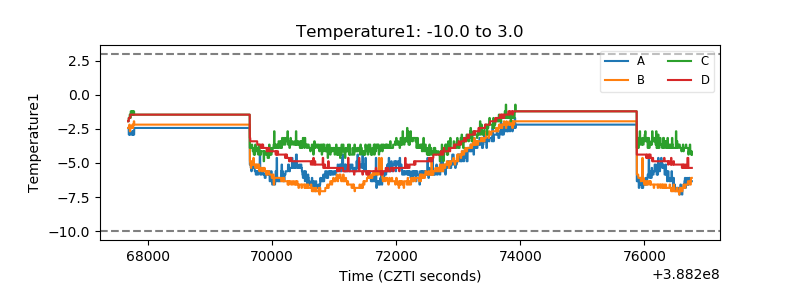 |
| Veto HV Monitor | 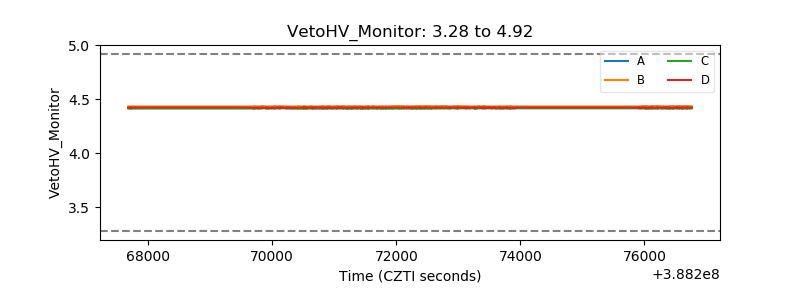 |
| Veto LLD | 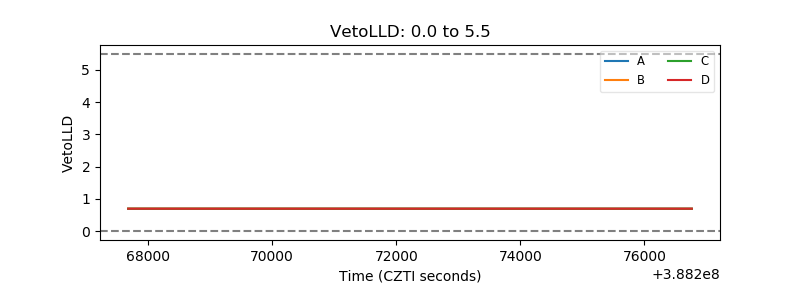 |
| Alpha Counter | 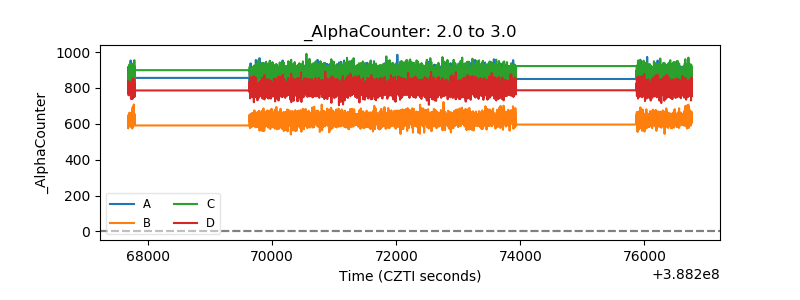 |
| _CPM_Rate | 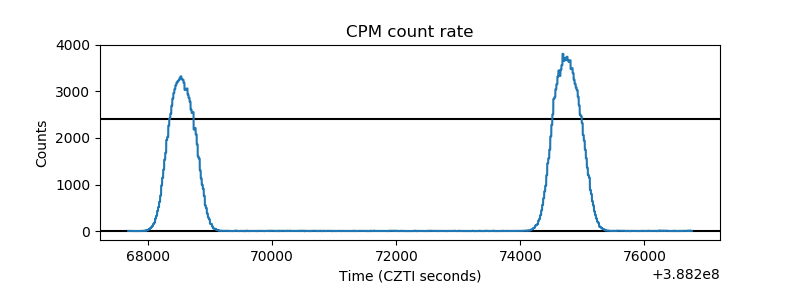 |
| CZT Counter | 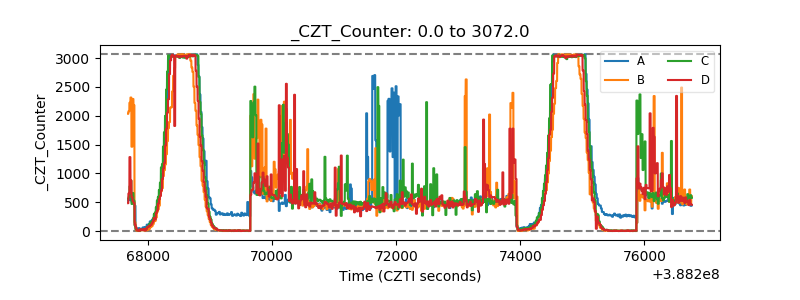 |
| +2.5 Volts monitor |  |
| +5 Volts monitor |  |
| _ROLL_ROT | 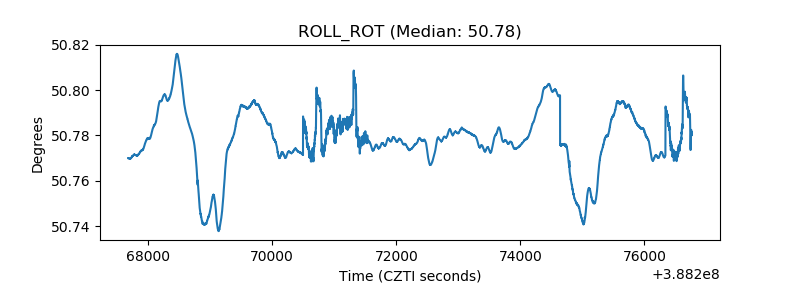 |
| _Roll_DEC | 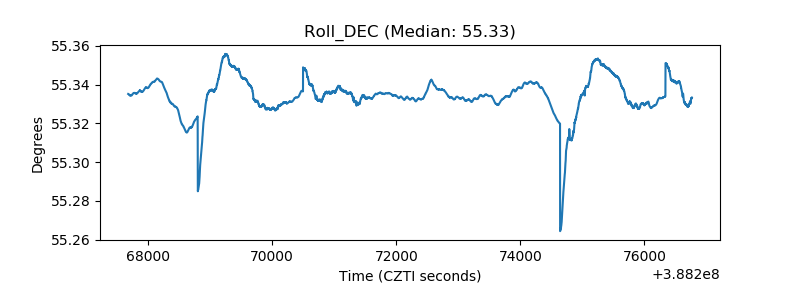 |
| _Roll_RA | 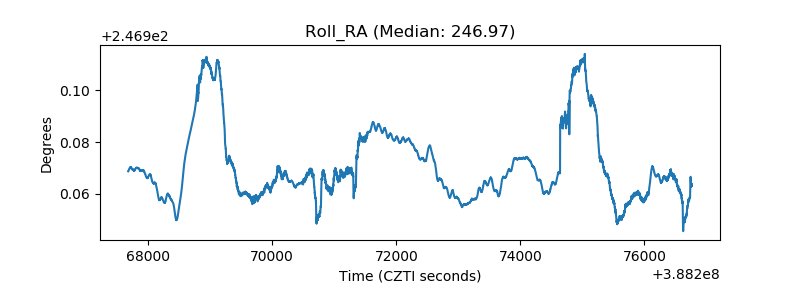 |
| Veto Counter | 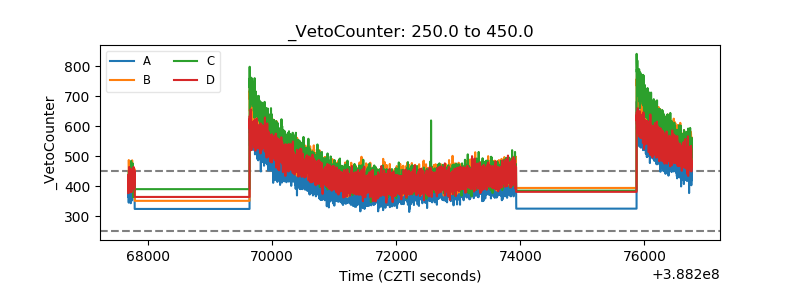 |