| Param | Original file | Final file |
|---|---|---|
| Filename | modeM0/AS1A11_097T22_9000005082_35493cztM0_level2.evt | modeM0/AS1A11_097T22_9000005082_35493cztM0_level2_quad_clean.evt |
| Size (bytes) | 422,415,360 | 83,689,920 |
| Size | 402.8 MB | 79.8 MB |
| Events in quadrant A | 2,722,763 | 531,586 |
| Events in quadrant B | 3,454,158 | 562,047 |
| Events in quadrant C | 3,406,629 | 561,851 |
| Events in quadrant D | 2,868,487 | 527,179 |
| Mode M9 | |||
|---|---|---|---|
| Quadrant | BADHDUFLAG | Total packets | Discarded packets |
| A | 0 | 33 | 0 |
| B | 0 | 33 | 0 |
| C | 0 | 33 | 0 |
| D | 0 | 34 | 0 |
| Mode M0 | |||
|---|---|---|---|
| Quadrant | BADHDUFLAG | Total packets | Discarded packets |
| A | 0 | 11053 | 3 |
| B | 0 | 13455 | 2 |
| C | 0 | 13235 | 2 |
| D | 0 | 11713 | 2 |
| Mode SS | |||
|---|---|---|---|
| Quadrant | BADHDUFLAG | Total packets | Discarded packets |
| A | 0 | 102 | 0 |
| B | 0 | 102 | 0 |
| C | 0 | 102 | 0 |
| D | 0 | 102 | 0 |
| Quadrant | Total seconds | Saturated seconds | Saturation percentage |
|---|---|---|---|
| A | 5016 | 35 | 0.697767% |
| B | 5016 | 377 | 7.515949% |
| C | 5016 | 216 | 4.306220% |
| D | 5016 | 66 | 1.315789% |
Noise dominated data is calculated using 1-second bins in cleaned event files. If a bin has >2000 counts, and if more than 50% of those come from <1% of pixels, then it is considered to be noise-dominated and hence unusable.
| Quadrant | # 1 sec bins | Bins with >0 counts | Bins with >2000 counts | High rate bins dominated by noise | Noise dominated (total time) | Noise dominated (detector-on time) | Marked lightcurve |
|---|---|---|---|---|---|---|---|
| A | 7108 | 5017 | 25 | 25 | 0.35% | 0.50% | 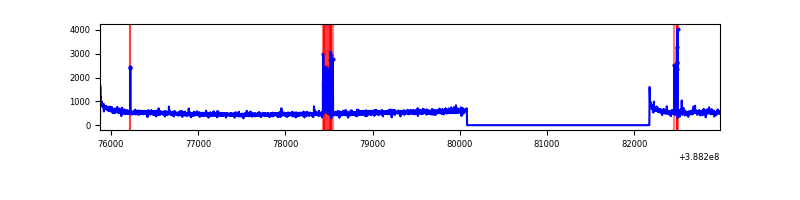 |
| B | 7108 | 5017 | 278 | 278 | 3.91% | 5.54% | 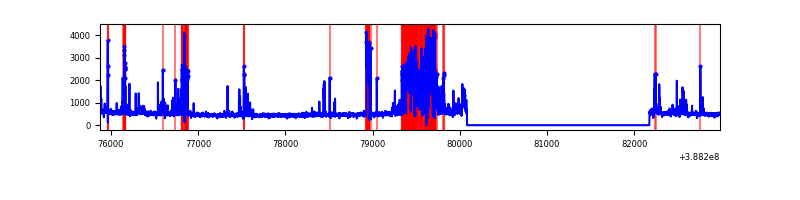 |
| C | 7108 | 5017 | 151 | 151 | 2.12% | 3.01% | 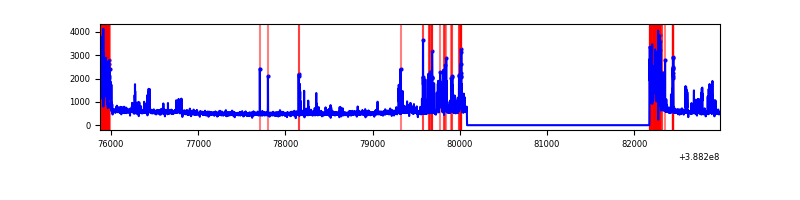 |
| D | 7108 | 5017 | 56 | 56 | 0.79% | 1.12% | 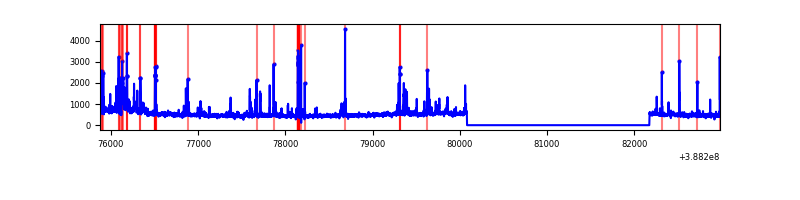 |
Top three noisy pixels from each quadrant. If the there are fewer than three noisy pixels in the level2.evt file, extra rows are filled as -1
| Pixel properties | Quadrant properties | ||||||
|---|---|---|---|---|---|---|---|
| Quadrant | DetID | PixID | Counts | Sigma | Mean | Median | Sigma |
| A | 15 | 169 | 263886 | 2195.68 | 600 | 590 | 119.9 |
| A | 10 | 83 | 127099 | 1054.99 | 600 | 590 | 119.9 |
| A | 9 | 143 | 7753 | 59.73 | 600 | 590 | 119.9 |
| B | 5 | 172 | 852006 | 7883.57 | 586 | 573 | 108.0 |
| B | 5 | 236 | 248110 | 2291.99 | 586 | 573 | 108.0 |
| B | 4 | 232 | 23800 | 215.06 | 586 | 573 | 108.0 |
| C | 0 | 10 | 464516 | 3391.98 | 597 | 603 | 136.8 |
| C | 15 | 214 | 207798 | 1514.94 | 597 | 603 | 136.8 |
| C | 1 | 23 | 194537 | 1417.98 | 597 | 603 | 136.8 |
| D | 7 | 80 | 235874 | 1682.9 | 587 | 572 | 139.8 |
| D | 8 | 195 | 151704 | 1080.91 | 587 | 572 | 139.8 |
| D | 13 | 249 | 126471 | 900.44 | 587 | 572 | 139.8 |
Histogram calculated using DETX and DETY for each event in the final _common_clean file
| Quadrant A | 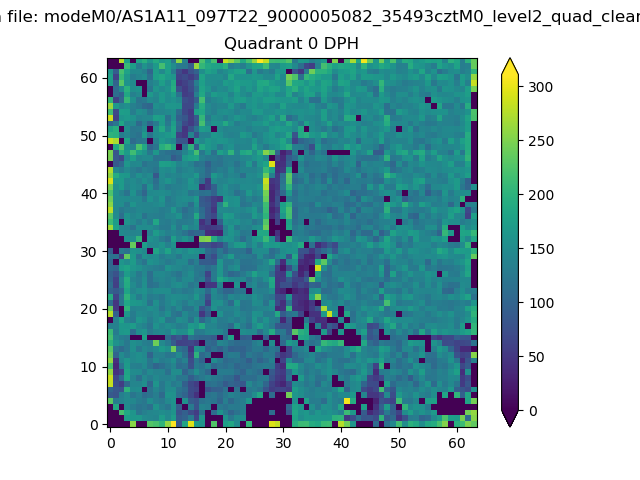 |
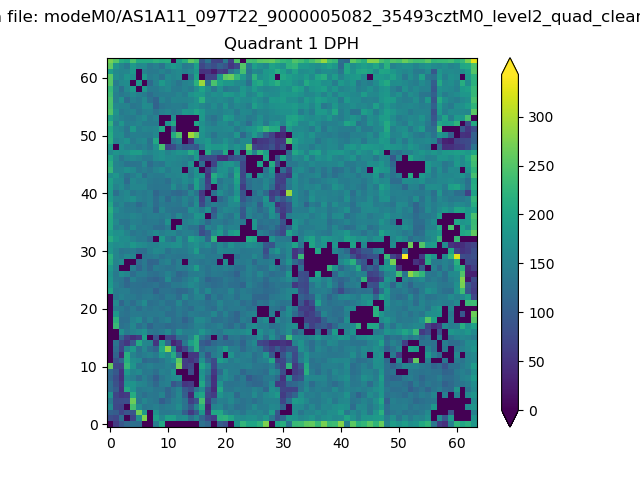 |
Quadrant B |
|---|---|---|---|
| Quadrant D | 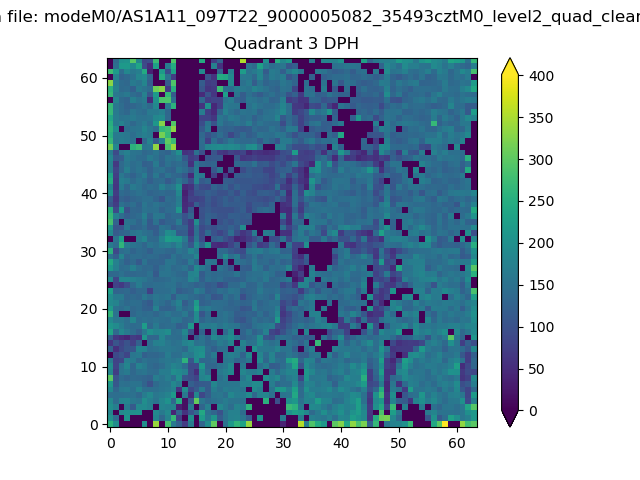 |
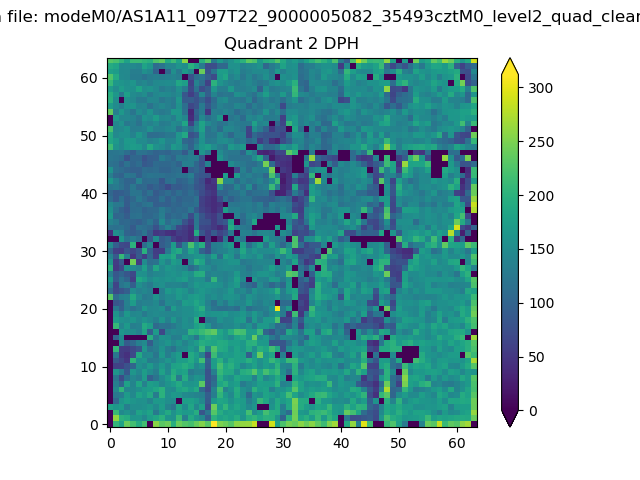 |
Quadrant C |
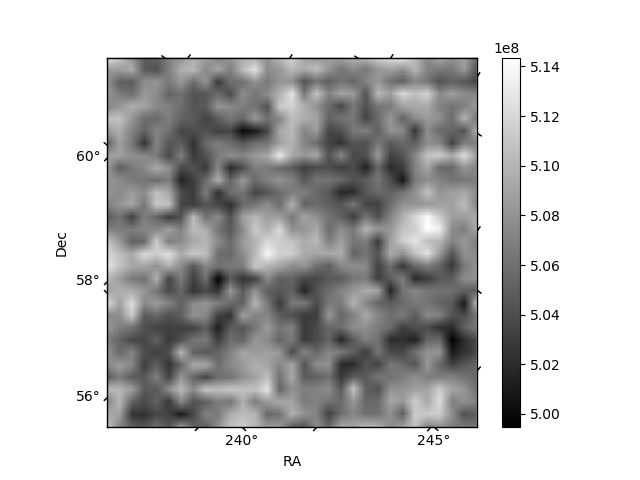
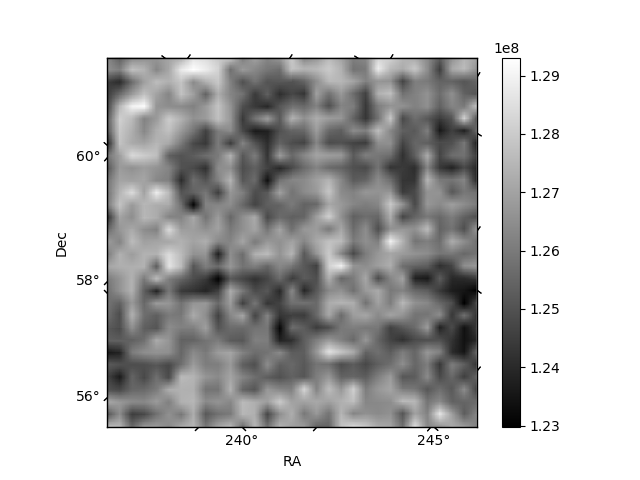
| Plot type | Count rate plots | Images |
|---|---|---|
| Comparison with Poisson distribution Blue bars denote a histogram of data divided into 1 sec bins. Red curve is a Poisson curve with rate = median count rate of data. |
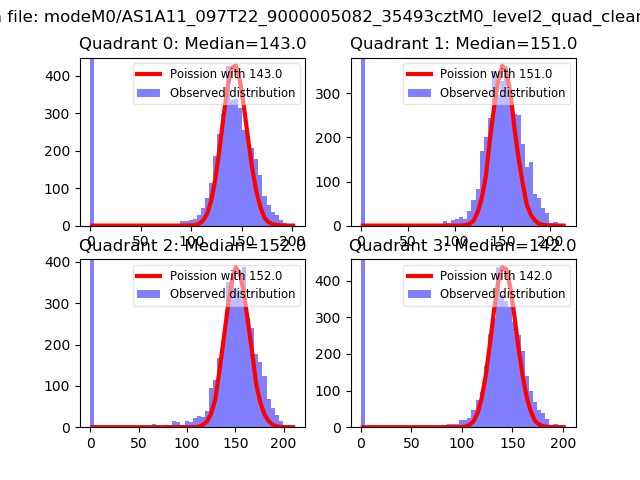 |
 |
| Quadrant-wise count rates Data is divided into 100 sec bins |
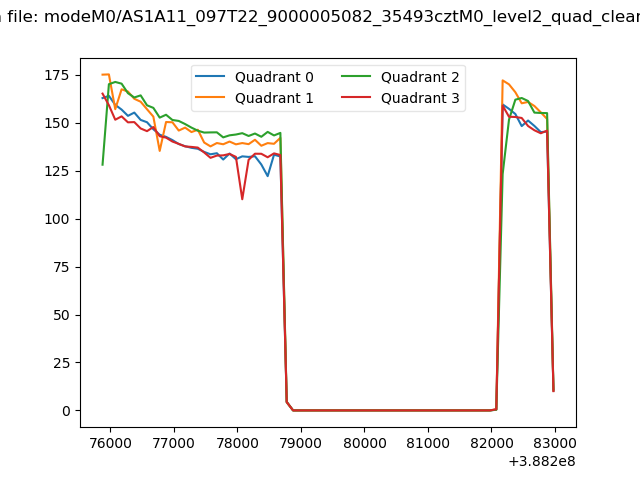 |
|
| Module-wise count rates for Quadrant A Data is divided into 100 sec bins |
 |
 |
| Module-wise count rates for Quadrant B Data is divided into 100 sec bins |
 |
 |
| Module-wise count rates for Quadrant C Data is divided into 100 sec bins |
 |
 |
| Module-wise count rates for Quadrant D Data is divided into 100 sec bins |
 |
 |
| Parameter | Plot |
|---|---|
| CZT HV Monitor |  |
| D_VDD | 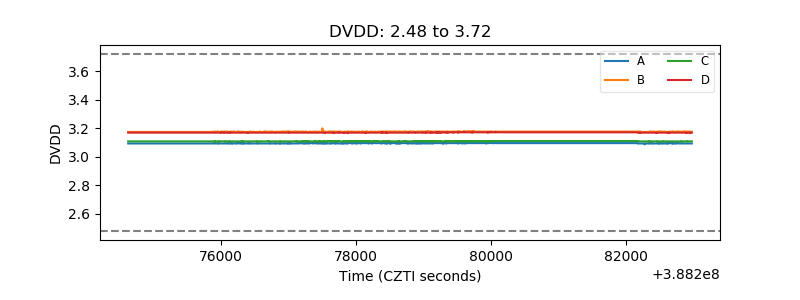 |
| Temperature 1 | 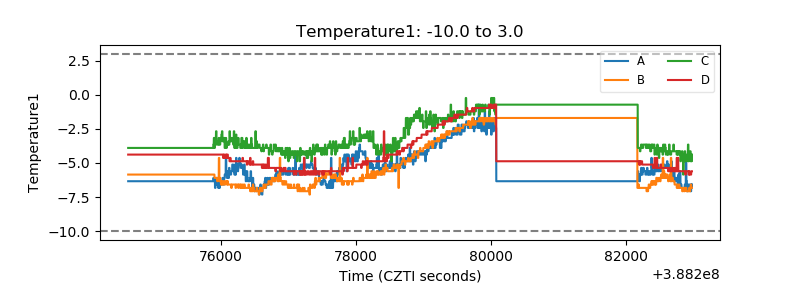 |
| Veto HV Monitor | 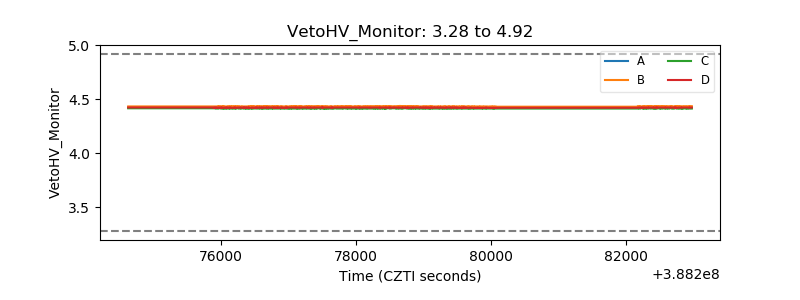 |
| Veto LLD | 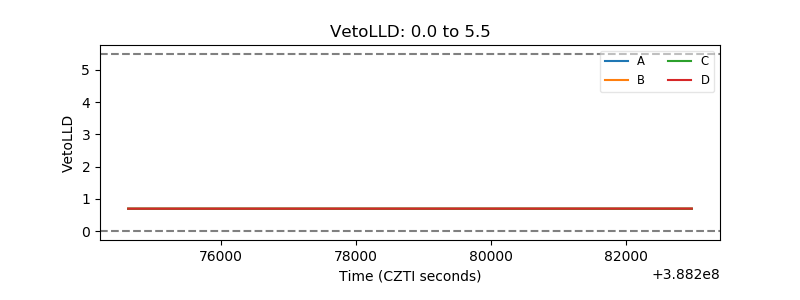 |
| Alpha Counter | 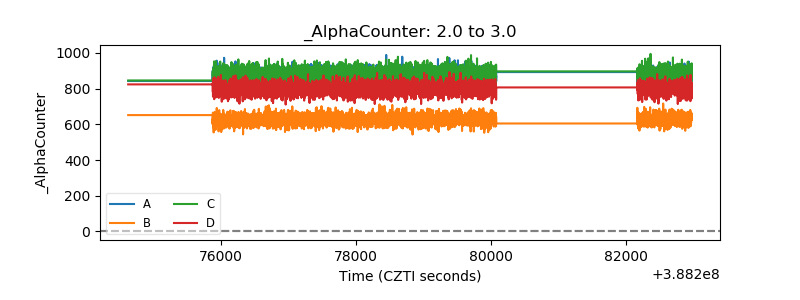 |
| _CPM_Rate | 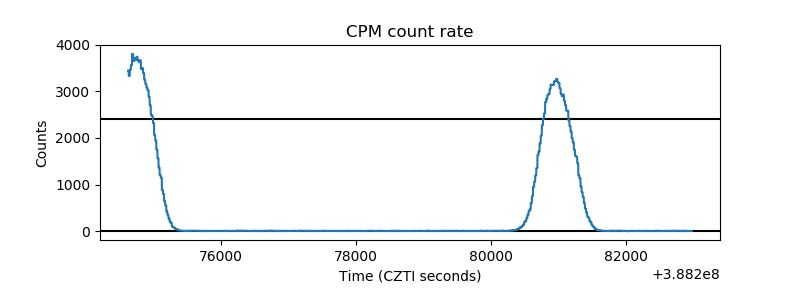 |
| CZT Counter | 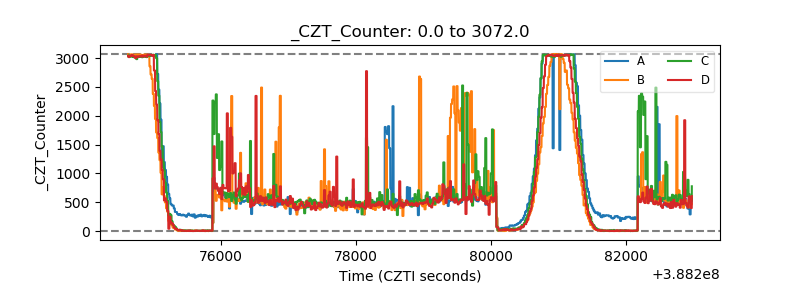 |
| +2.5 Volts monitor |  |
| +5 Volts monitor |  |
| _ROLL_ROT | 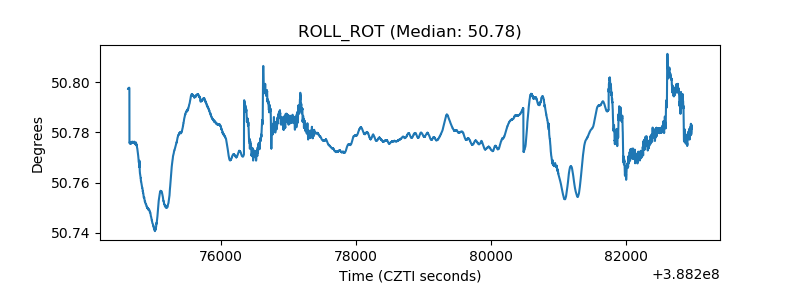 |
| _Roll_DEC | 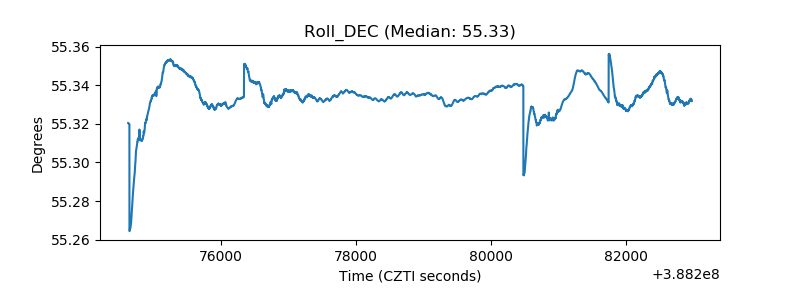 |
| _Roll_RA | 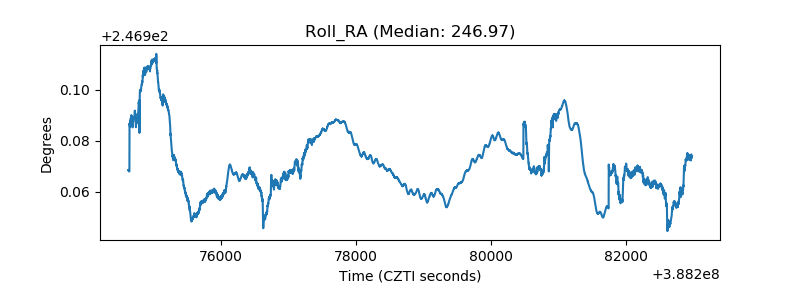 |
| Veto Counter | 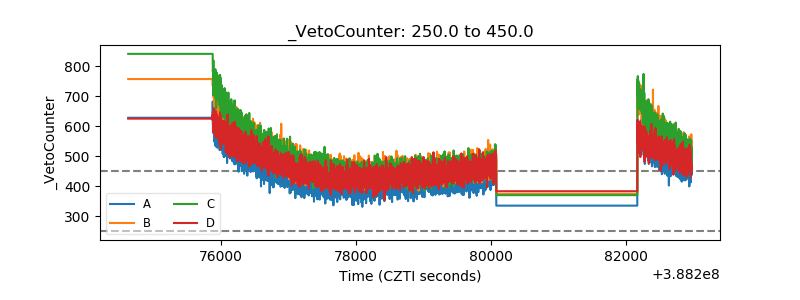 |