| Param | Original file | Final file |
|---|---|---|
| Filename | modeM0/AS1A11_097T22_9000005082_35506cztM0_level2.evt | modeM0/AS1A11_097T22_9000005082_35506cztM0_level2_quad_clean.evt |
| Size (bytes) | 64,218,240 | 7,948,800 |
| Size | 61.2 MB | 7.6 MB |
| Events in quadrant A | 523,612 | 46,274 |
| Events in quadrant B | 431,311 | 48,549 |
| Events in quadrant C | 523,713 | 42,607 |
| Events in quadrant D | 413,785 | 44,407 |
| Mode M9 | |||
|---|---|---|---|
| Quadrant | BADHDUFLAG | Total packets | Discarded packets |
| A | 0 | 17 | 0 |
| B | 0 | 17 | 0 |
| C | 0 | 17 | 0 |
| D | 0 | 17 | 0 |
| Mode M0 | |||
|---|---|---|---|
| Quadrant | BADHDUFLAG | Total packets | Discarded packets |
| A | 0 | 2036 | 1 |
| B | 0 | 1742 | 1 |
| C | 0 | 2025 | 1 |
| D | 0 | 1706 | 1 |
| Mode SS | |||
|---|---|---|---|
| Quadrant | BADHDUFLAG | Total packets | Discarded packets |
| A | 0 | 16 | 0 |
| B | 0 | 16 | 0 |
| C | 0 | 16 | 0 |
| D | 0 | 16 | 0 |
| Quadrant | Total seconds | Saturated seconds | Saturation percentage |
|---|---|---|---|
| A | 726 | 54 | 7.438017% |
| B | 726 | 7 | 0.964187% |
| C | 726 | 54 | 7.438017% |
| D | 726 | 6 | 0.826446% |
Noise dominated data is calculated using 1-second bins in cleaned event files. If a bin has >2000 counts, and if more than 50% of those come from <1% of pixels, then it is considered to be noise-dominated and hence unusable.
| Quadrant | # 1 sec bins | Bins with >0 counts | Bins with >2000 counts | High rate bins dominated by noise | Noise dominated (total time) | Noise dominated (detector-on time) | Marked lightcurve |
|---|---|---|---|---|---|---|---|
| A | 2488 | 727 | 47 | 47 | 1.89% | 6.46% | 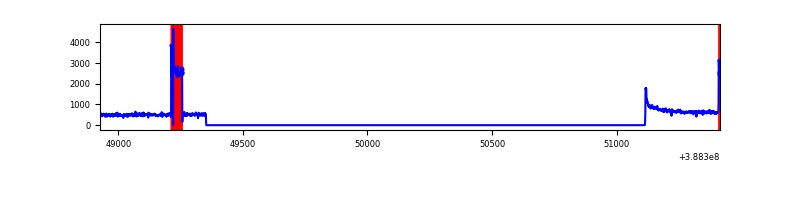 |
| B | 2488 | 727 | 1 | 1 | 0.04% | 0.14% | 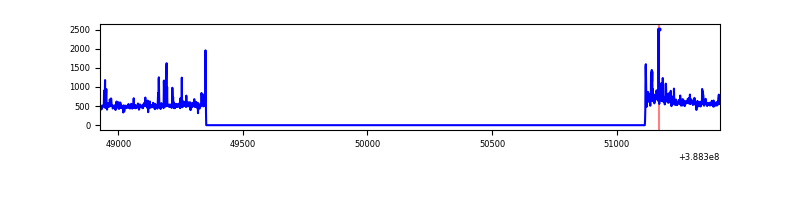 |
| C | 2488 | 727 | 30 | 30 | 1.21% | 4.13% | 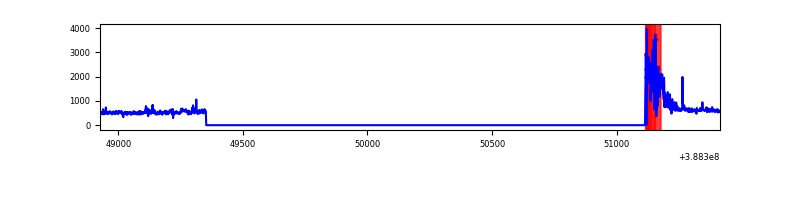 |
| D | 2488 | 727 | 5 | 5 | 0.20% | 0.69% | 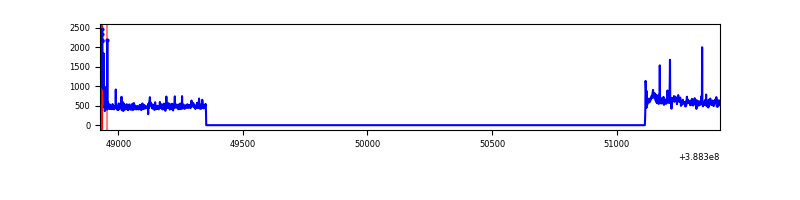 |
Top three noisy pixels from each quadrant. If the there are fewer than three noisy pixels in the level2.evt file, extra rows are filled as -1
| Pixel properties | Quadrant properties | ||||||
|---|---|---|---|---|---|---|---|
| Quadrant | DetID | PixID | Counts | Sigma | Mean | Median | Sigma |
| A | 15 | 169 | 129491 | 6450.59 | 89 | 87 | 20.1 |
| A | 10 | 83 | 42275 | 2103.01 | 89 | 87 | 20.1 |
| A | 10 | 67 | 2027 | 96.71 | 89 | 87 | 20.1 |
| B | 5 | 172 | 24124 | 1190.18 | 95 | 92 | 20.2 |
| B | 5 | 236 | 18911 | 932.01 | 95 | 92 | 20.2 |
| B | 0 | 190 | 5958 | 290.51 | 95 | 92 | 20.2 |
| C | 0 | 10 | 133236 | 5908.78 | 89 | 89 | 22.5 |
| C | 15 | 214 | 32624 | 1443.83 | 89 | 89 | 22.5 |
| C | 14 | 67 | 6689 | 292.89 | 89 | 89 | 22.5 |
| D | 13 | 249 | 27800 | 1144.5 | 93 | 90 | 24.2 |
| D | 7 | 80 | 8576 | 350.5 | 93 | 90 | 24.2 |
| D | 2 | 153 | 4637 | 187.8 | 93 | 90 | 24.2 |
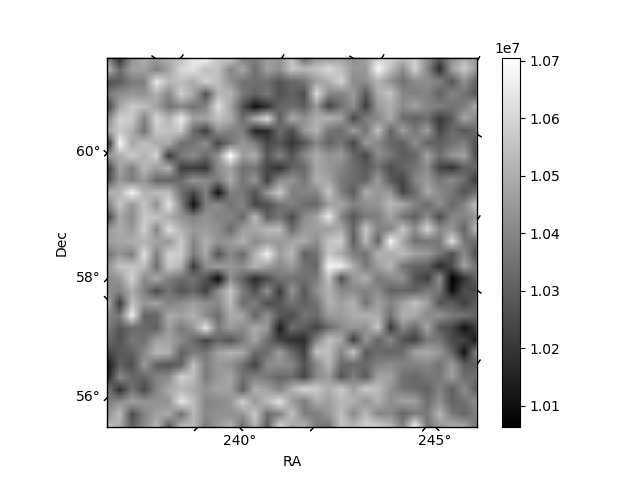
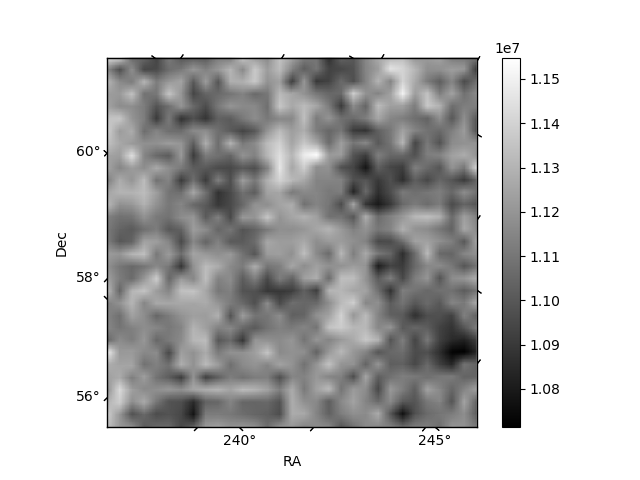
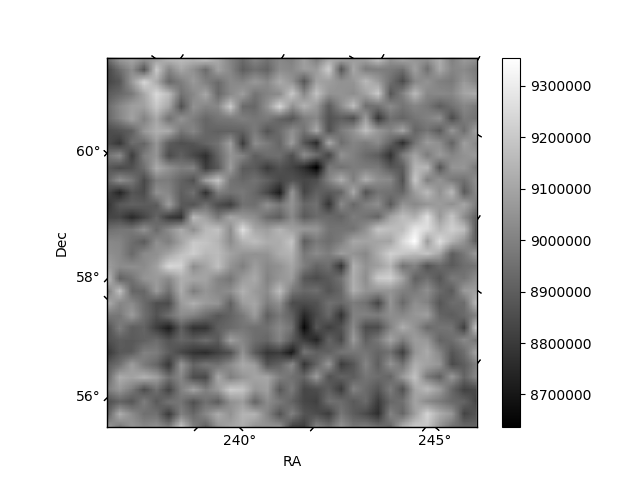
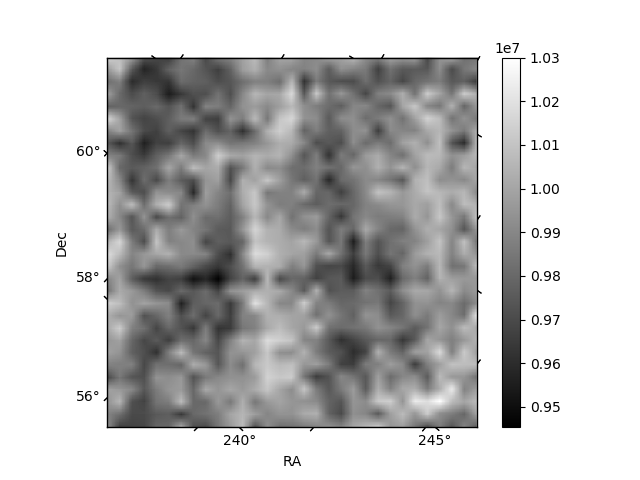
Histogram calculated using DETX and DETY for each event in the final _common_clean file
| Quadrant A | 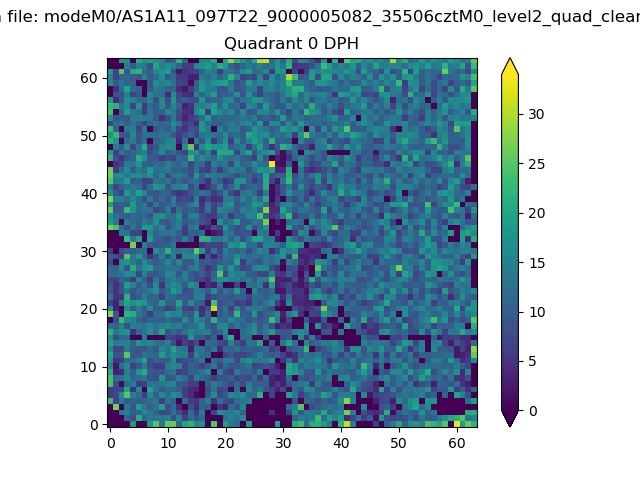 |
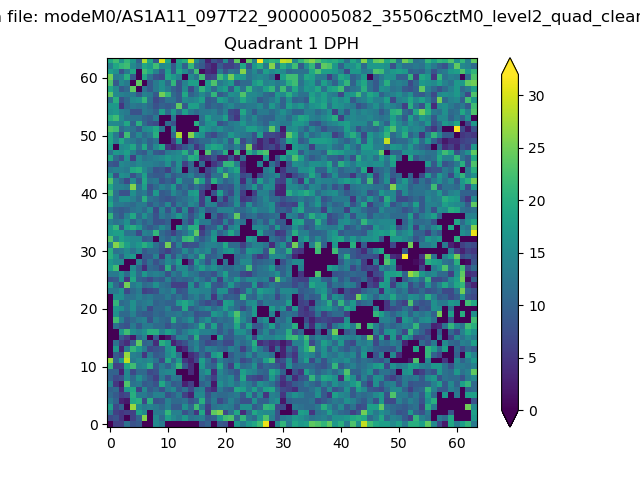 |
Quadrant B |
|---|---|---|---|
| Quadrant D | 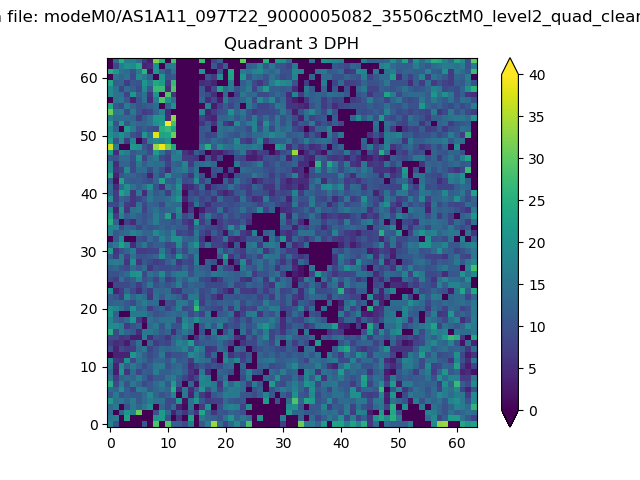 |
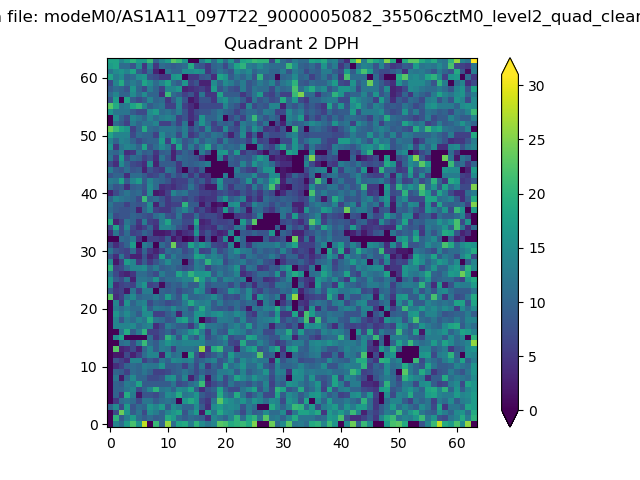 |
Quadrant C |
| Plot type | Count rate plots | Images |
|---|---|---|
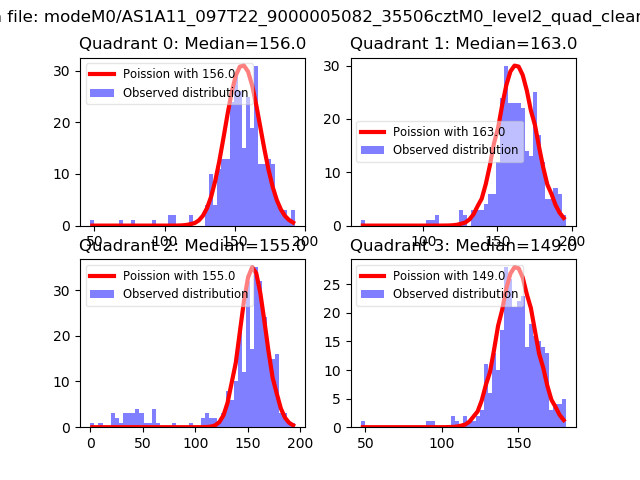
| Comparison with Poisson distribution Blue bars denote a histogram of data divided into 1 sec bins. Red curve is a Poisson curve with rate = median count rate of data. |
 |
 |
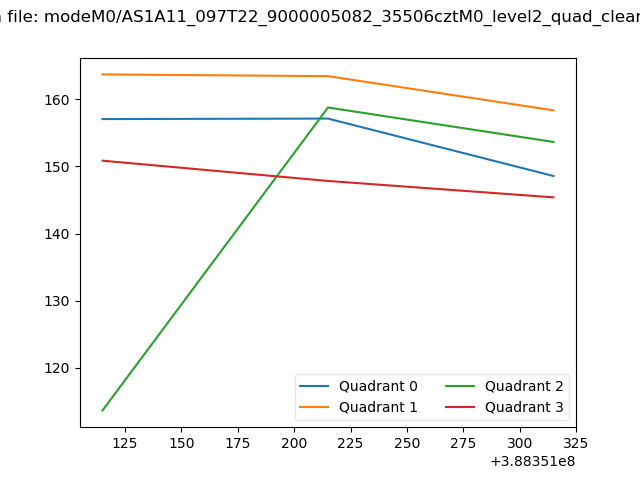
| Quadrant-wise count rates Data is divided into 100 sec bins |
 |
|
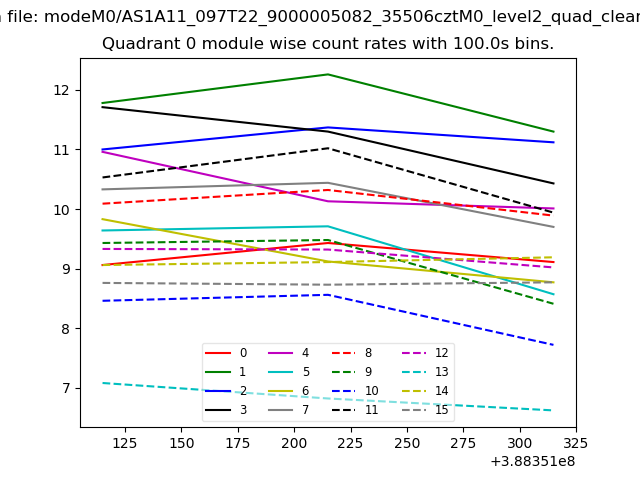
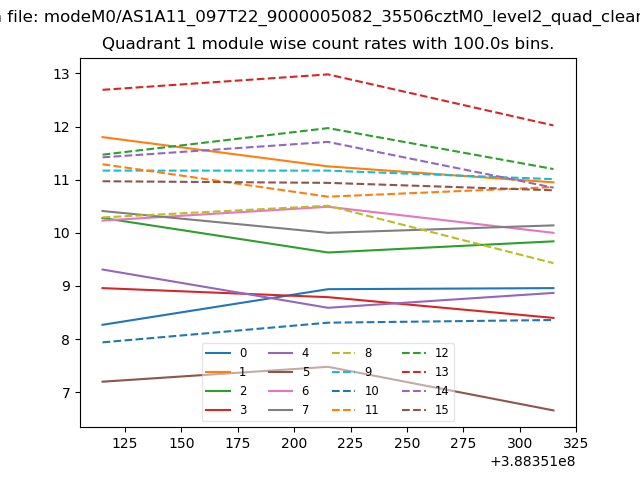
| Module-wise count rates for Quadrant A Data is divided into 100 sec bins |
 |
 |
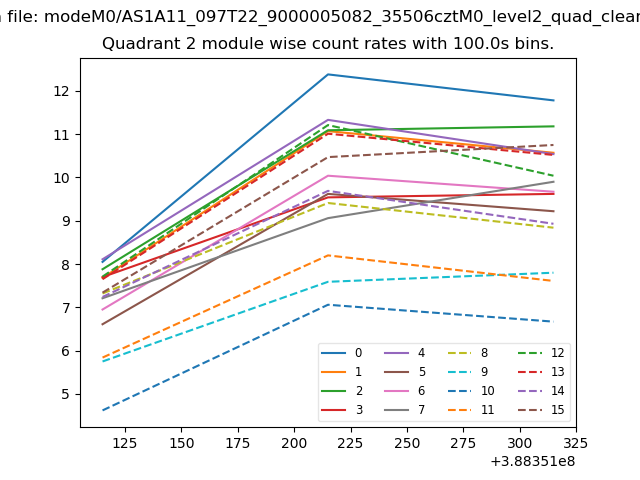
| Module-wise count rates for Quadrant B Data is divided into 100 sec bins |
 |
 |
| Module-wise count rates for Quadrant C Data is divided into 100 sec bins |
 |
 |
| Module-wise count rates for Quadrant D Data is divided into 100 sec bins |
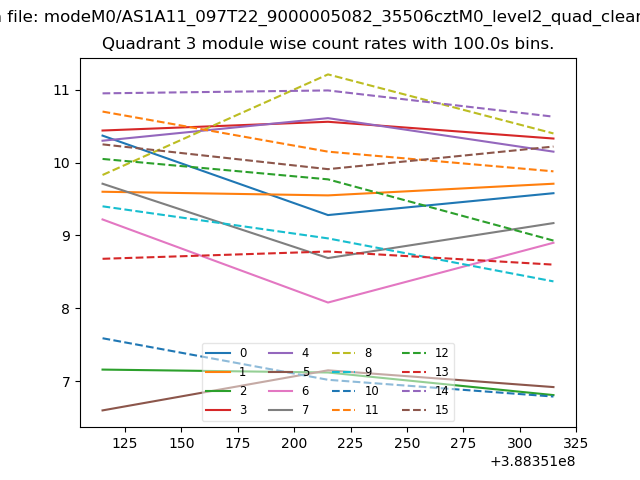 |
 |
| Parameter | Plot |
|---|---|
| CZT HV Monitor | 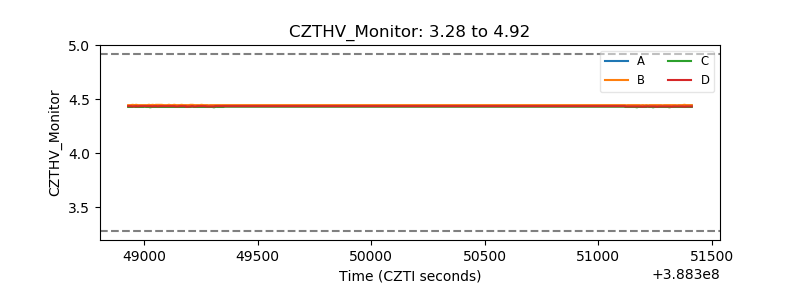 |
| D_VDD | 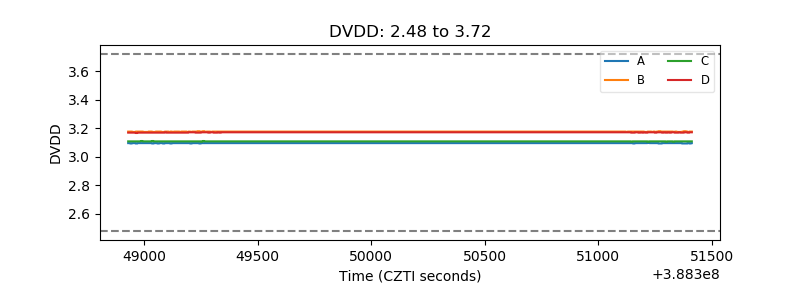 |
| Temperature 1 | 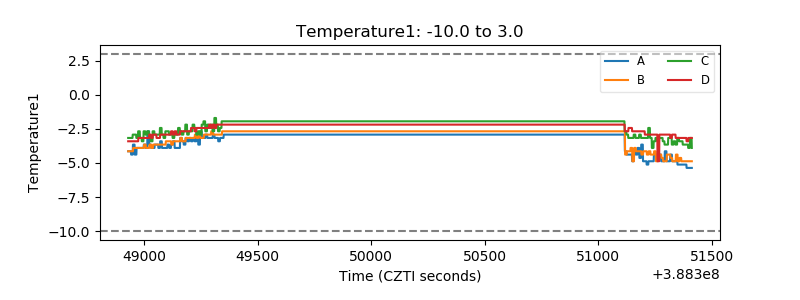 |
| Veto HV Monitor | 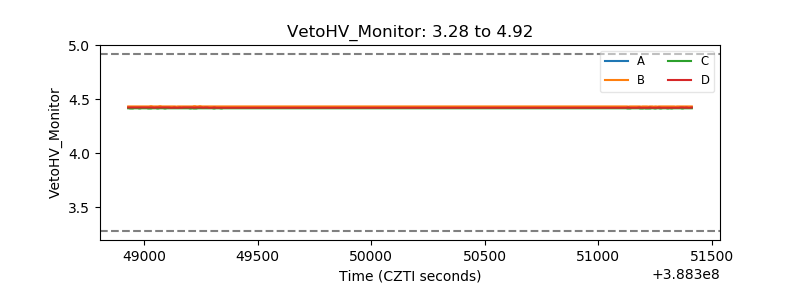 |
| Veto LLD | 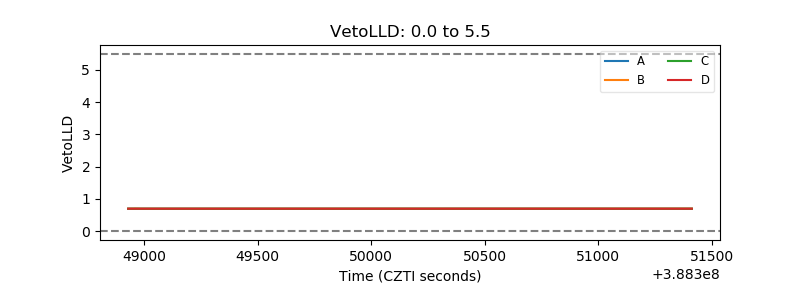 |
| Alpha Counter | 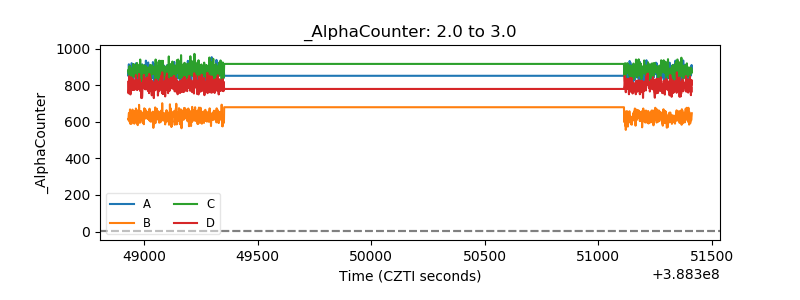 |
| _CPM_Rate | 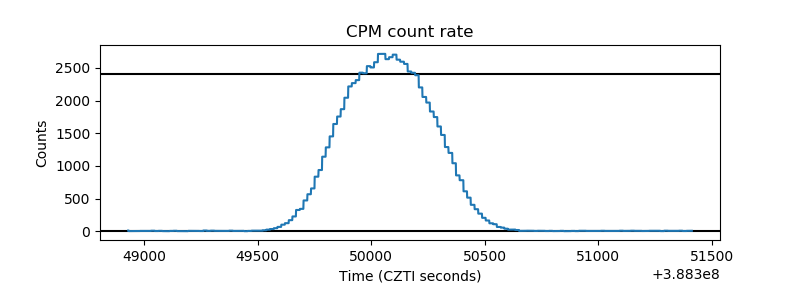 |
| CZT Counter | 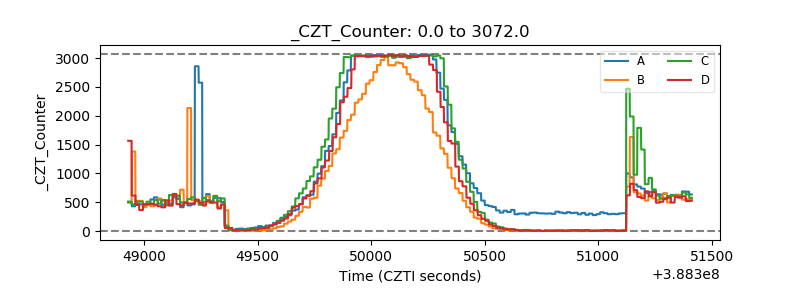 |
| +2.5 Volts monitor | 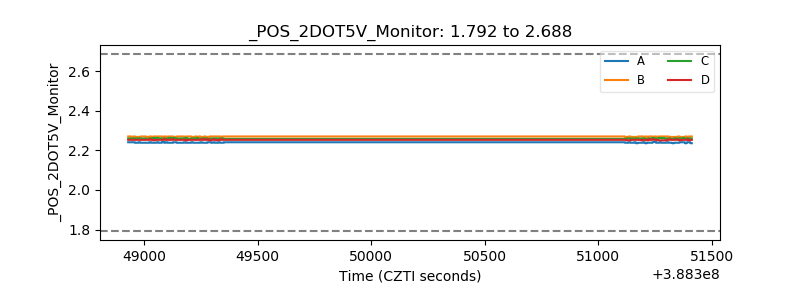 |
| +5 Volts monitor |  |
| _ROLL_ROT | 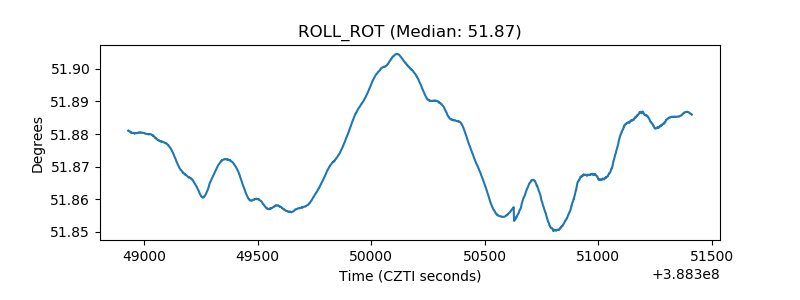 |
| _Roll_DEC | 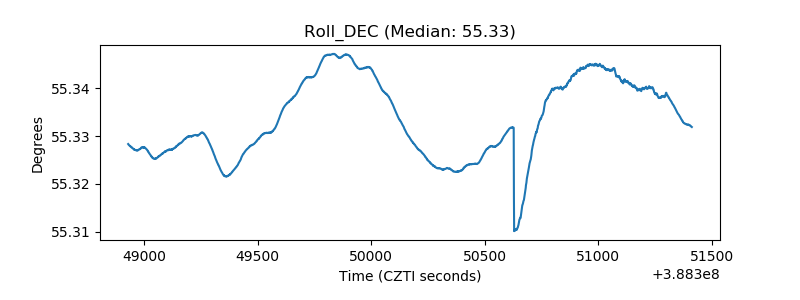 |
| _Roll_RA | 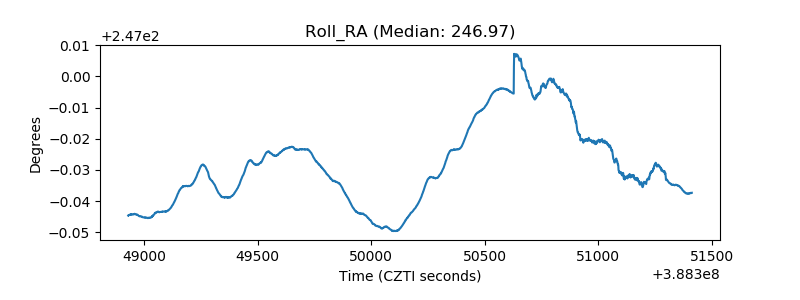 |
| Veto Counter | 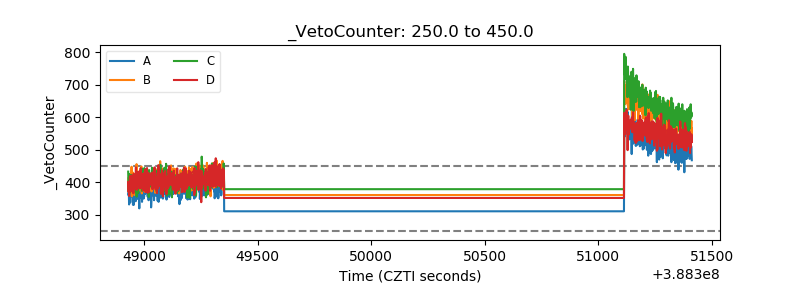 |