| Param | Original file | Final file |
|---|---|---|
| Filename | modeM0/AS1A11_097T07_9000005084cztM0_level2.fits | modeM0/AS1A11_097T07_9000005084cztM0_level2_quad_clean.evt |
| Size (bytes) | 536,244,480 | 478,676,160 |
| Size | 511.4 MB | 456.5 MB |
| Events in quadrant A | 3,284,314 | 2,800,759 |
| Events in quadrant B | 3,146,860 | 2,776,246 |
| Events in quadrant C | 3,183,364 | 2,650,212 |
| Events in quadrant D | 2,761,562 | 2,404,399 |
| Mode SS | |||
|---|---|---|---|
| Quadrant | BADHDUFLAG | Total packets | Discarded packets |
| A | 0 | 1150 | 0 |
| B | 0 | 1150 | 0 |
| C | 0 | 1150 | 0 |
| D | 0 | 1150 | 0 |
| Mode M0 | |||
|---|---|---|---|
| Quadrant | BADHDUFLAG | Total packets | Discarded packets |
| A | 0 | 117119 | 0 |
| B | 0 | 127527 | 0 |
| C | 0 | 136801 | 0 |
| D | 0 | 131360 | 0 |
| Mode M9 | |||
|---|---|---|---|
| Quadrant | BADHDUFLAG | Total packets | Discarded packets |
| A | 0 | 223 | 0 |
| B | 0 | 223 | 0 |
| C | 0 | 223 | 0 |
| D | 0 | 223 | 0 |
| Quadrant | Total seconds | Saturated seconds | Saturation percentage |
|---|---|---|---|
| A | 56324 | 260 | 0.461615% |
| B | 56324 | 844 | 1.498473% |
| C | 56324 | 1286 | 2.283219% |
| D | 56324 | 1125 | 1.997372% |
Noise dominated data is calculated using 1-second bins in cleaned event files. If a bin has >2000 counts, and if more than 50% of those come from <1% of pixels, then it is considered to be noise-dominated and hence unusable.
| Quadrant | # 1 sec bins | Bins with >0 counts | Bins with >2000 counts | High rate bins dominated by noise | Noise dominated (total time) | Noise dominated (detector-on time) | Marked lightcurve |
|---|---|---|---|---|---|---|---|
| A | 82340 | 56325 | 0 | 0 | 0.00% | 0.00% | 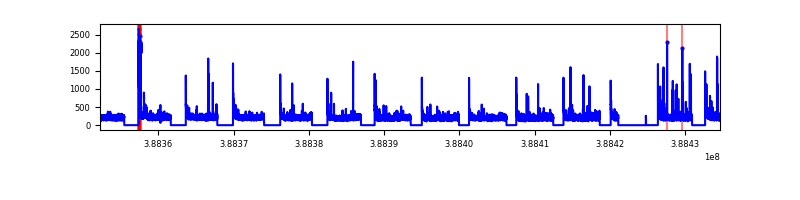 |
| B | 82340 | 56314 | 0 | 0 | 0.00% | 0.00% | 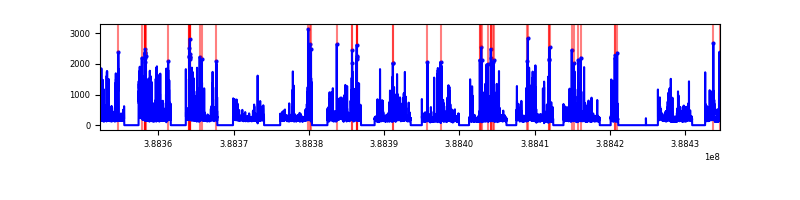 |
| C | 82340 | 56296 | 0 | 0 | 0.00% | 0.00% | 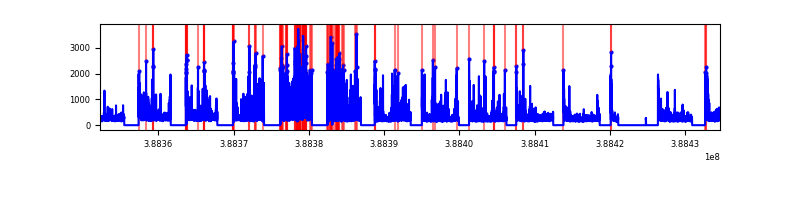 |
| D | 82340 | 56317 | 0 | 0 | 0.00% | 0.00% | 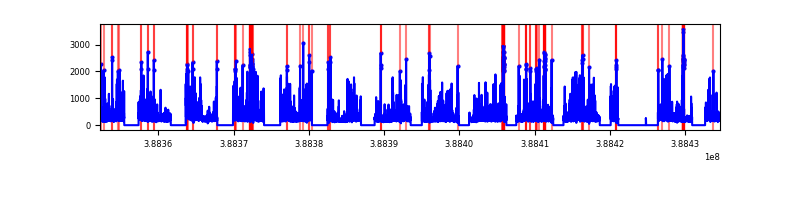 |
Top three noisy pixels from each quadrant. If the there are fewer than three noisy pixels in the level2.evt file, extra rows are filled as -1
| Pixel properties | Quadrant properties | ||||||
|---|---|---|---|---|---|---|---|
| Quadrant | DetID | PixID | Counts | Sigma | Mean | Median | Sigma |
| A | 0 | 29 | 2735 | 9.01 | 857 | 803 | 214.4 |
| A | 7 | 110 | 2660 | 8.66 | 857 | 803 | 214.4 |
| A | 9 | 19 | 2592 | 8.34 | 857 | 803 | 214.4 |
| B | 2 | 9 | 2700 | 11.51 | 832 | 794 | 165.6 |
| B | 3 | 80 | 2370 | 9.52 | 832 | 794 | 165.6 |
| B | 2 | 8 | 2265 | 8.88 | 832 | 794 | 165.6 |
| C | 1 | 81 | 2600 | 8.36 | 840 | 786 | 217.0 |
| C | 1 | 80 | 2560 | 8.18 | 840 | 786 | 217.0 |
| C | 3 | 202 | 2527 | 8.02 | 840 | 786 | 217.0 |
| D | 10 | 189 | 2058 | 6.31 | 791 | 724 | 211.6 |
| D | 7 | 3 | 2058 | 6.31 | 791 | 724 | 211.6 |
| D | 4 | 160 | 2037 | 6.21 | 791 | 724 | 211.6 |
Histogram calculated using DETX and DETY for each event in the final _common_clean file
| Quadrant A |  |
 |
Quadrant B |
|---|---|---|---|
| Quadrant D |  |
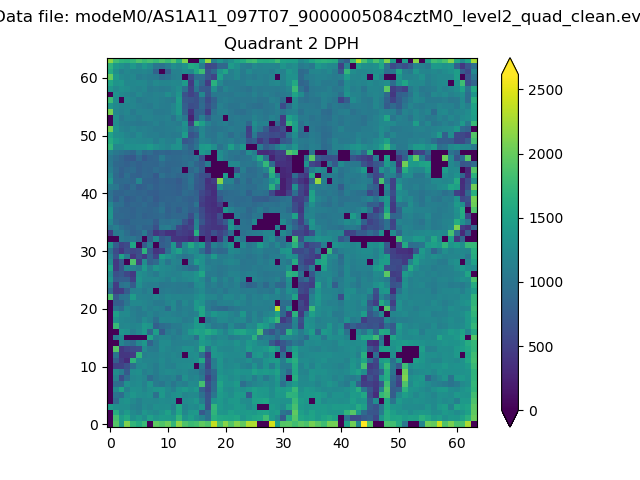 |
Quadrant C |
| Plot type | Count rate plots | Images |
|---|---|---|
| Comparison with Poisson distribution Blue bars denote a histogram of data divided into 1 sec bins. Red curve is a Poisson curve with rate = median count rate of data. |
 |
 |
| Quadrant-wise count rates Data is divided into 100 sec bins |
 |
|
| Module-wise count rates for Quadrant A Data is divided into 100 sec bins |
 |
 |
| Module-wise count rates for Quadrant B Data is divided into 100 sec bins |
 |
 |
| Module-wise count rates for Quadrant C Data is divided into 100 sec bins |
 |
 |
| Module-wise count rates for Quadrant D Data is divided into 100 sec bins |
 |
 |
| Parameter | Plot |
|---|---|
| CZT HV Monitor | 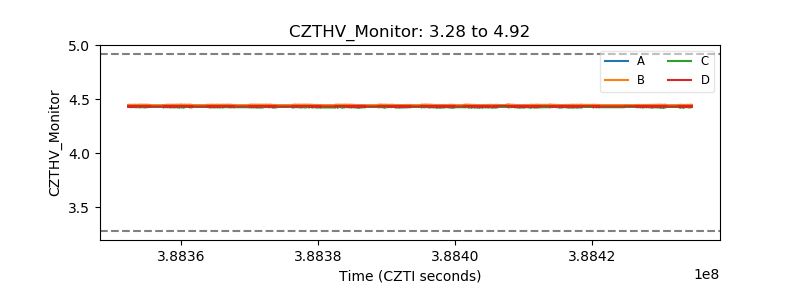 |
| D_VDD |  |
| Temperature 1 |  |
| Veto HV Monitor | 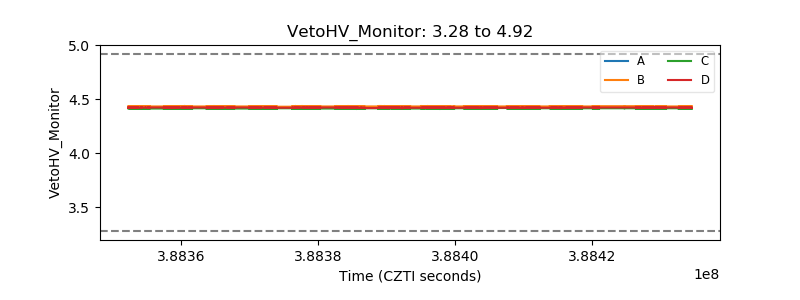 |
| Veto LLD |  |
| Alpha Counter |  |
| _CPM_Rate |  |
| CZT Counter |  |
| +2.5 Volts monitor |  |
| +5 Volts monitor |  |
| _ROLL_ROT | 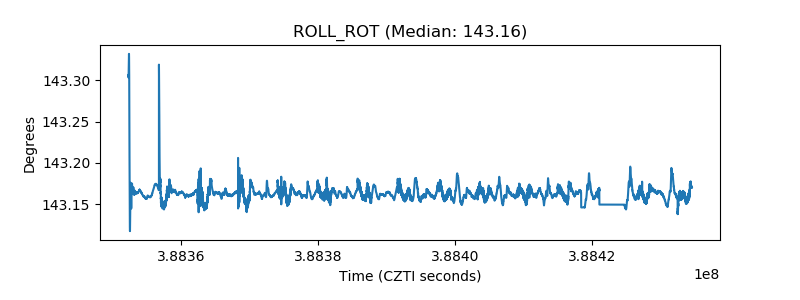 |
| _Roll_DEC | 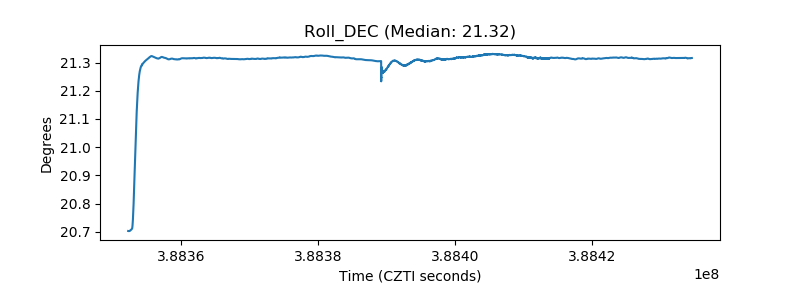 |
| _Roll_RA | 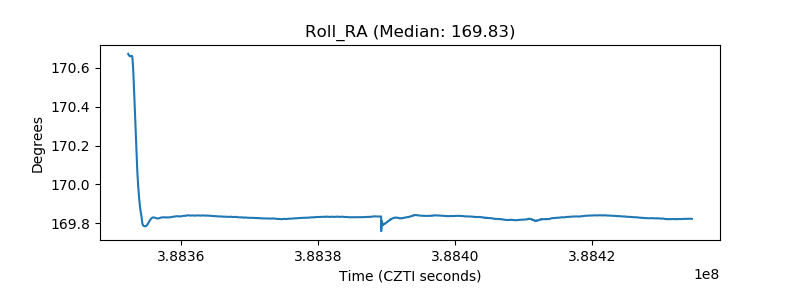 |
| Veto Counter | 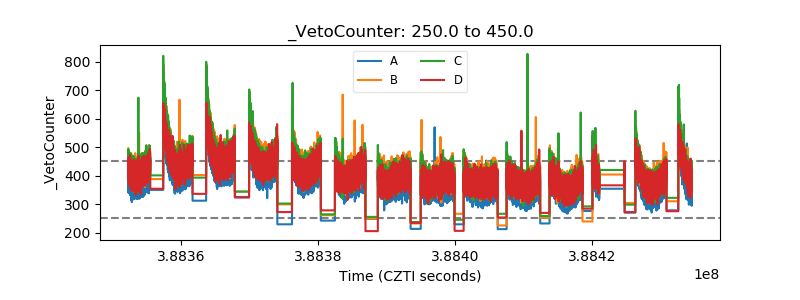 |