| Param | Original file | Final file |
|---|---|---|
| Filename | modeM0/AS1A11_097T09_9000005086_35520cztM0_level2.evt | modeM0/AS1A11_097T09_9000005086_35520cztM0_level2_quad_clean.evt |
| Size (bytes) | 232,329,600 | 27,495,360 |
| Size | 221.6 MB | 26.2 MB |
| Events in quadrant A | 1,515,072 | 159,545 |
| Events in quadrant B | 1,829,245 | 159,845 |
| Events in quadrant C | 1,907,821 | 153,355 |
| Events in quadrant D | 1,585,164 | 152,236 |
| Mode SS | |||
|---|---|---|---|
| Quadrant | BADHDUFLAG | Total packets | Discarded packets |
| A | 0 | 60 | 0 |
| B | 0 | 60 | 0 |
| C | 0 | 60 | 0 |
| D | 0 | 60 | 0 |
| Mode M0 | |||
|---|---|---|---|
| Quadrant | BADHDUFLAG | Total packets | Discarded packets |
| A | 0 | 6223 | 2 |
| B | 0 | 7199 | 1 |
| C | 0 | 7483 | 1 |
| D | 0 | 6610 | 1 |
| Mode M9 | |||
|---|---|---|---|
| Quadrant | BADHDUFLAG | Total packets | Discarded packets |
| A | 0 | 18 | 0 |
| B | 0 | 18 | 0 |
| C | 0 | 18 | 0 |
| D | 0 | 18 | 0 |
| Quadrant | Total seconds | Saturated seconds | Saturation percentage |
|---|---|---|---|
| A | 2899 | 6 | 0.206968% |
| B | 2899 | 158 | 5.450155% |
| C | 2899 | 75 | 2.587099% |
| D | 2899 | 51 | 1.759227% |
Noise dominated data is calculated using 1-second bins in cleaned event files. If a bin has >2000 counts, and if more than 50% of those come from <1% of pixels, then it is considered to be noise-dominated and hence unusable.
| Quadrant | # 1 sec bins | Bins with >0 counts | Bins with >2000 counts | High rate bins dominated by noise | Noise dominated (total time) | Noise dominated (detector-on time) | Marked lightcurve |
|---|---|---|---|---|---|---|---|
| A | 4752 | 2900 | 3 | 3 | 0.06% | 0.10% | 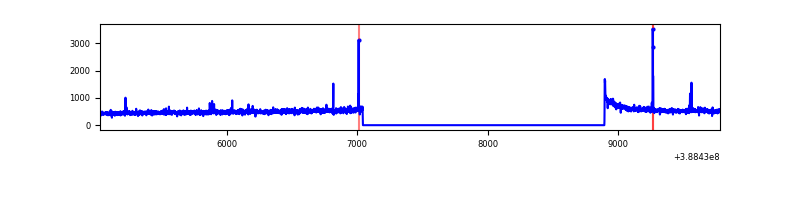 |
| B | 4752 | 2900 | 122 | 122 | 2.57% | 4.21% | 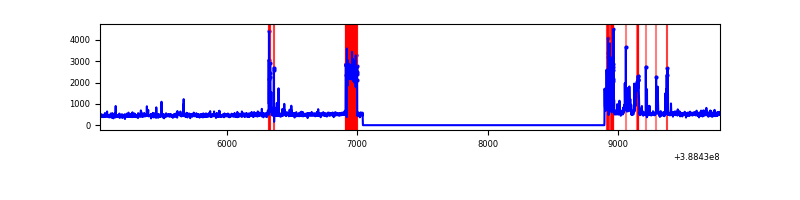 |
| C | 4752 | 2900 | 47 | 47 | 0.99% | 1.62% | 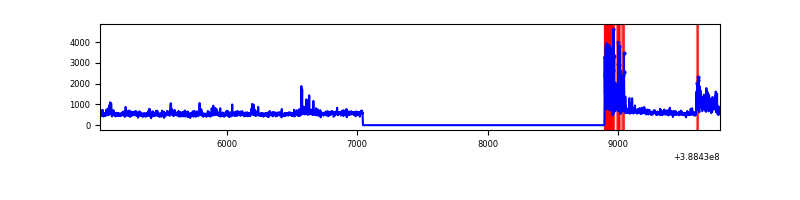 |
| D | 4752 | 2900 | 45 | 45 | 0.95% | 1.55% | 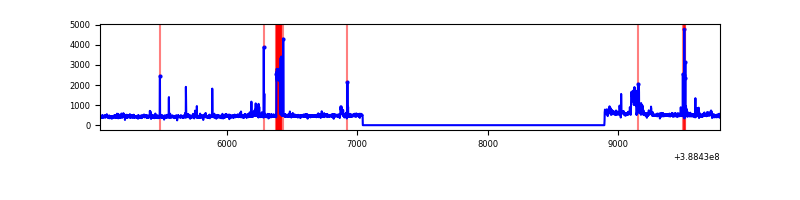 |
Top three noisy pixels from each quadrant. If the there are fewer than three noisy pixels in the level2.evt file, extra rows are filled as -1
| Pixel properties | Quadrant properties | ||||||
|---|---|---|---|---|---|---|---|
| Quadrant | DetID | PixID | Counts | Sigma | Mean | Median | Sigma |
| A | 10 | 83 | 68804 | 949.7 | 351 | 344 | 72.1 |
| A | 15 | 169 | 58248 | 803.26 | 351 | 344 | 72.1 |
| A | 10 | 255 | 12088 | 162.92 | 351 | 344 | 72.1 |
| B | 5 | 200 | 233480 | 3469.89 | 342 | 333 | 67.2 |
| B | 5 | 172 | 227263 | 3377.36 | 342 | 333 | 67.2 |
| B | 5 | 236 | 11340 | 163.81 | 342 | 333 | 67.2 |
| C | 0 | 10 | 269227 | 3370.54 | 340 | 343 | 79.8 |
| C | 15 | 214 | 120499 | 1506.19 | 340 | 343 | 79.8 |
| C | 0 | 239 | 105078 | 1312.88 | 340 | 343 | 79.8 |
| D | 13 | 249 | 130543 | 1572.73 | 339 | 330 | 82.8 |
| D | 10 | 199 | 68086 | 818.37 | 339 | 330 | 82.8 |
| D | 8 | 195 | 57716 | 693.12 | 339 | 330 | 82.8 |
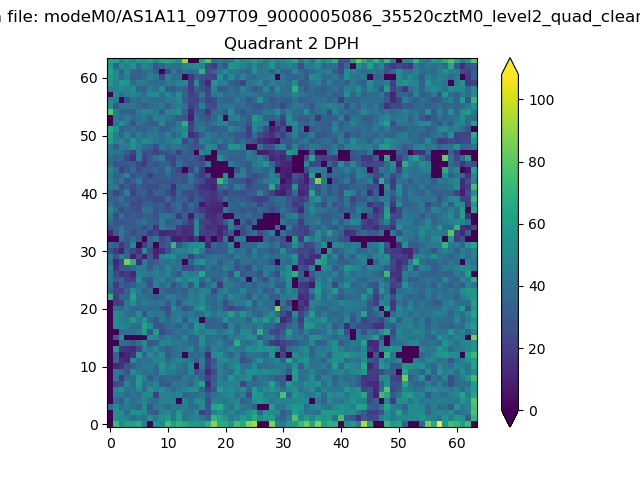
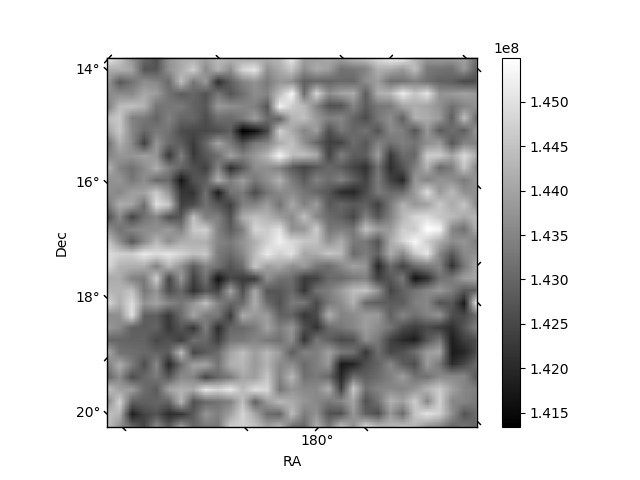
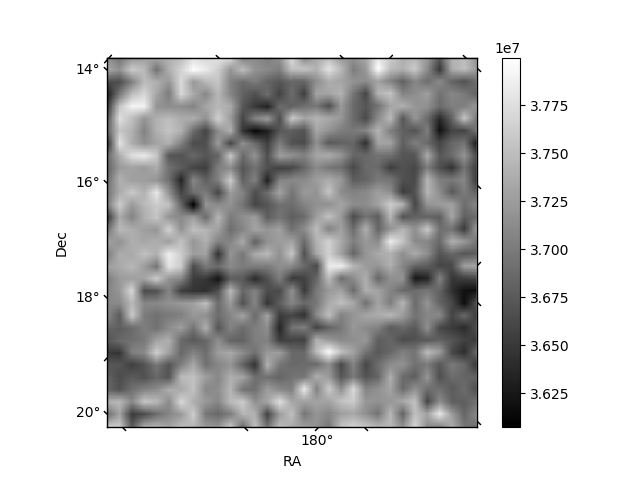
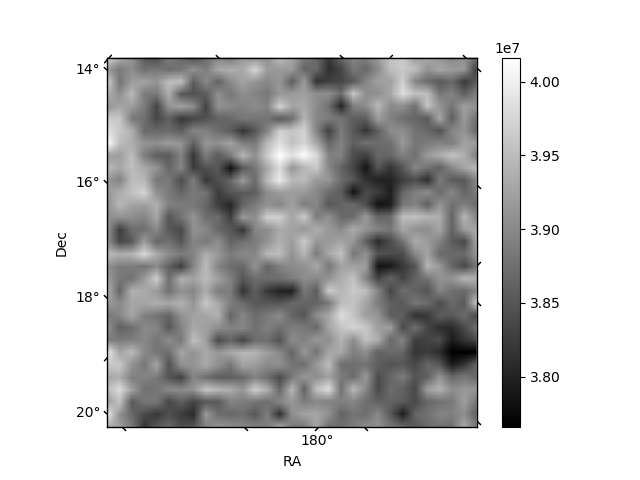
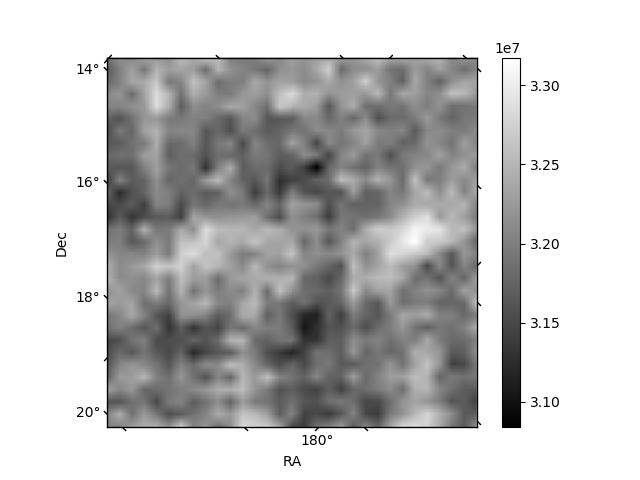
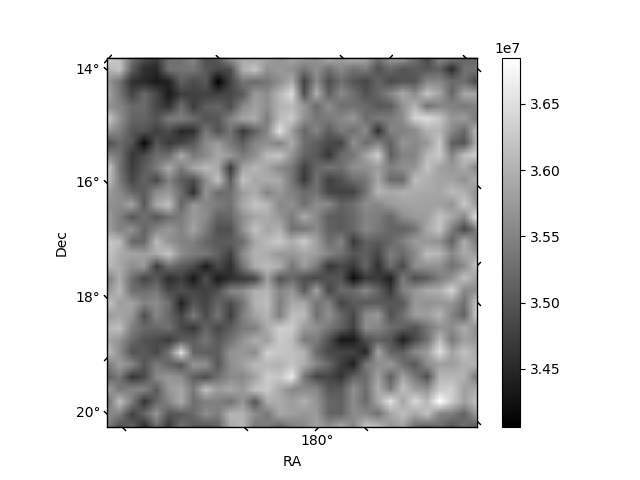
Histogram calculated using DETX and DETY for each event in the final _common_clean file
| Quadrant A | 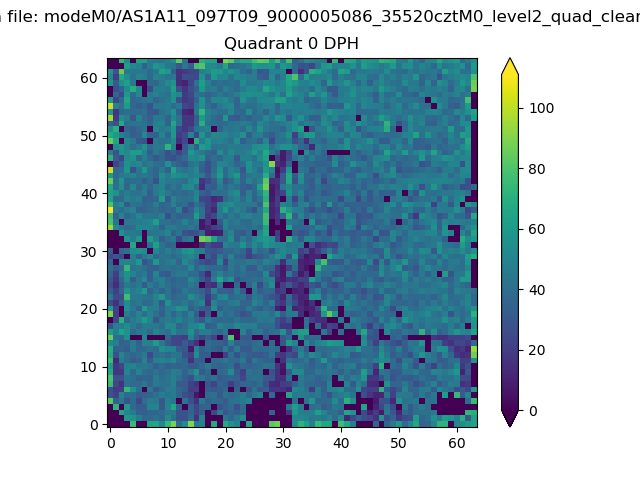 |
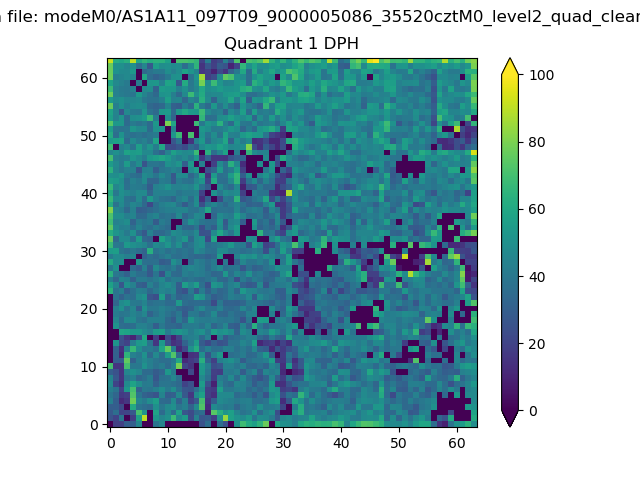 |
Quadrant B |
|---|---|---|---|
| Quadrant D | 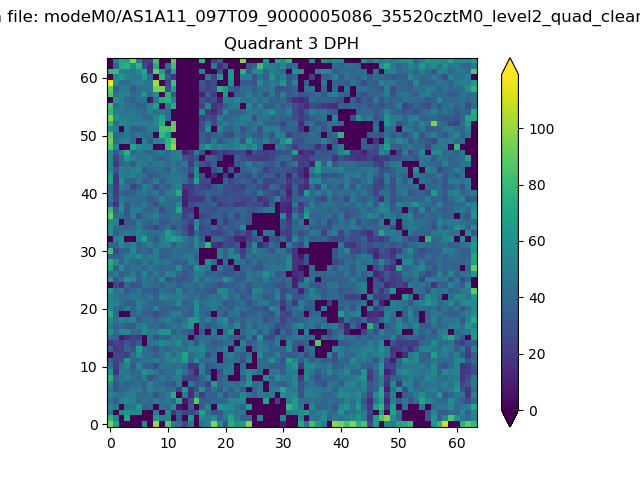 |
 |
Quadrant C |
| Plot type | Count rate plots | Images |
|---|---|---|
| Comparison with Poisson distribution Blue bars denote a histogram of data divided into 1 sec bins. Red curve is a Poisson curve with rate = median count rate of data. |
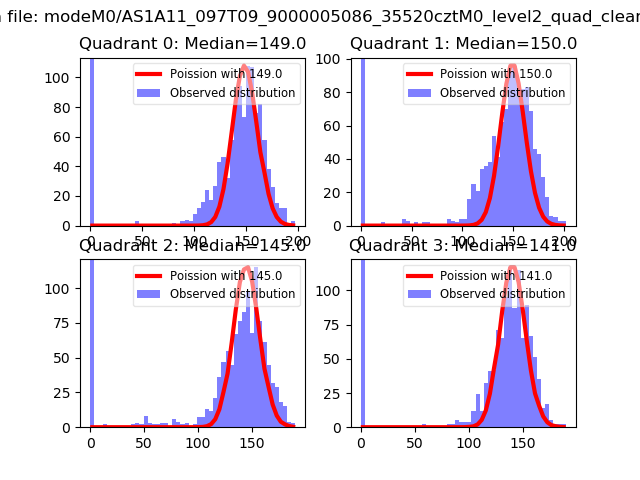 |
 |
| Quadrant-wise count rates Data is divided into 100 sec bins |
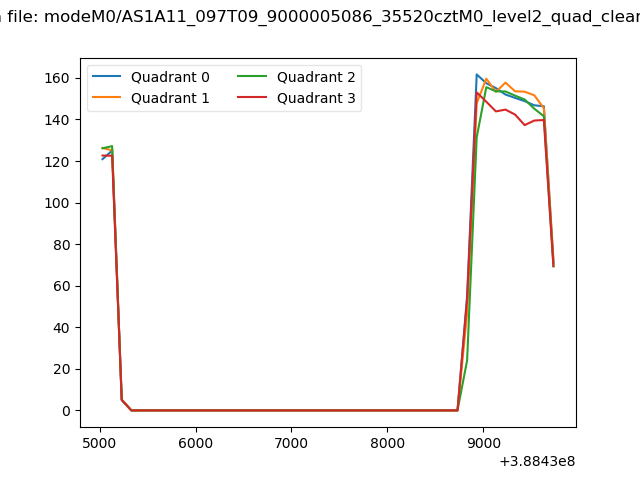 |
|
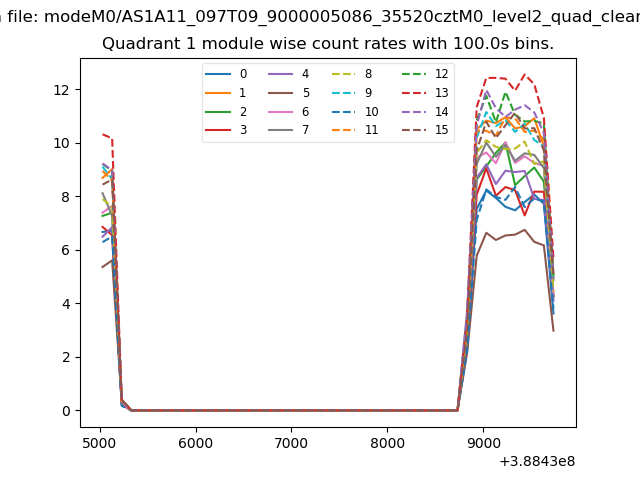
| Module-wise count rates for Quadrant A Data is divided into 100 sec bins |
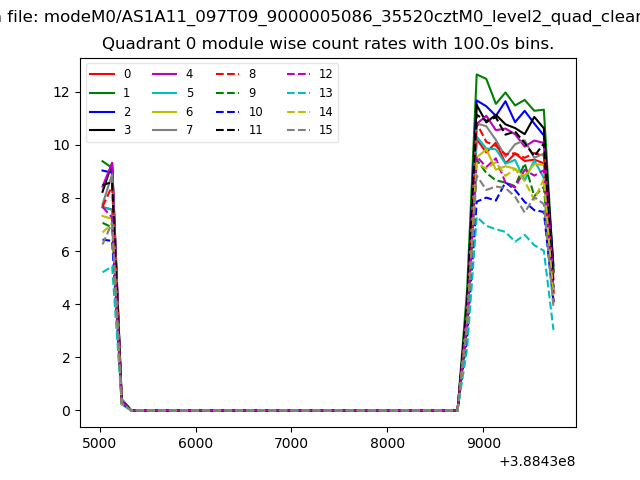 |
 |
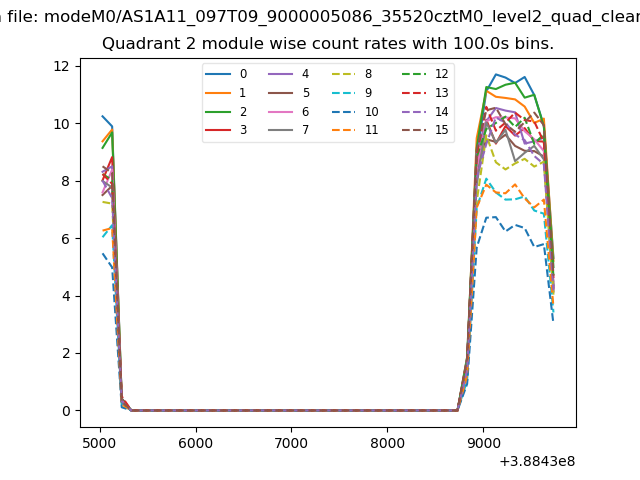
| Module-wise count rates for Quadrant B Data is divided into 100 sec bins |
 |
 |
| Module-wise count rates for Quadrant C Data is divided into 100 sec bins |
 |
 |
| Module-wise count rates for Quadrant D Data is divided into 100 sec bins |
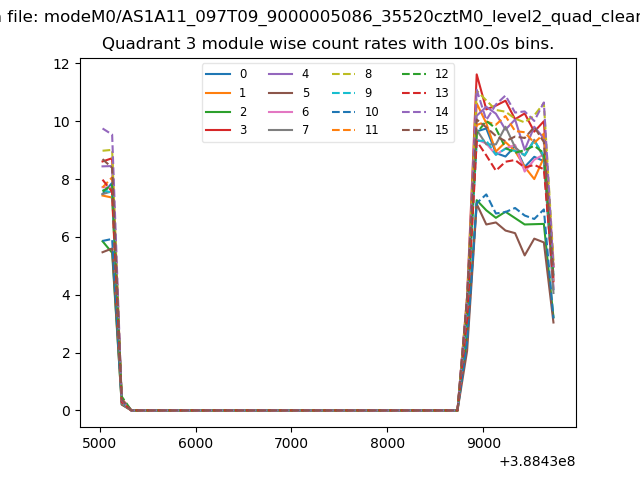 |
 |
| Parameter | Plot |
|---|---|
| CZT HV Monitor | 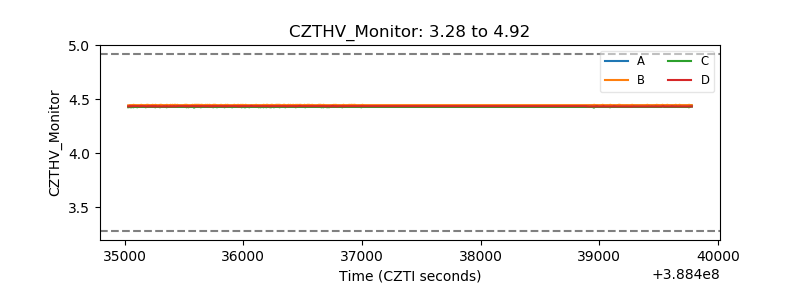 |
| D_VDD | 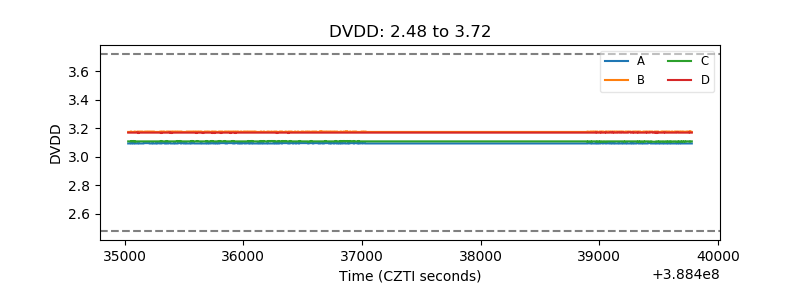 |
| Temperature 1 | 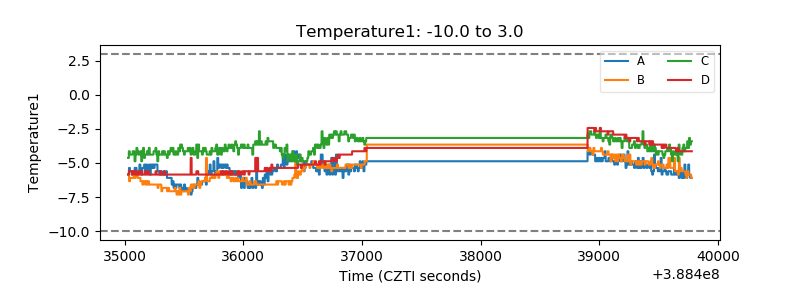 |
| Veto HV Monitor | 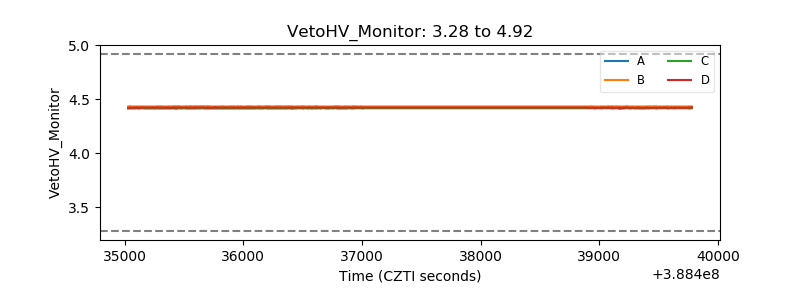 |
| Veto LLD | 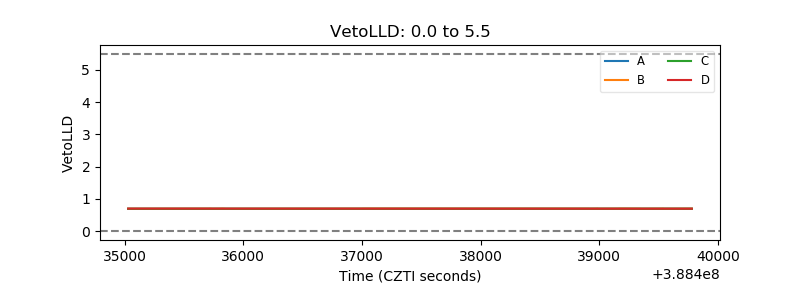 |
| Alpha Counter | 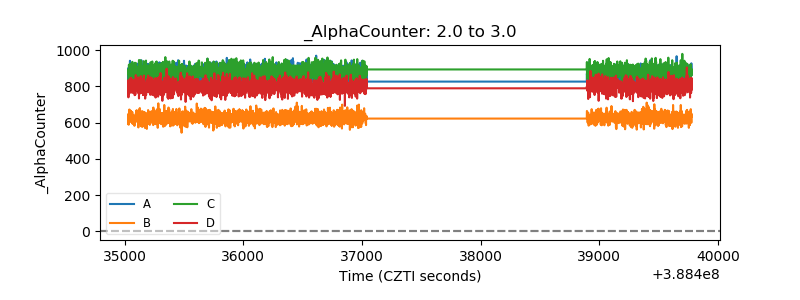 |
| _CPM_Rate | 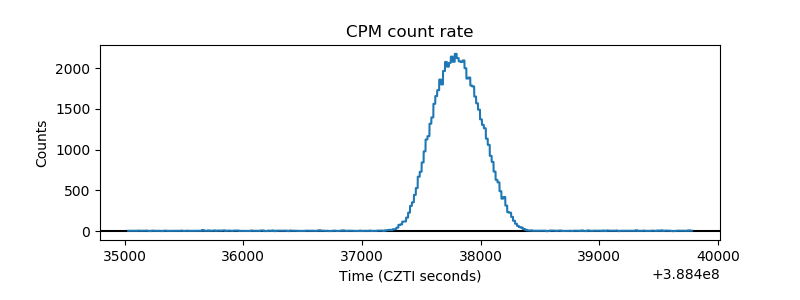 |
| CZT Counter | 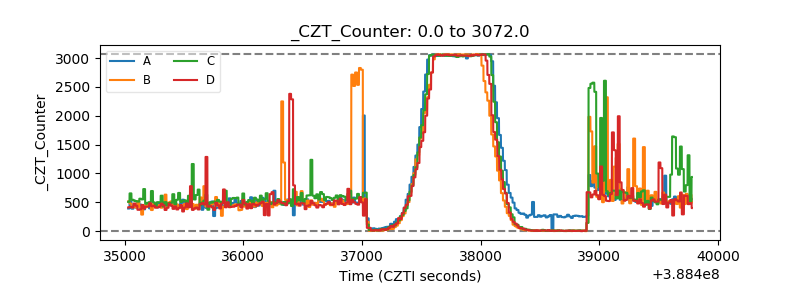 |
| +2.5 Volts monitor |  |
| +5 Volts monitor |  |
| _ROLL_ROT | 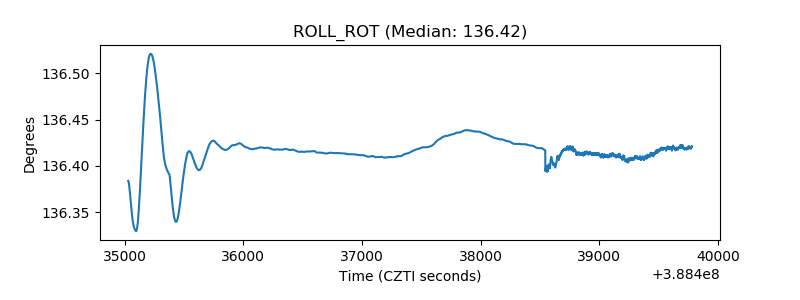 |
| _Roll_DEC | 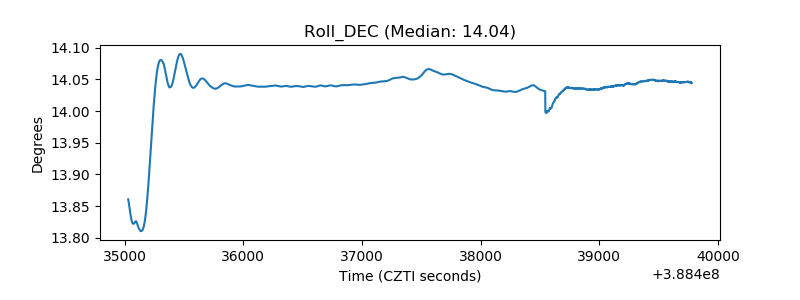 |
| _Roll_RA | 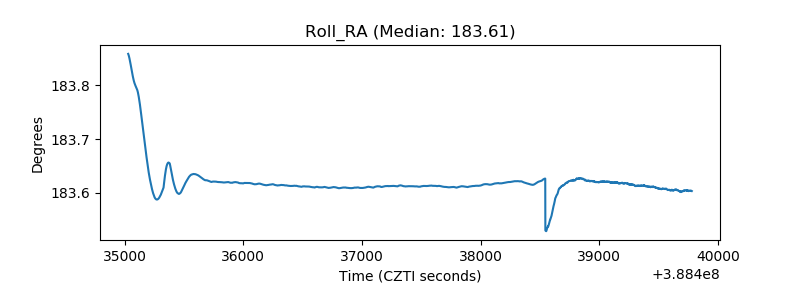 |
| Veto Counter | 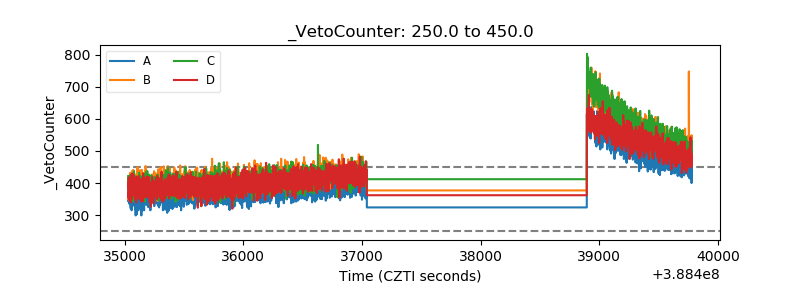 |