| Param | Original file | Final file |
|---|---|---|
| Filename | modeM0/AS1A11_097T09_9000005086_35527cztM0_level2.evt | modeM0/AS1A11_097T09_9000005086_35527cztM0_level2_quad_clean.evt |
| Size (bytes) | 433,520,640 | 65,632,320 |
| Size | 413.4 MB | 62.6 MB |
| Events in quadrant A | 2,961,834 | 397,611 |
| Events in quadrant B | 3,097,619 | 401,698 |
| Events in quadrant C | 3,472,860 | 393,894 |
| Events in quadrant D | 3,191,303 | 377,051 |
| Mode SS | |||
|---|---|---|---|
| Quadrant | BADHDUFLAG | Total packets | Discarded packets |
| A | 0 | 124 | 0 |
| B | 0 | 124 | 0 |
| C | 0 | 124 | 0 |
| D | 0 | 124 | 0 |
| Mode M0 | |||
|---|---|---|---|
| Quadrant | BADHDUFLAG | Total packets | Discarded packets |
| A | 0 | 12527 | 3 |
| B | 0 | 13023 | 2 |
| C | 0 | 13751 | 2 |
| D | 0 | 13534 | 2 |
| Mode M9 | |||
|---|---|---|---|
| Quadrant | BADHDUFLAG | Total packets | Discarded packets |
| A | 0 | 30 | 0 |
| B | 0 | 30 | 0 |
| C | 0 | 30 | 0 |
| D | 0 | 30 | 0 |
| Quadrant | Total seconds | Saturated seconds | Saturation percentage |
|---|---|---|---|
| A | 5966 | 8 | 0.134093% |
| B | 5966 | 63 | 1.055984% |
| C | 5966 | 113 | 1.894066% |
| D | 5966 | 59 | 0.988937% |
Noise dominated data is calculated using 1-second bins in cleaned event files. If a bin has >2000 counts, and if more than 50% of those come from <1% of pixels, then it is considered to be noise-dominated and hence unusable.
| Quadrant | # 1 sec bins | Bins with >0 counts | Bins with >2000 counts | High rate bins dominated by noise | Noise dominated (total time) | Noise dominated (detector-on time) | Marked lightcurve |
|---|---|---|---|---|---|---|---|
| A | 8983 | 5968 | 0 | 0 | 0.00% | 0.00% | 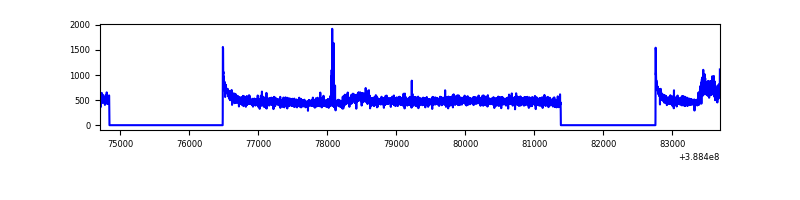 |
| B | 8983 | 5968 | 29 | 29 | 0.32% | 0.49% | 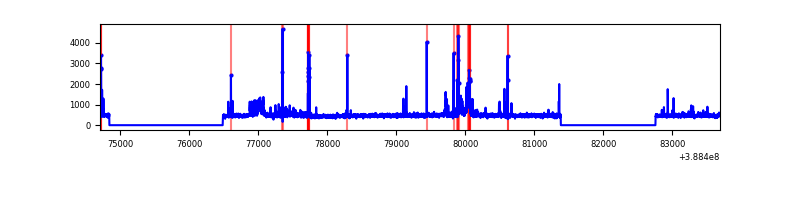 |
| C | 8983 | 5968 | 81 | 81 | 0.90% | 1.36% | 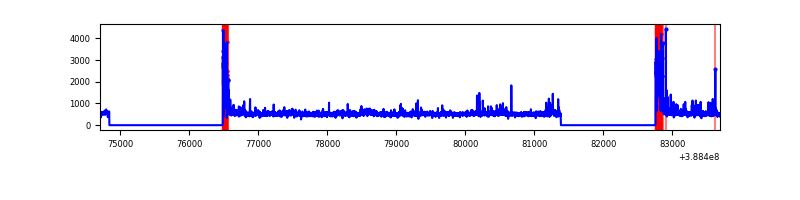 |
| D | 8983 | 5968 | 41 | 41 | 0.46% | 0.69% | 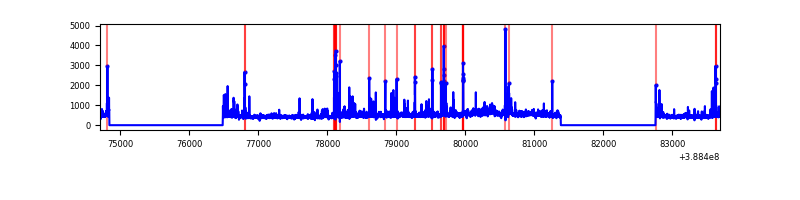 |
Top three noisy pixels from each quadrant. If the there are fewer than three noisy pixels in the level2.evt file, extra rows are filled as -1
| Pixel properties | Quadrant properties | ||||||
|---|---|---|---|---|---|---|---|
| Quadrant | DetID | PixID | Counts | Sigma | Mean | Median | Sigma |
| A | 10 | 83 | 139066 | 989.24 | 689 | 676 | 139.9 |
| A | 15 | 169 | 121722 | 865.26 | 689 | 676 | 139.9 |
| A | 9 | 143 | 13918 | 94.66 | 689 | 676 | 139.9 |
| B | 0 | 190 | 130649 | 971.02 | 684 | 664 | 133.9 |
| B | 5 | 172 | 114498 | 850.37 | 684 | 664 | 133.9 |
| B | 5 | 236 | 111823 | 830.39 | 684 | 664 | 133.9 |
| C | 0 | 10 | 371691 | 2351.39 | 668 | 672 | 157.8 |
| C | 15 | 214 | 246669 | 1559.04 | 668 | 672 | 157.8 |
| C | 0 | 207 | 138351 | 872.56 | 668 | 672 | 157.8 |
| D | 8 | 195 | 199461 | 1218.04 | 667 | 649 | 163.2 |
| D | 2 | 250 | 194203 | 1185.82 | 667 | 649 | 163.2 |
| D | 10 | 199 | 61708 | 374.08 | 667 | 649 | 163.2 |
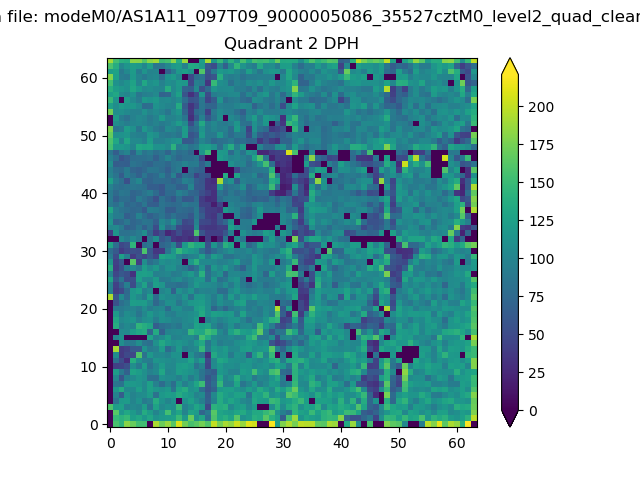
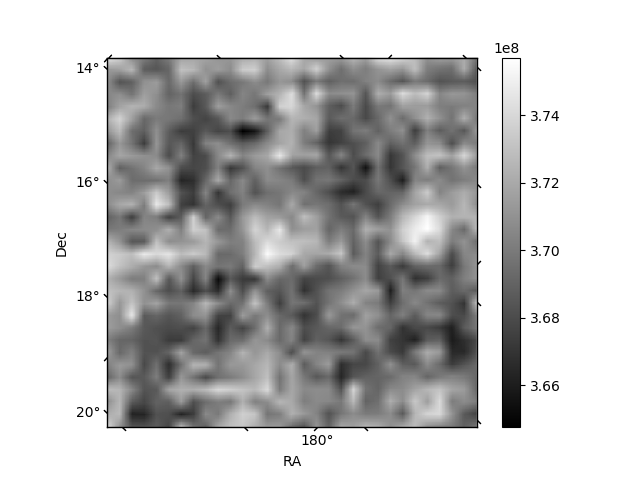
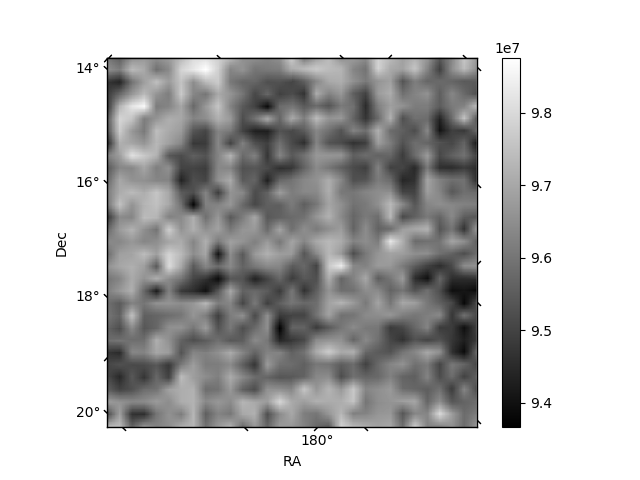
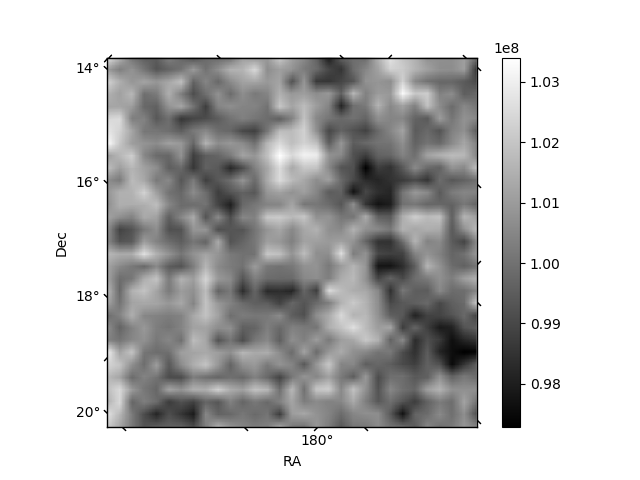
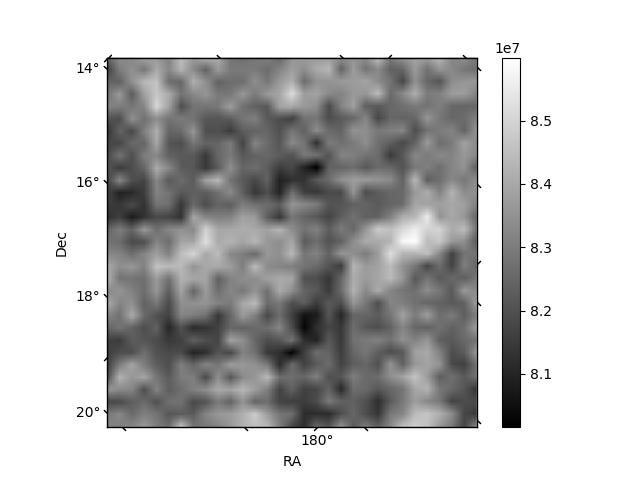
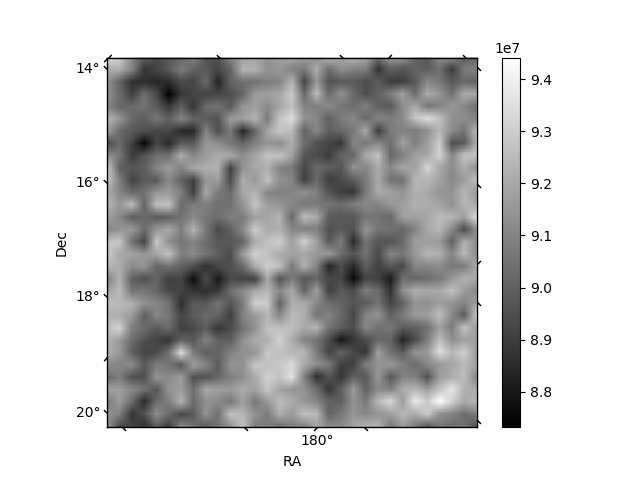
Histogram calculated using DETX and DETY for each event in the final _common_clean file
| Quadrant A | 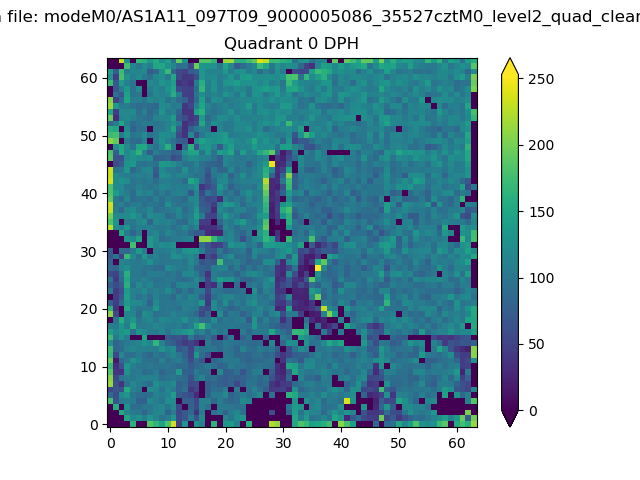 |
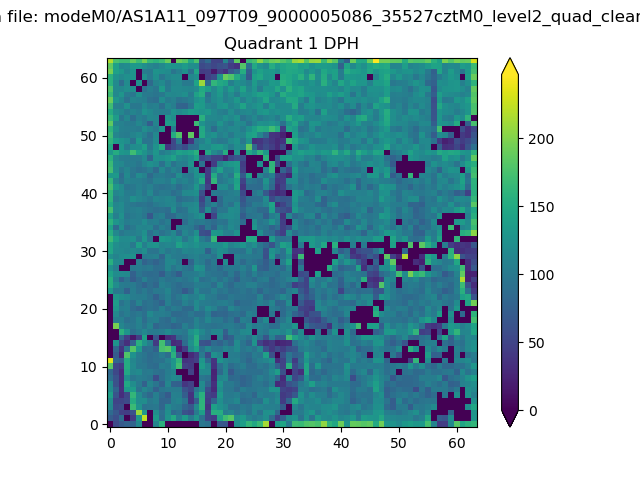 |
Quadrant B |
|---|---|---|---|
| Quadrant D | 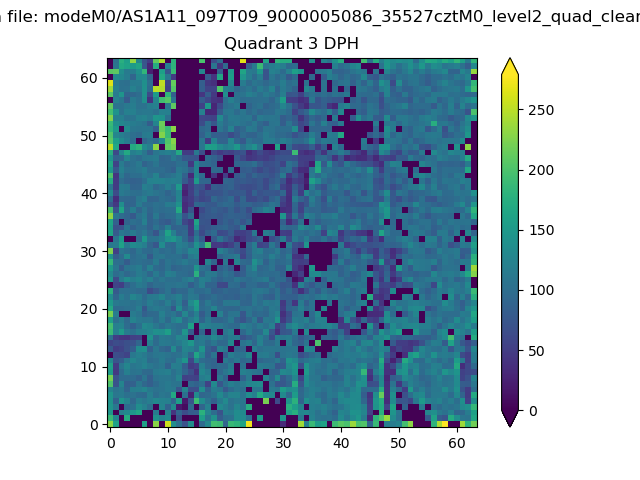 |
 |
Quadrant C |
| Plot type | Count rate plots | Images |
|---|---|---|
| Comparison with Poisson distribution Blue bars denote a histogram of data divided into 1 sec bins. Red curve is a Poisson curve with rate = median count rate of data. |
 |
 |
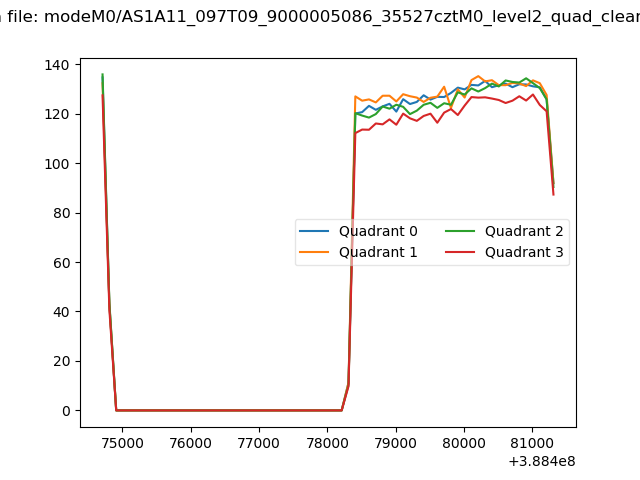
| Quadrant-wise count rates Data is divided into 100 sec bins |
 |
|
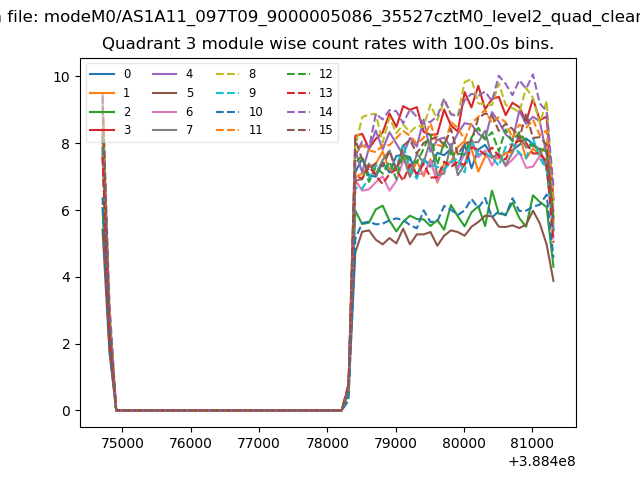
| Module-wise count rates for Quadrant A Data is divided into 100 sec bins |
 |
 |
| Module-wise count rates for Quadrant B Data is divided into 100 sec bins |
 |
 |
| Module-wise count rates for Quadrant C Data is divided into 100 sec bins |
 |
 |
| Module-wise count rates for Quadrant D Data is divided into 100 sec bins |
 |
 |
| Parameter | Plot |
|---|---|
| CZT HV Monitor |  |
| D_VDD | 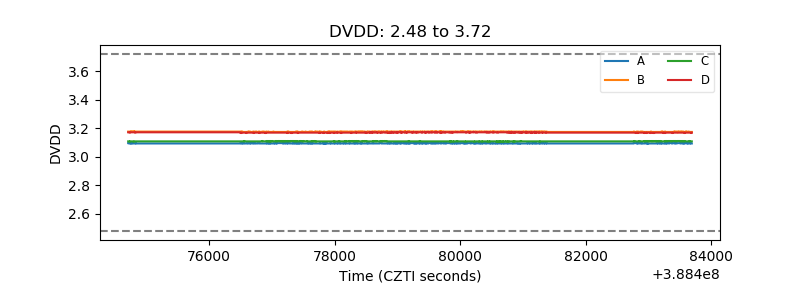 |
| Temperature 1 | 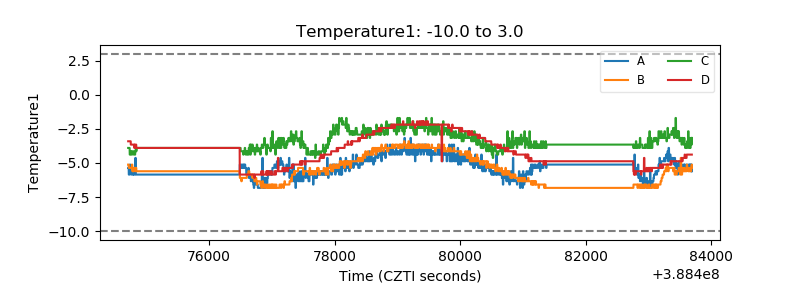 |
| Veto HV Monitor | 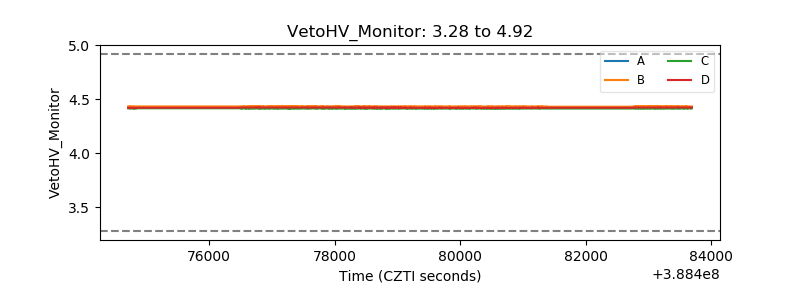 |
| Veto LLD | 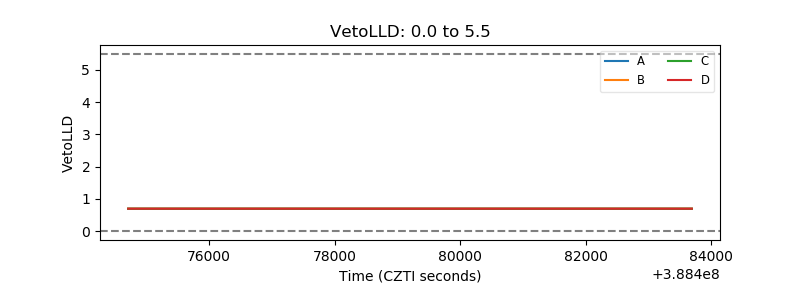 |
| Alpha Counter | 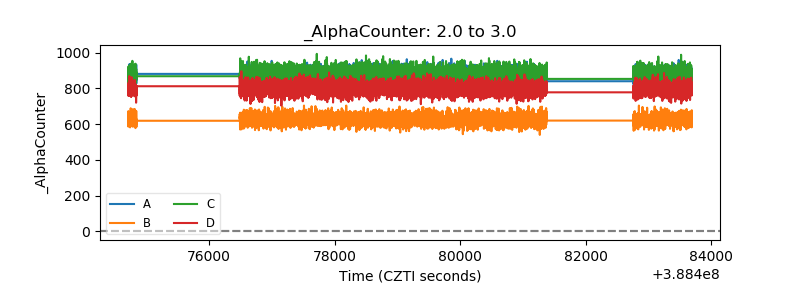 |
| _CPM_Rate | 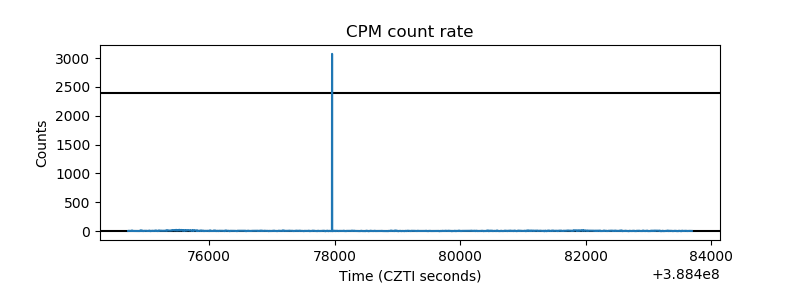 |
| CZT Counter | 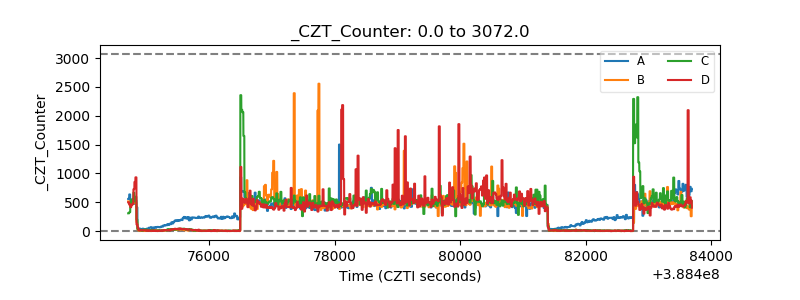 |
| +2.5 Volts monitor | 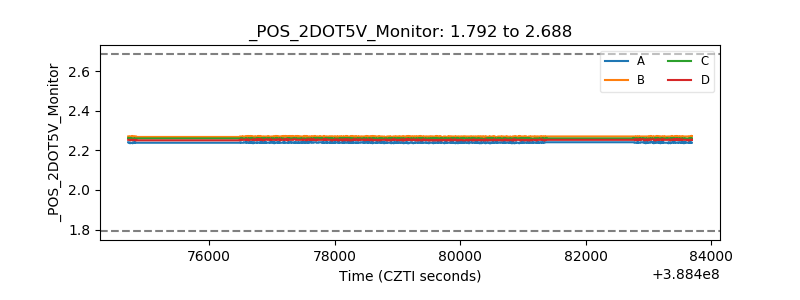 |
| +5 Volts monitor |  |
| _ROLL_ROT | 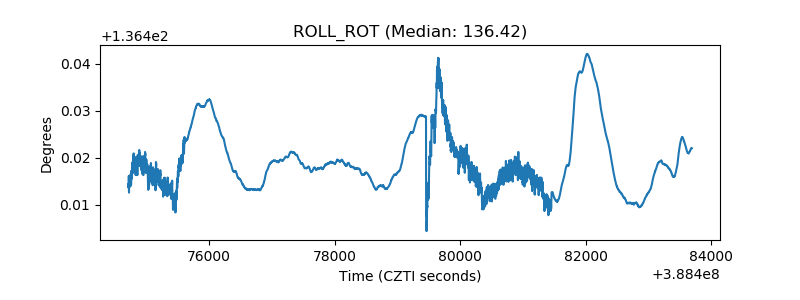 |
| _Roll_DEC | 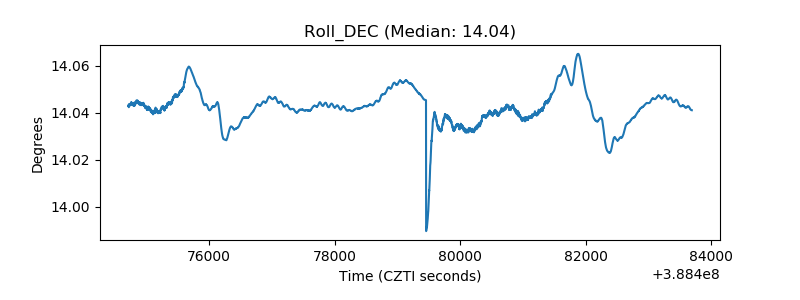 |
| _Roll_RA | 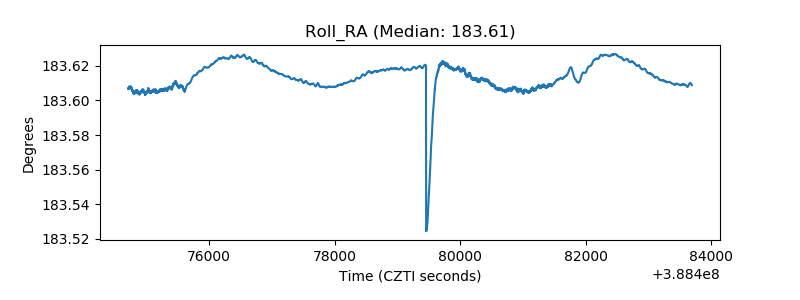 |
| Veto Counter |  |