| Param | Original file | Final file |
|---|---|---|
| Filename | modeM0/AS1A11_046T08_9000005088cztM0_level2.fits | modeM0/AS1A11_046T08_9000005088cztM0_level2_quad_clean.evt |
| Size (bytes) | 299,070,720 | 352,264,320 |
| Size | 285.2 MB | 335.9 MB |
| Events in quadrant A | 1,800,158 | 2,113,110 |
| Events in quadrant B | 1,721,588 | 2,190,931 |
| Events in quadrant C | 1,800,406 | 2,210,423 |
| Events in quadrant D | 1,465,298 | 1,886,723 |
| Mode M0 | |||
|---|---|---|---|
| Quadrant | BADHDUFLAG | Total packets | Discarded packets |
| A | 0 | 83734 | 0 |
| B | 0 | 81559 | 0 |
| C | 0 | 72285 | 0 |
| D | 0 | 111159 | 0 |
| Mode SS | |||
|---|---|---|---|
| Quadrant | BADHDUFLAG | Total packets | Discarded packets |
| A | 0 | 670 | 0 |
| B | 0 | 670 | 0 |
| C | 0 | 670 | 0 |
| D | 0 | 670 | 0 |
| Mode M9 | |||
|---|---|---|---|
| Quadrant | BADHDUFLAG | Total packets | Discarded packets |
| A | 0 | 116 | 0 |
| B | 0 | 116 | 0 |
| C | 0 | 116 | 0 |
| D | 0 | 116 | 0 |
| Quadrant | Total seconds | Saturated seconds | Saturation percentage |
|---|---|---|---|
| A | 33005 | 1599 | 4.844720% |
| B | 33005 | 1399 | 4.238752% |
| C | 33005 | 298 | 0.902894% |
| D | 33005 | 3700 | 11.210423% |
Noise dominated data is calculated using 1-second bins in cleaned event files. If a bin has >2000 counts, and if more than 50% of those come from <1% of pixels, then it is considered to be noise-dominated and hence unusable.
| Quadrant | # 1 sec bins | Bins with >0 counts | Bins with >2000 counts | High rate bins dominated by noise | Noise dominated (total time) | Noise dominated (detector-on time) | Marked lightcurve |
|---|---|---|---|---|---|---|---|
| A | 44538 | 32999 | 0 | 0 | 0.00% | 0.00% | 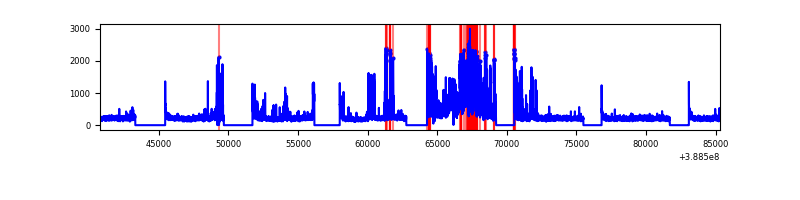 |
| B | 44538 | 32965 | 0 | 0 | 0.00% | 0.00% |  |
| C | 44538 | 33000 | 0 | 0 | 0.00% | 0.00% |  |
| D | 44538 | 32984 | 0 | 0 | 0.00% | 0.00% |  |
Top three noisy pixels from each quadrant. If the there are fewer than three noisy pixels in the level2.evt file, extra rows are filled as -1
| Pixel properties | Quadrant properties | ||||||
|---|---|---|---|---|---|---|---|
| Quadrant | DetID | PixID | Counts | Sigma | Mean | Median | Sigma |
| A | 0 | 29 | 1498 | 8.86 | 470 | 442 | 119.1 |
| A | 7 | 110 | 1485 | 8.75 | 470 | 442 | 119.1 |
| A | 9 | 19 | 1431 | 8.3 | 470 | 442 | 119.1 |
| B | 2 | 9 | 1490 | 11.63 | 456 | 436 | 90.7 |
| B | 3 | 80 | 1350 | 10.08 | 456 | 436 | 90.7 |
| B | 5 | 128 | 1223 | 8.68 | 456 | 436 | 90.7 |
| C | 3 | 187 | 1295 | 6.82 | 477 | 448 | 124.2 |
| C | 1 | 65 | 1237 | 6.35 | 477 | 448 | 124.2 |
| C | 9 | 233 | 1198 | 6.04 | 477 | 448 | 124.2 |
| D | 7 | 3 | 1118 | 6.48 | 418 | 380 | 114.0 |
| D | 6 | 62 | 1094 | 6.26 | 418 | 380 | 114.0 |
| D | 10 | 113 | 1088 | 6.21 | 418 | 380 | 114.0 |
Histogram calculated using DETX and DETY for each event in the final _common_clean file
| Quadrant A | 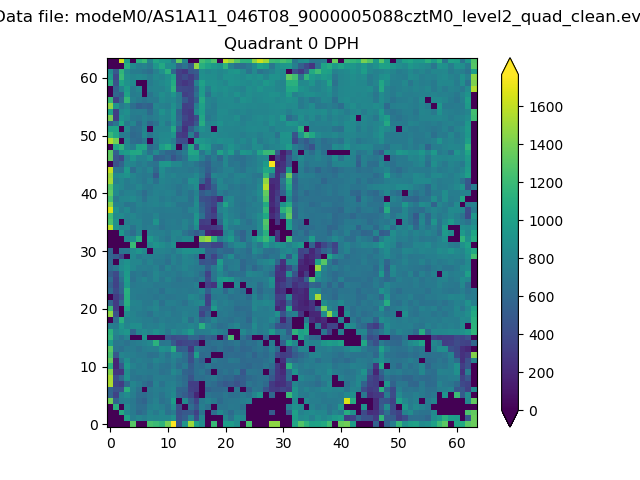 |
 |
Quadrant B |
|---|---|---|---|
| Quadrant D | 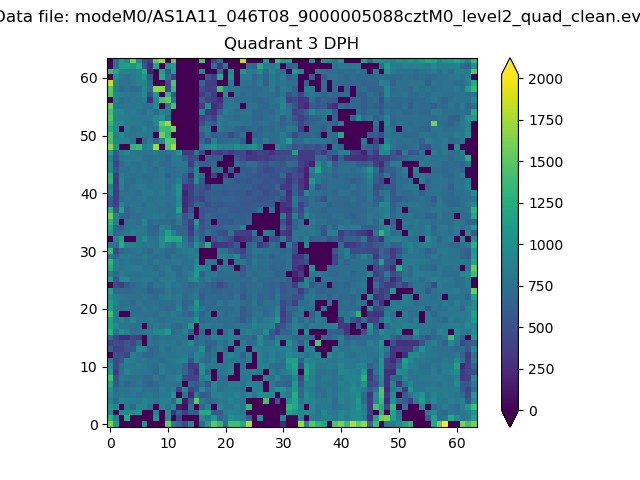 |
 |
Quadrant C |
| Plot type | Count rate plots | Images |
|---|---|---|
| Comparison with Poisson distribution Blue bars denote a histogram of data divided into 1 sec bins. Red curve is a Poisson curve with rate = median count rate of data. |
 |
 |
| Quadrant-wise count rates Data is divided into 100 sec bins |
 |
|
| Module-wise count rates for Quadrant A Data is divided into 100 sec bins |
 |
 |
| Module-wise count rates for Quadrant B Data is divided into 100 sec bins |
 |
 |
| Module-wise count rates for Quadrant C Data is divided into 100 sec bins |
 |
 |
| Module-wise count rates for Quadrant D Data is divided into 100 sec bins |
 |
 |
| Parameter | Plot |
|---|---|
| CZT HV Monitor |  |
| D_VDD |  |
| Temperature 1 |  |
| Veto HV Monitor |  |
| Veto LLD |  |
| Alpha Counter |  |
| _CPM_Rate |  |
| CZT Counter |  |
| +2.5 Volts monitor |  |
| +5 Volts monitor |  |
| _ROLL_ROT |  |
| _Roll_DEC |  |
| _Roll_RA |  |
| Veto Counter |  |