| Param | Original file | Final file |
|---|---|---|
| Filename | modeM0/AS1A11_046T08_9000005088_35539cztM0_level2.evt | modeM0/AS1A11_046T08_9000005088_35539cztM0_level2_quad_clean.evt |
| Size (bytes) | 501,670,080 | 78,629,760 |
| Size | 478.4 MB | 75.0 MB |
| Events in quadrant A | 2,694,592 | 506,962 |
| Events in quadrant B | 3,293,510 | 506,015 |
| Events in quadrant C | 2,911,142 | 525,757 |
| Events in quadrant D | 5,940,767 | 477,185 |
| Mode M0 | |||
|---|---|---|---|
| Quadrant | BADHDUFLAG | Total packets | Discarded packets |
| A | 0 | 11505 | 3 |
| B | 0 | 13377 | 2 |
| C | 0 | 11773 | 2 |
| D | 0 | 21269 | 2 |
| Mode SS | |||
|---|---|---|---|
| Quadrant | BADHDUFLAG | Total packets | Discarded packets |
| A | 0 | 106 | 0 |
| B | 0 | 106 | 0 |
| C | 0 | 106 | 0 |
| D | 0 | 106 | 0 |
| Mode M9 | |||
|---|---|---|---|
| Quadrant | BADHDUFLAG | Total packets | Discarded packets |
| A | 0 | 31 | 0 |
| B | 0 | 31 | 0 |
| C | 0 | 31 | 0 |
| D | 0 | 32 | 0 |
| Quadrant | Total seconds | Saturated seconds | Saturation percentage |
|---|---|---|---|
| A | 5209 | 86 | 1.650989% |
| B | 5209 | 307 | 5.893646% |
| C | 5209 | 122 | 2.342100% |
| D | 5209 | 828 | 15.895565% |
Noise dominated data is calculated using 1-second bins in cleaned event files. If a bin has >2000 counts, and if more than 50% of those come from <1% of pixels, then it is considered to be noise-dominated and hence unusable.
| Quadrant | # 1 sec bins | Bins with >0 counts | Bins with >2000 counts | High rate bins dominated by noise | Noise dominated (total time) | Noise dominated (detector-on time) | Marked lightcurve |
|---|---|---|---|---|---|---|---|
| A | 7271 | 5210 | 49 | 49 | 0.67% | 0.94% | 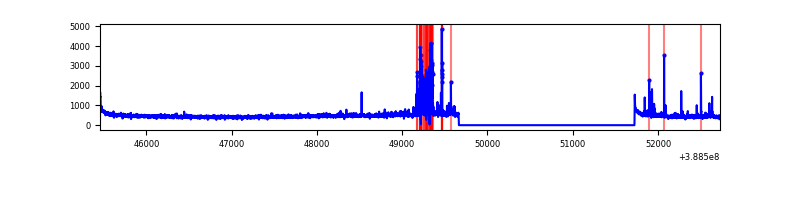 |
| B | 7271 | 5210 | 205 | 205 | 2.82% | 3.93% | 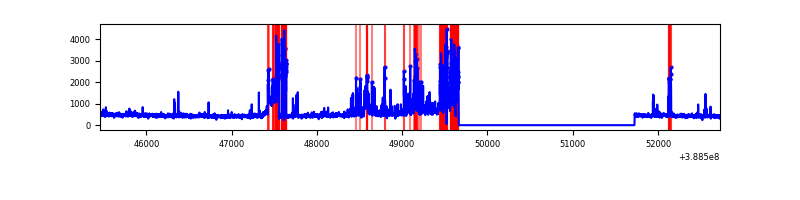 |
| C | 7271 | 5210 | 93 | 93 | 1.28% | 1.79% | 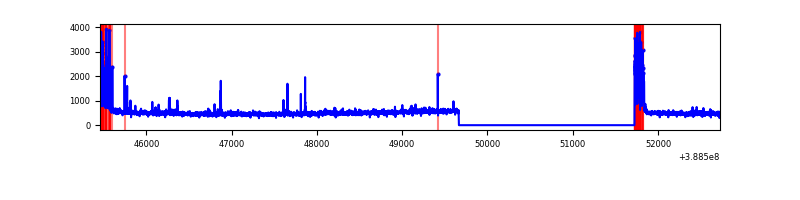 |
| D | 7271 | 5210 | 773 | 773 | 10.63% | 14.84% | 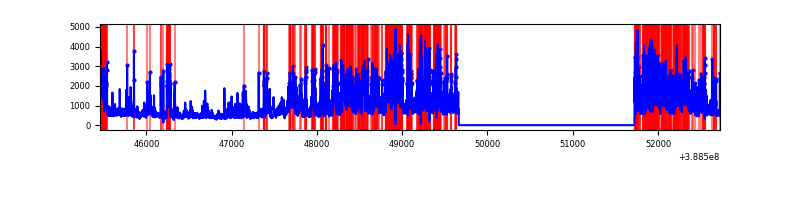 |
Top three noisy pixels from each quadrant. If the there are fewer than three noisy pixels in the level2.evt file, extra rows are filled as -1
| Pixel properties | Quadrant properties | ||||||
|---|---|---|---|---|---|---|---|
| Quadrant | DetID | PixID | Counts | Sigma | Mean | Median | Sigma |
| A | 15 | 237 | 206958 | 1766.74 | 581 | 571 | 116.8 |
| A | 10 | 83 | 139136 | 1186.16 | 581 | 571 | 116.8 |
| A | 15 | 169 | 53370 | 451.98 | 581 | 571 | 116.8 |
| B | 5 | 236 | 529995 | 4854.78 | 574 | 559 | 109.1 |
| B | 5 | 200 | 311939 | 2855.27 | 574 | 559 | 109.1 |
| B | 5 | 172 | 76643 | 697.67 | 574 | 559 | 109.1 |
| C | 0 | 10 | 350594 | 2716.52 | 571 | 576 | 128.8 |
| C | 15 | 214 | 232233 | 1797.91 | 571 | 576 | 128.8 |
| C | 0 | 239 | 40954 | 313.38 | 571 | 576 | 128.8 |
| D | 12 | 235 | 3348109 | 25896.9 | 535 | 521 | 129.3 |
| D | 13 | 249 | 138250 | 1065.47 | 535 | 521 | 129.3 |
| D | 8 | 195 | 105051 | 808.64 | 535 | 521 | 129.3 |
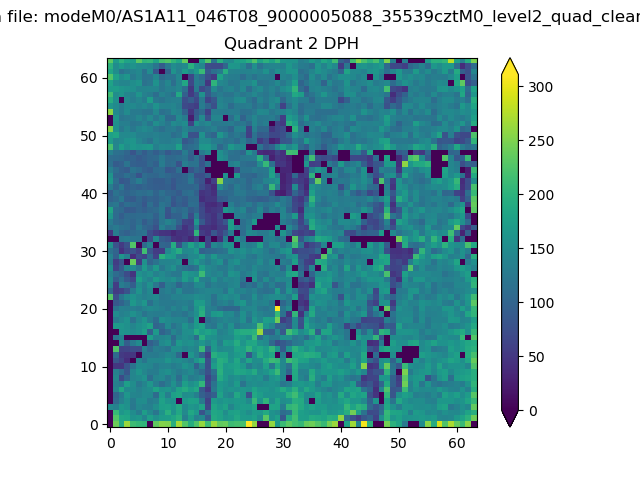
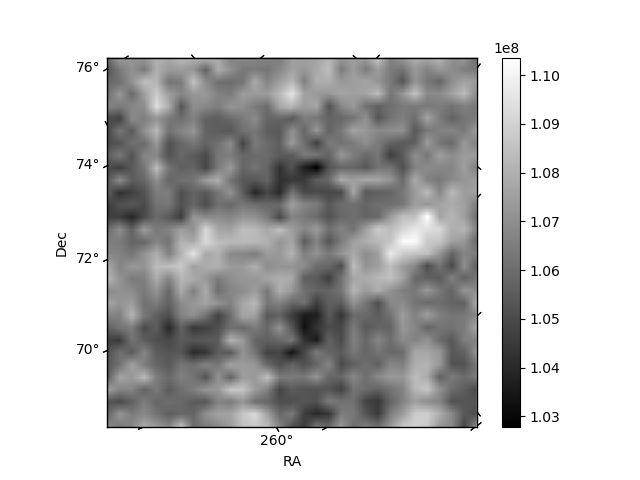
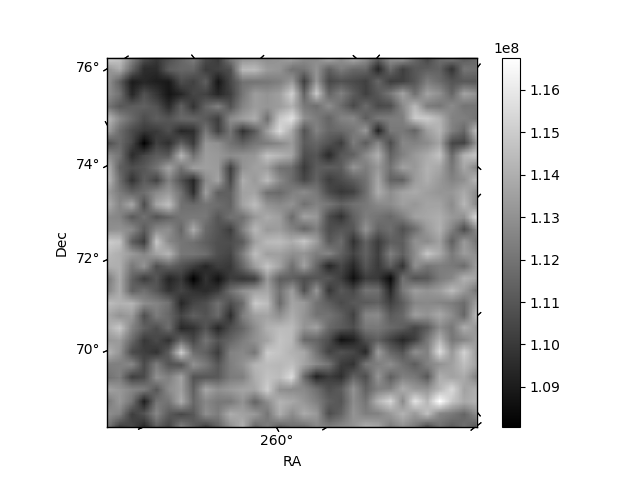
Histogram calculated using DETX and DETY for each event in the final _common_clean file
| Quadrant A | 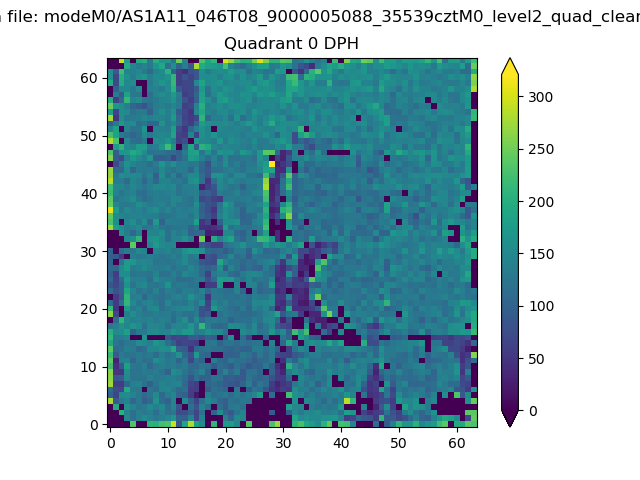 |
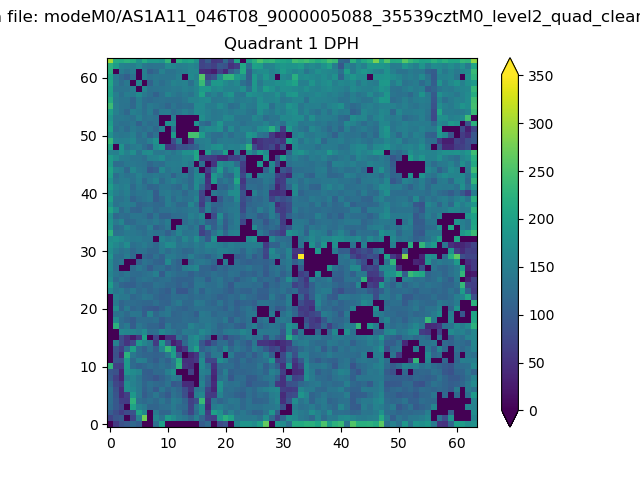 |
Quadrant B |
|---|---|---|---|
| Quadrant D | 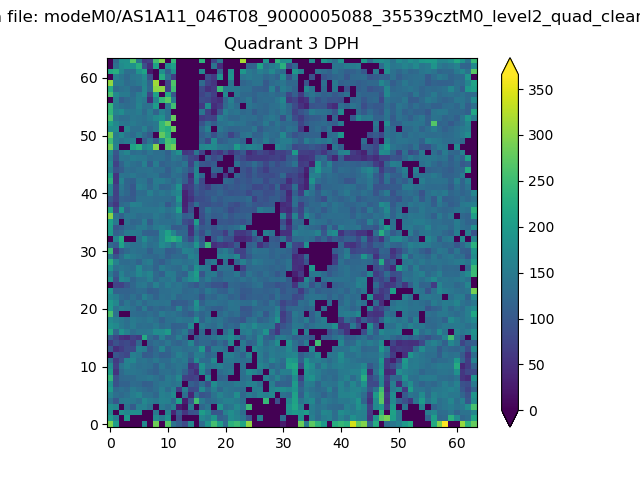 |
 |
Quadrant C |
| Plot type | Count rate plots | Images |
|---|---|---|
| Comparison with Poisson distribution Blue bars denote a histogram of data divided into 1 sec bins. Red curve is a Poisson curve with rate = median count rate of data. |
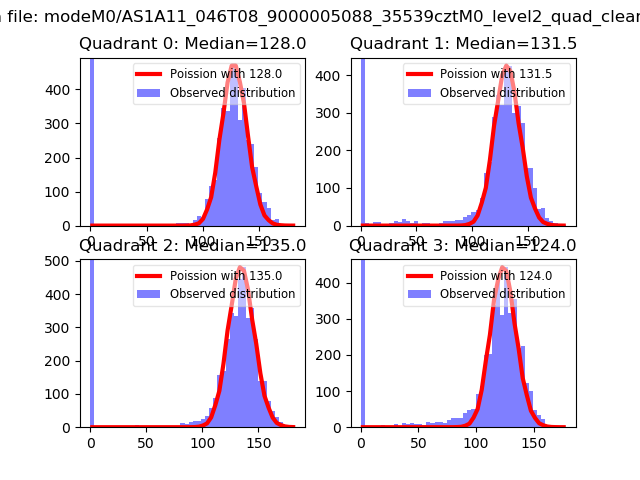 |
 |
| Quadrant-wise count rates Data is divided into 100 sec bins |
 |
|
| Module-wise count rates for Quadrant A Data is divided into 100 sec bins |
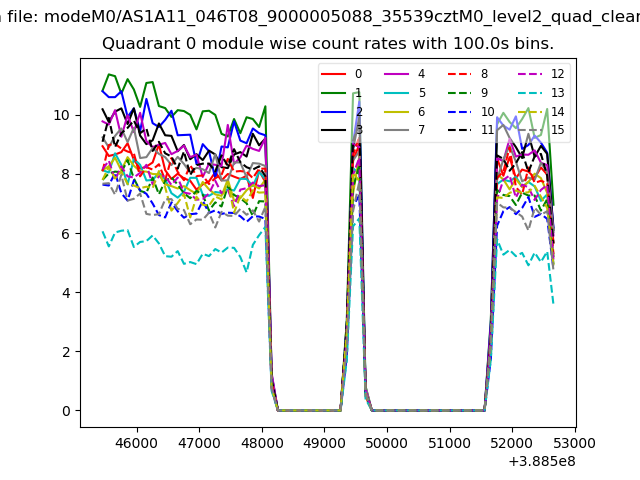 |
 |
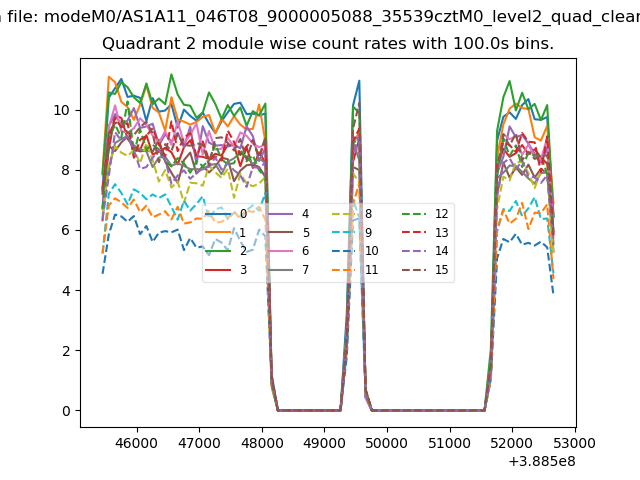
| Module-wise count rates for Quadrant B Data is divided into 100 sec bins |
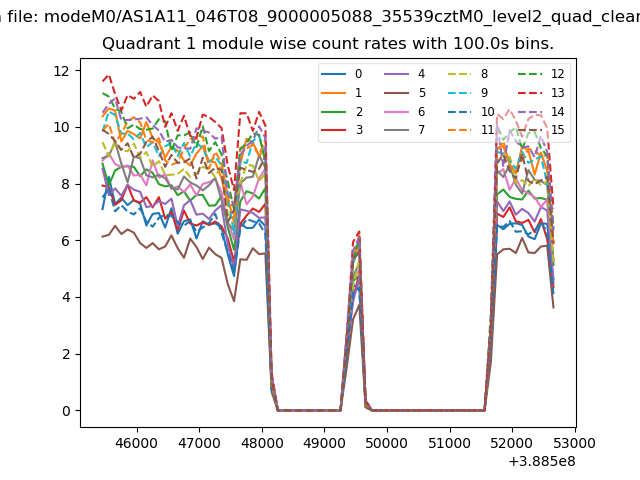 |
 |
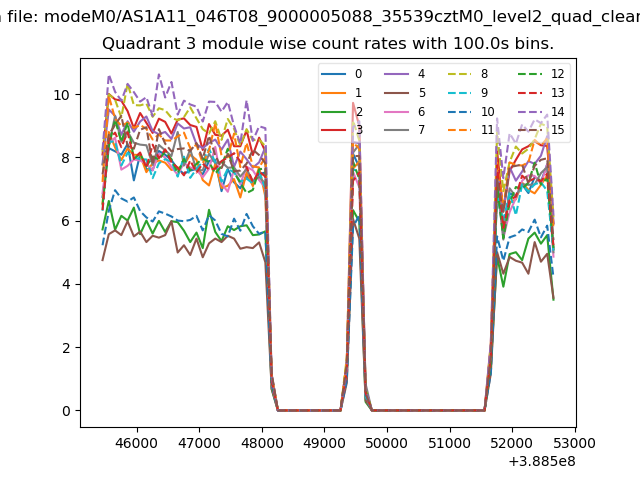
| Module-wise count rates for Quadrant C Data is divided into 100 sec bins |
 |
 |
| Module-wise count rates for Quadrant D Data is divided into 100 sec bins |
 |
 |
| Parameter | Plot |
|---|---|
| CZT HV Monitor | 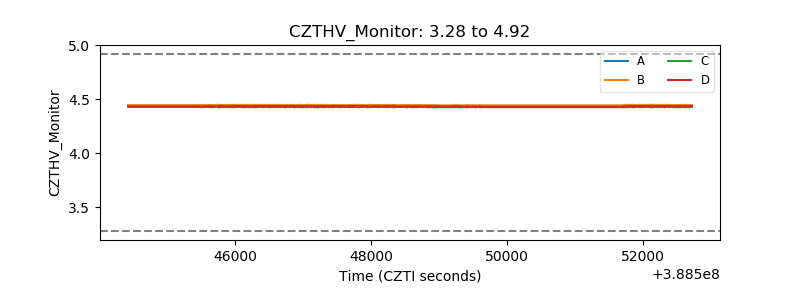 |
| D_VDD | 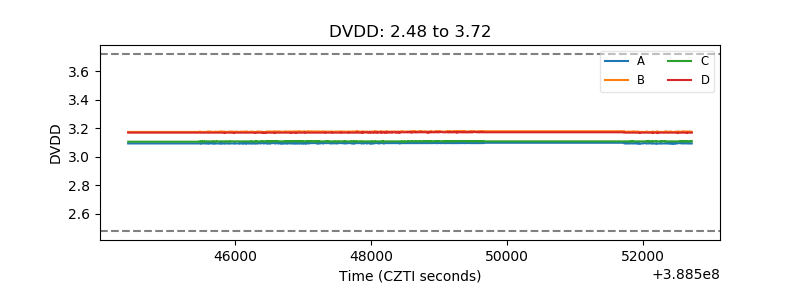 |
| Temperature 1 | 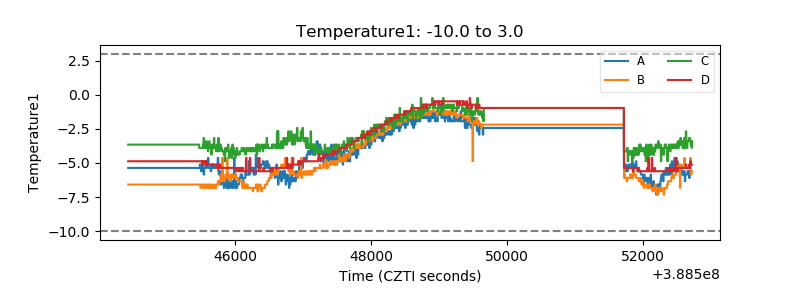 |
| Veto HV Monitor | 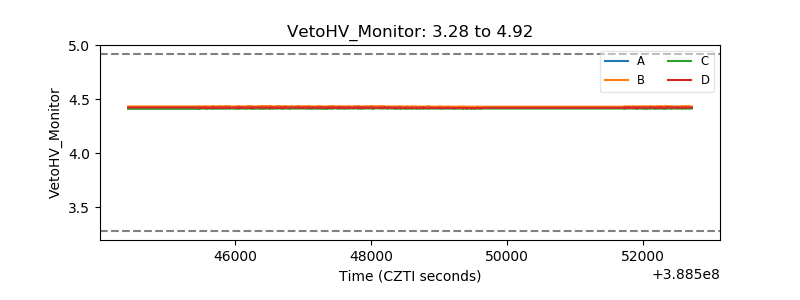 |
| Veto LLD | 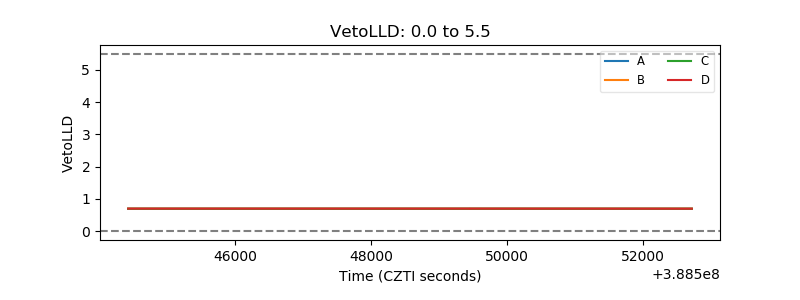 |
| Alpha Counter |  |
| _CPM_Rate | 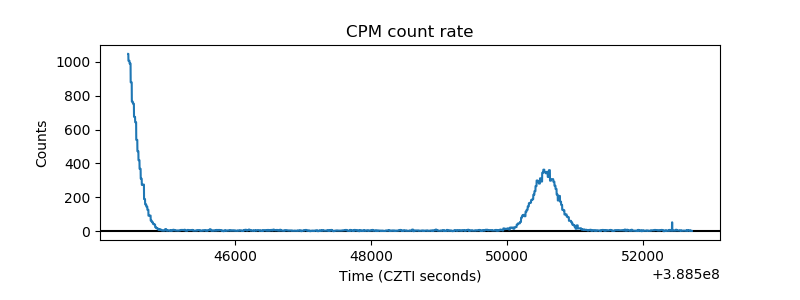 |
| CZT Counter | 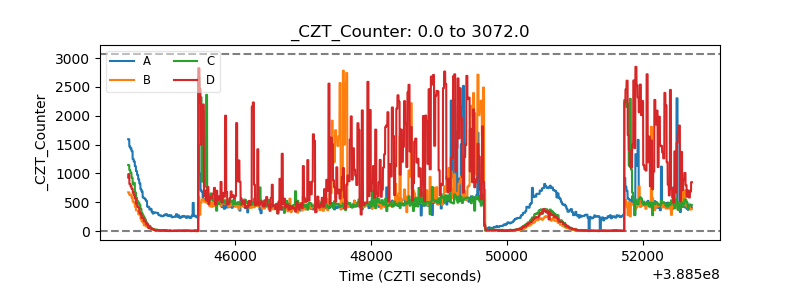 |
| +2.5 Volts monitor |  |
| +5 Volts monitor |  |
| _ROLL_ROT | 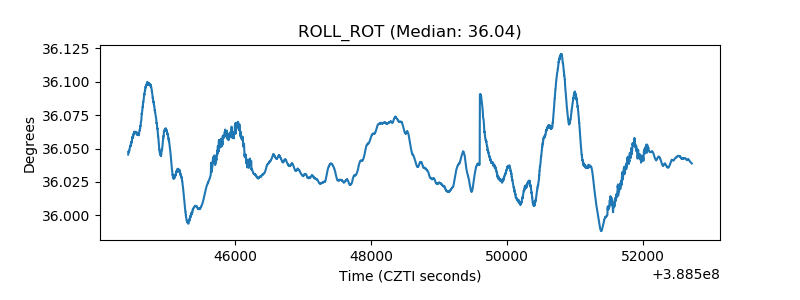 |
| _Roll_DEC | 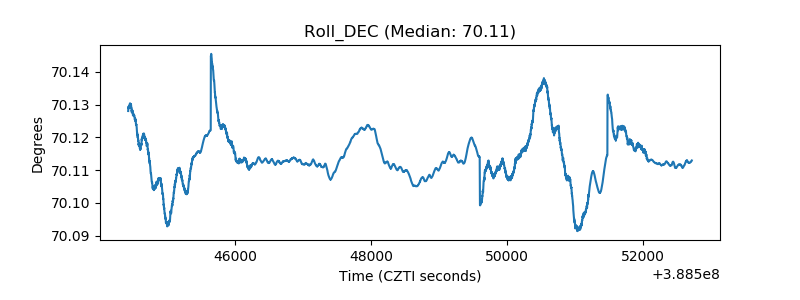 |
| _Roll_RA | 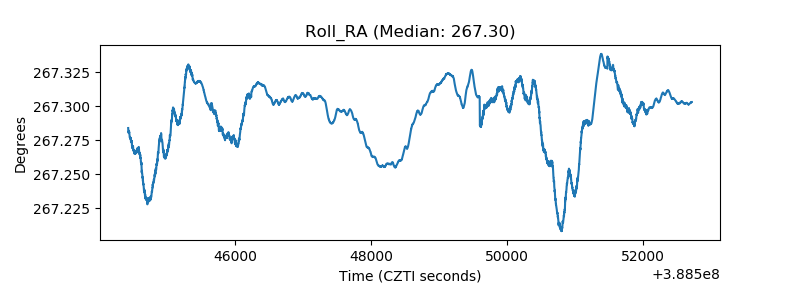 |
| Veto Counter | 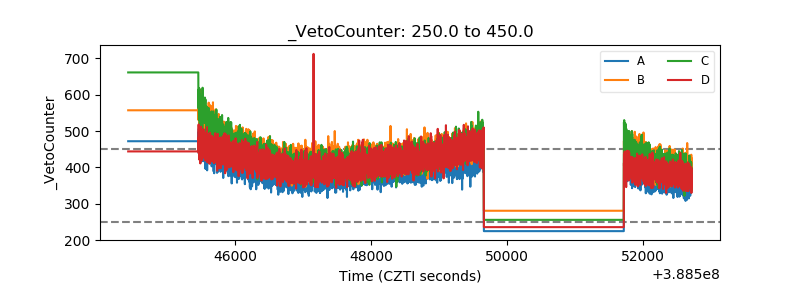 |