| Param | Original file | Final file |
|---|---|---|
| Filename | modeM0/AS1T05_026T01_9000005092cztM0_level2.fits | modeM0/AS1T05_026T01_9000005092cztM0_level2_quad_clean.evt |
| Size (bytes) | 587,851,200 | 616,170,240 |
| Size | 560.6 MB | 587.6 MB |
| Events in quadrant A | 3,434,778 | 3,610,032 |
| Events in quadrant B | 3,424,768 | 3,676,230 |
| Events in quadrant C | 3,563,734 | 3,700,609 |
| Events in quadrant D | 3,062,496 | 3,359,602 |
| Mode SS | |||
|---|---|---|---|
| Quadrant | BADHDUFLAG | Total packets | Discarded packets |
| A | 0 | 1290 | 0 |
| B | 0 | 1290 | 0 |
| C | 0 | 1290 | 0 |
| D | 0 | 1290 | 0 |
| Mode M9 | |||
|---|---|---|---|
| Quadrant | BADHDUFLAG | Total packets | Discarded packets |
| A | 0 | 236 | 0 |
| B | 0 | 236 | 0 |
| C | 0 | 236 | 0 |
| D | 0 | 236 | 0 |
| Mode M0 | |||
|---|---|---|---|
| Quadrant | BADHDUFLAG | Total packets | Discarded packets |
| A | 0 | 178971 | 0 |
| B | 0 | 151310 | 0 |
| C | 0 | 149145 | 0 |
| D | 0 | 156616 | 0 |
| Quadrant | Total seconds | Saturated seconds | Saturation percentage |
|---|---|---|---|
| A | 62892 | 3410 | 5.421993% |
| B | 62892 | 2468 | 3.924187% |
| C | 62892 | 1068 | 1.698149% |
| D | 62892 | 1588 | 2.524963% |
Noise dominated data is calculated using 1-second bins in cleaned event files. If a bin has >2000 counts, and if more than 50% of those come from <1% of pixels, then it is considered to be noise-dominated and hence unusable.
| Quadrant | # 1 sec bins | Bins with >0 counts | Bins with >2000 counts | High rate bins dominated by noise | Noise dominated (total time) | Noise dominated (detector-on time) | Marked lightcurve |
|---|---|---|---|---|---|---|---|
| A | 85445 | 62613 | 0 | 0 | 0.00% | 0.00% |  |
| B | 85445 | 62880 | 0 | 0 | 0.00% | 0.00% |  |
| C | 85445 | 62880 | 0 | 0 | 0.00% | 0.00% | 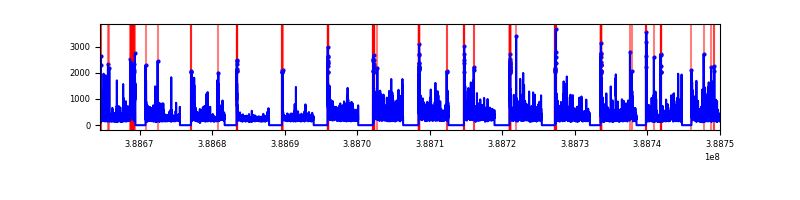 |
| D | 85445 | 62797 | 0 | 0 | 0.00% | 0.00% | 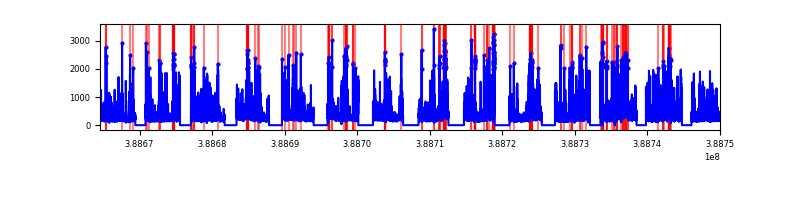 |
Top three noisy pixels from each quadrant. If the there are fewer than three noisy pixels in the level2.evt file, extra rows are filled as -1
| Pixel properties | Quadrant properties | ||||||
|---|---|---|---|---|---|---|---|
| Quadrant | DetID | PixID | Counts | Sigma | Mean | Median | Sigma |
| A | 7 | 110 | 2843 | 8.95 | 897 | 844 | 223.2 |
| A | 9 | 19 | 2791 | 8.72 | 897 | 844 | 223.2 |
| A | 0 | 29 | 2739 | 8.49 | 897 | 844 | 223.2 |
| B | 2 | 9 | 3104 | 12.64 | 906 | 867 | 176.9 |
| B | 3 | 80 | 2660 | 10.13 | 906 | 867 | 176.9 |
| B | 2 | 8 | 2448 | 8.94 | 906 | 867 | 176.9 |
| C | 1 | 81 | 2985 | 8.66 | 944 | 890 | 242.0 |
| C | 1 | 80 | 2973 | 8.61 | 944 | 890 | 242.0 |
| C | 3 | 187 | 2390 | 6.2 | 944 | 890 | 242.0 |
| D | 7 | 3 | 2328 | 6.53 | 877 | 801 | 234.0 |
| D | 6 | 67 | 2252 | 6.2 | 877 | 801 | 234.0 |
| D | 10 | 189 | 2213 | 6.03 | 877 | 801 | 234.0 |
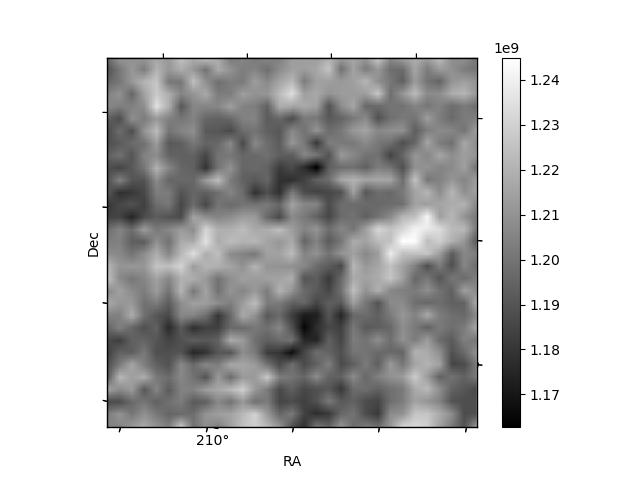
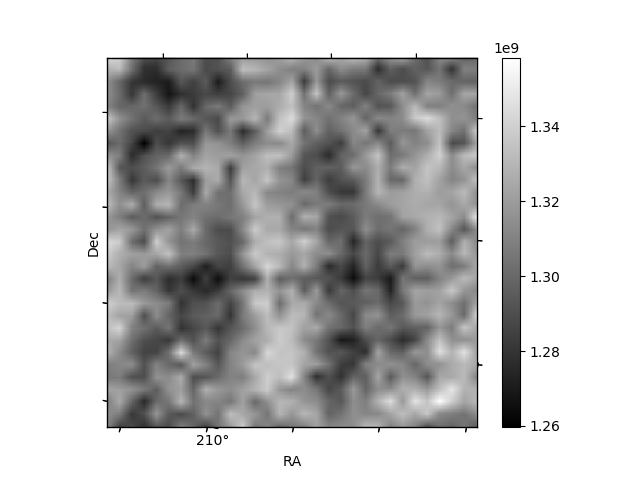
Histogram calculated using DETX and DETY for each event in the final _common_clean file
| Quadrant A | 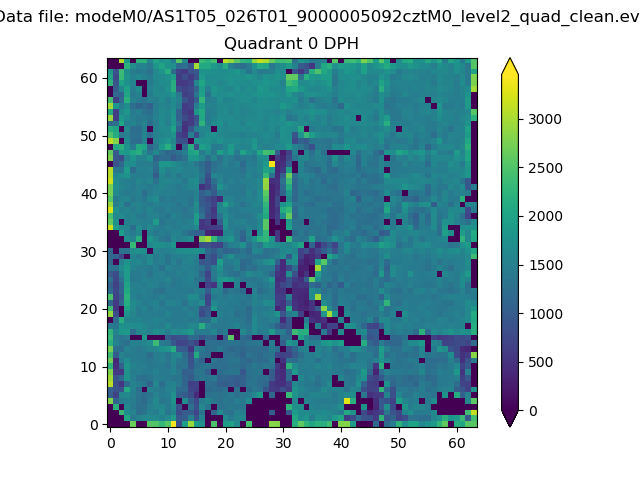 |
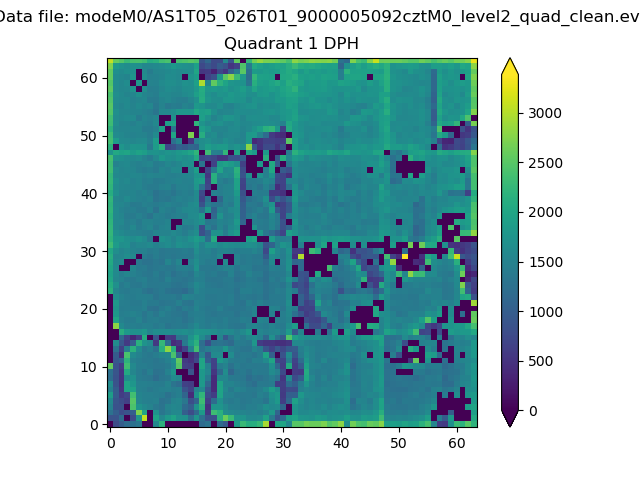 |
Quadrant B |
|---|---|---|---|
| Quadrant D | 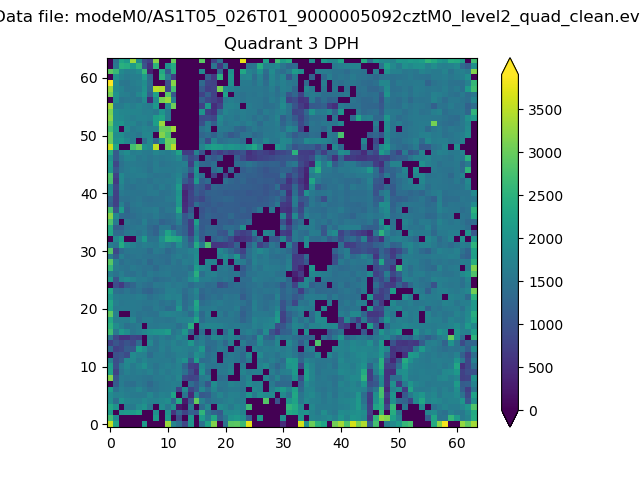 |
 |
Quadrant C |
| Plot type | Count rate plots | Images |
|---|---|---|
| Comparison with Poisson distribution Blue bars denote a histogram of data divided into 1 sec bins. Red curve is a Poisson curve with rate = median count rate of data. |
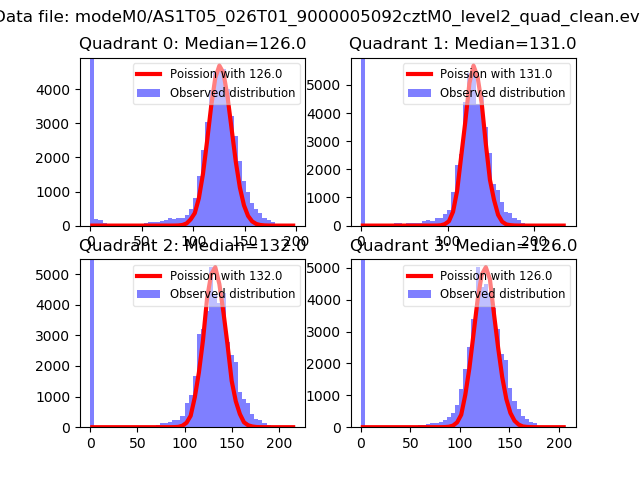 |
 |
| Quadrant-wise count rates Data is divided into 100 sec bins |
 |
|
| Module-wise count rates for Quadrant A Data is divided into 100 sec bins |
 |
 |
| Module-wise count rates for Quadrant B Data is divided into 100 sec bins |
 |
 |
| Module-wise count rates for Quadrant C Data is divided into 100 sec bins |
 |
 |
| Module-wise count rates for Quadrant D Data is divided into 100 sec bins |
 |
 |
| Parameter | Plot |
|---|---|
| CZT HV Monitor | 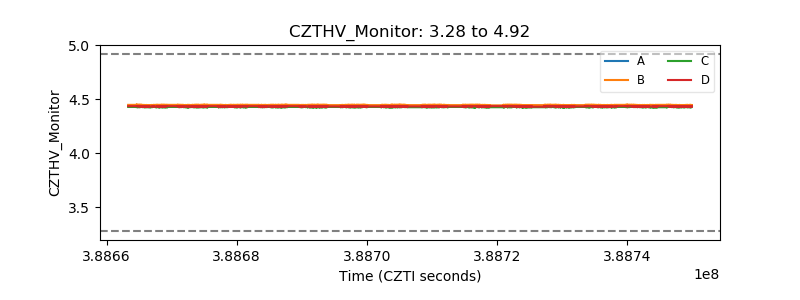 |
| D_VDD |  |
| Temperature 1 |  |
| Veto HV Monitor |  |
| Veto LLD |  |
| Alpha Counter | 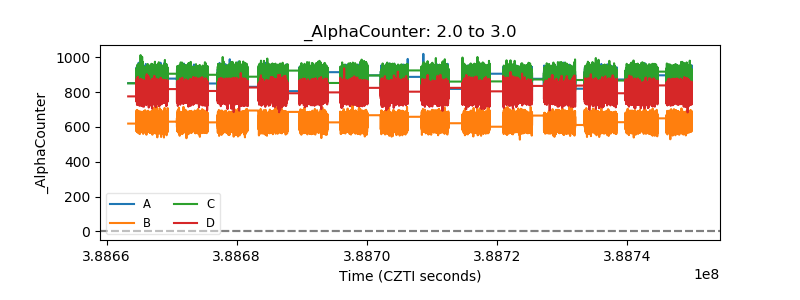 |
| _CPM_Rate |  |
| CZT Counter |  |
| +2.5 Volts monitor |  |
| +5 Volts monitor |  |
| _ROLL_ROT |  |
| _Roll_DEC | 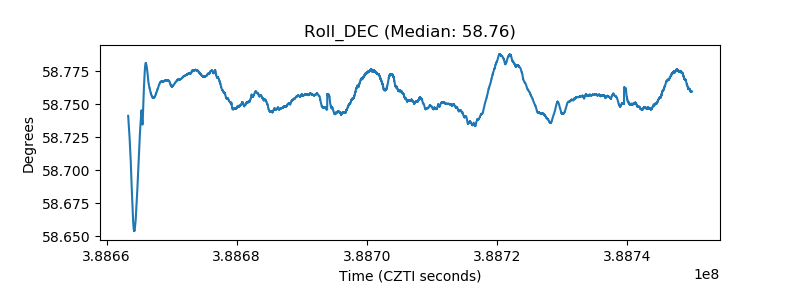 |
| _Roll_RA | 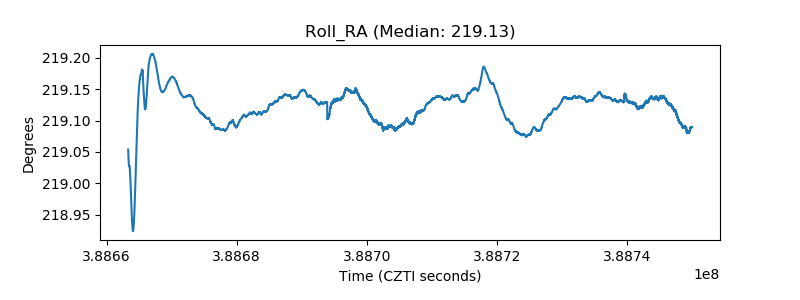 |
| Veto Counter | 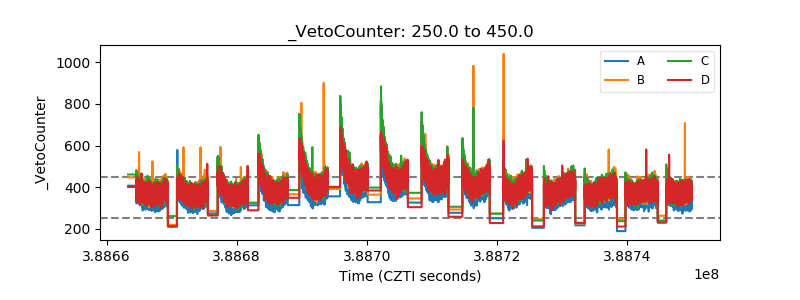 |