| Param | Original file | Final file |
|---|---|---|
| Filename | modeM0/AS1T05_026T01_9000005092_35560cztM0_level2.evt | modeM0/AS1T05_026T01_9000005092_35560cztM0_level2_quad_clean.evt |
| Size (bytes) | 872,951,040 | 154,851,840 |
| Size | 832.5 MB | 147.7 MB |
| Events in quadrant A | 7,423,142 | 981,350 |
| Events in quadrant B | 5,912,471 | 1,003,802 |
| Events in quadrant C | 6,501,746 | 1,005,787 |
| Events in quadrant D | 5,884,358 | 965,365 |
| Mode SS | |||
|---|---|---|---|
| Quadrant | BADHDUFLAG | Total packets | Discarded packets |
| A | 0 | 216 | 0 |
| B | 0 | 216 | 0 |
| C | 0 | 216 | 0 |
| D | 0 | 216 | 0 |
| Mode M9 | |||
|---|---|---|---|
| Quadrant | BADHDUFLAG | Total packets | Discarded packets |
| A | 0 | 37 | 0 |
| B | 0 | 37 | 0 |
| C | 0 | 37 | 0 |
| D | 0 | 38 | 0 |
| Mode M0 | |||
|---|---|---|---|
| Quadrant | BADHDUFLAG | Total packets | Discarded packets |
| A | 0 | 30700 | 4 |
| B | 0 | 24461 | 3 |
| C | 0 | 25491 | 3 |
| D | 0 | 24309 | 3 |
| Quadrant | Total seconds | Saturated seconds | Saturation percentage |
|---|---|---|---|
| A | 10596 | 34 | 0.320876% |
| B | 10596 | 263 | 2.482069% |
| C | 10596 | 251 | 2.368818% |
| D | 10596 | 113 | 1.066440% |
Noise dominated data is calculated using 1-second bins in cleaned event files. If a bin has >2000 counts, and if more than 50% of those come from <1% of pixels, then it is considered to be noise-dominated and hence unusable.
| Quadrant | # 1 sec bins | Bins with >0 counts | Bins with >2000 counts | High rate bins dominated by noise | Noise dominated (total time) | Noise dominated (detector-on time) | Marked lightcurve |
|---|---|---|---|---|---|---|---|
| A | 13520 | 10598 | 1 | 1 | 0.01% | 0.01% | 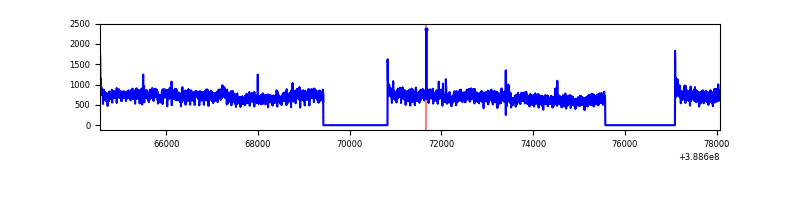 |
| B | 13520 | 10598 | 133 | 133 | 0.98% | 1.25% | 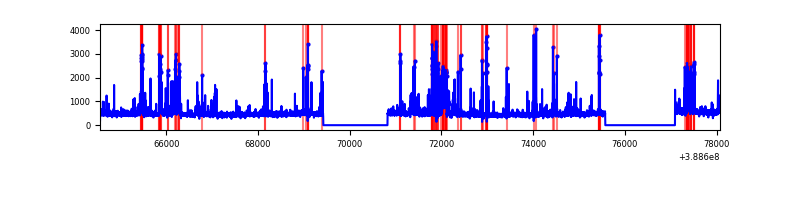 |
| C | 13520 | 10598 | 236 | 236 | 1.75% | 2.23% | 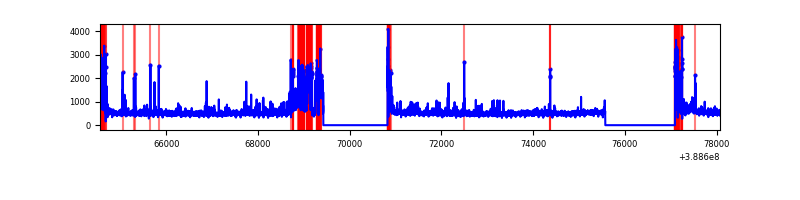 |
| D | 13520 | 10598 | 90 | 90 | 0.67% | 0.85% | 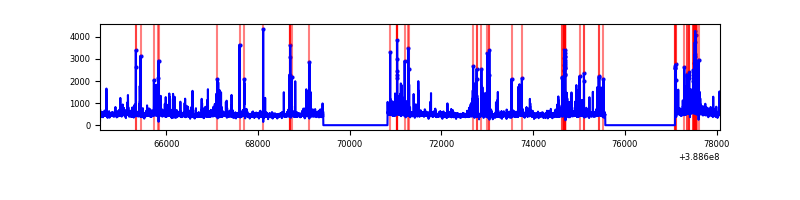 |
Top three noisy pixels from each quadrant. If the there are fewer than three noisy pixels in the level2.evt file, extra rows are filled as -1
| Pixel properties | Quadrant properties | ||||||
|---|---|---|---|---|---|---|---|
| Quadrant | DetID | PixID | Counts | Sigma | Mean | Median | Sigma |
| A | 15 | 169 | 2475153 | 10229.28 | 1209 | 1183 | 241.9 |
| A | 10 | 83 | 232869 | 957.97 | 1209 | 1183 | 241.9 |
| A | 13 | 6 | 30560 | 121.47 | 1209 | 1183 | 241.9 |
| B | 5 | 172 | 1023544 | 4494.77 | 1202 | 1171 | 227.5 |
| B | 0 | 189 | 49932 | 214.37 | 1202 | 1171 | 227.5 |
| B | 0 | 190 | 49375 | 211.92 | 1202 | 1171 | 227.5 |
| C | 0 | 239 | 685088 | 2482.38 | 1189 | 1198 | 275.5 |
| C | 0 | 10 | 618087 | 2239.18 | 1189 | 1198 | 275.5 |
| C | 15 | 214 | 469721 | 1700.64 | 1189 | 1198 | 275.5 |
| D | 8 | 195 | 309641 | 1076.98 | 1186 | 1153 | 286.4 |
| D | 1 | 52 | 252498 | 877.49 | 1186 | 1153 | 286.4 |
| D | 13 | 249 | 222440 | 772.55 | 1186 | 1153 | 286.4 |
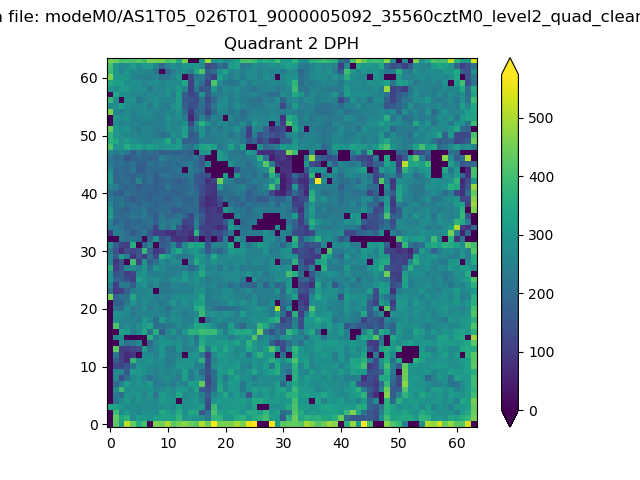
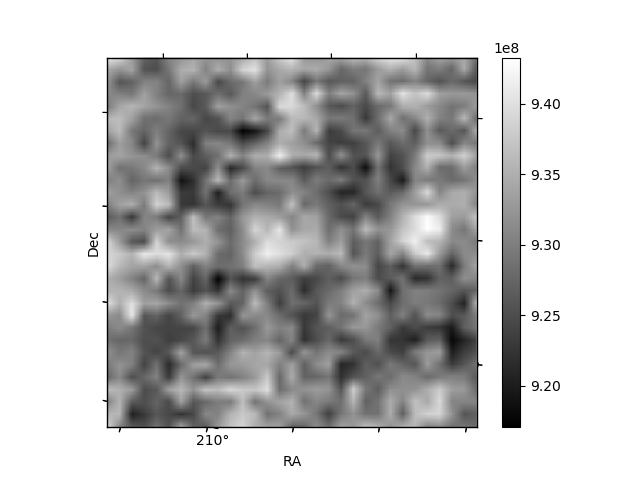
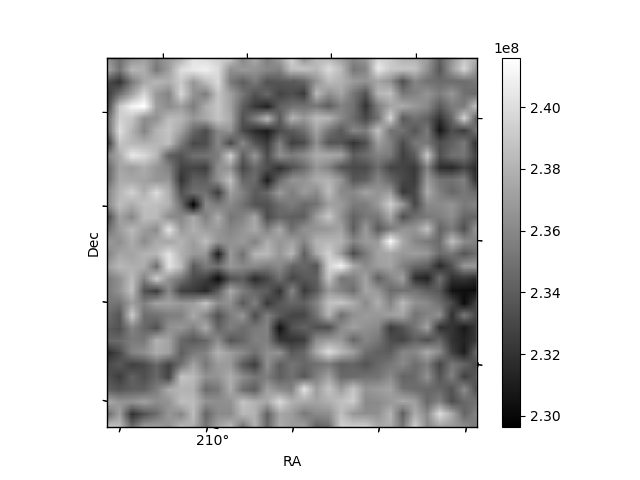
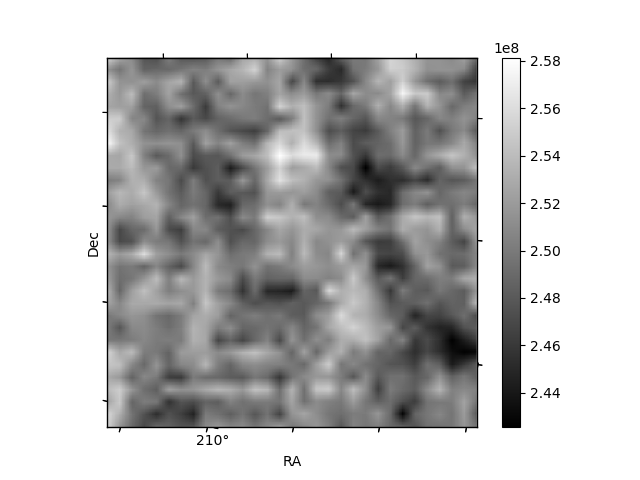
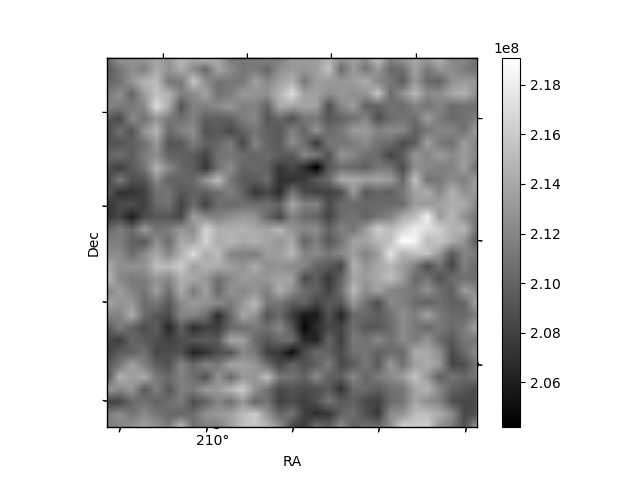
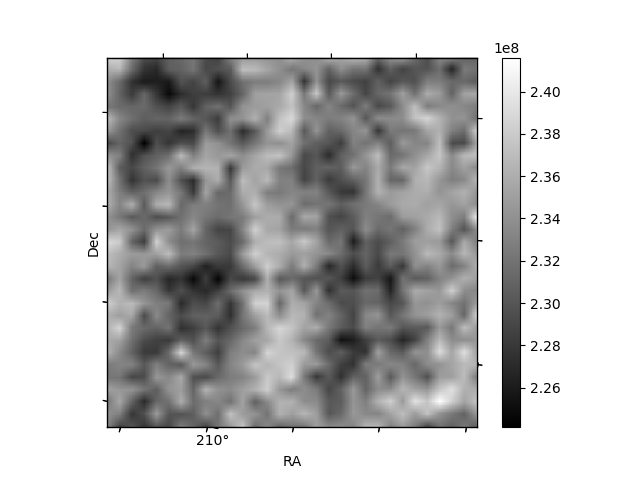
Histogram calculated using DETX and DETY for each event in the final _common_clean file
| Quadrant A | 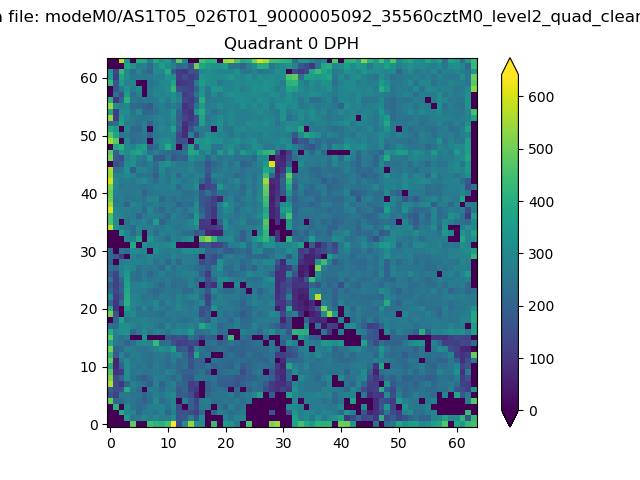 |
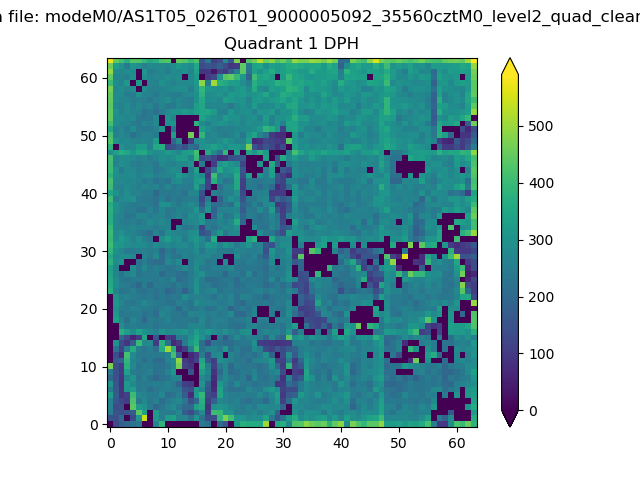 |
Quadrant B |
|---|---|---|---|
| Quadrant D | 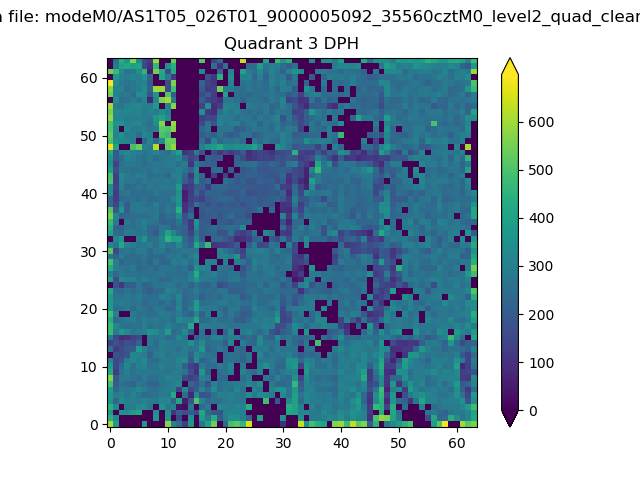 |
 |
Quadrant C |
| Plot type | Count rate plots | Images |
|---|---|---|
| Comparison with Poisson distribution Blue bars denote a histogram of data divided into 1 sec bins. Red curve is a Poisson curve with rate = median count rate of data. |
 |
 |
| Quadrant-wise count rates Data is divided into 100 sec bins |
 |
|
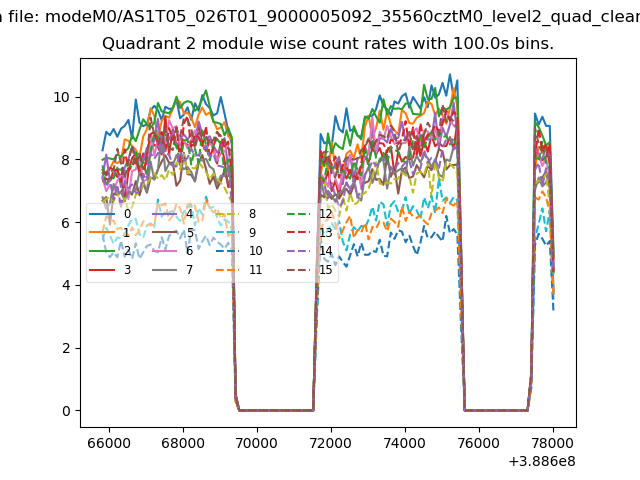
| Module-wise count rates for Quadrant A Data is divided into 100 sec bins |
 |
 |
| Module-wise count rates for Quadrant B Data is divided into 100 sec bins |
 |
 |
| Module-wise count rates for Quadrant C Data is divided into 100 sec bins |
 |
 |
| Module-wise count rates for Quadrant D Data is divided into 100 sec bins |
 |
 |
| Parameter | Plot |
|---|---|
| CZT HV Monitor | 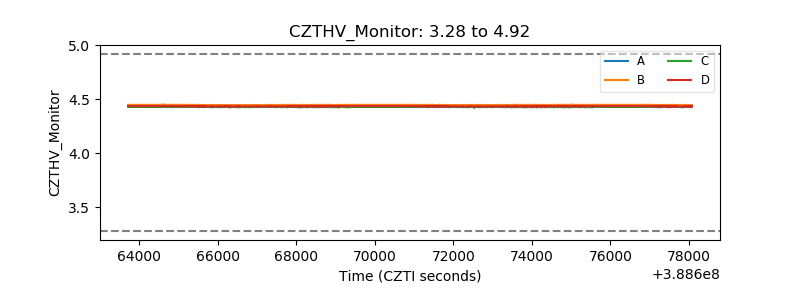 |
| D_VDD | 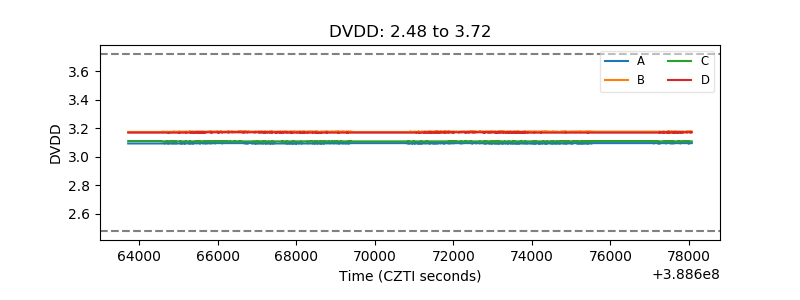 |
| Temperature 1 |  |
| Veto HV Monitor | 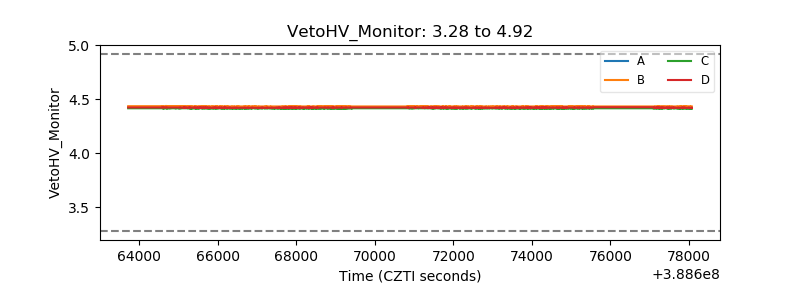 |
| Veto LLD | 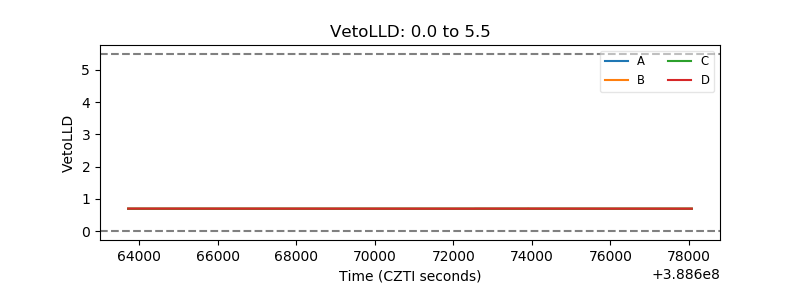 |
| Alpha Counter | 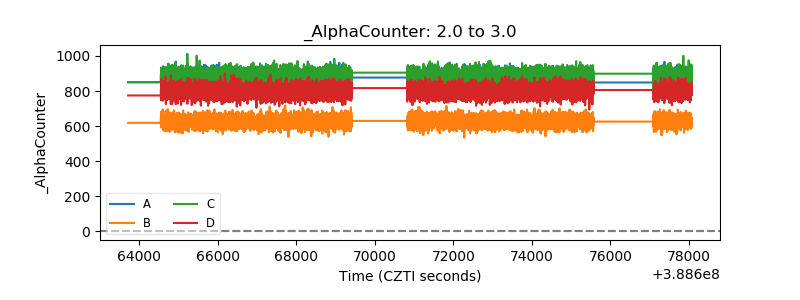 |
| _CPM_Rate | 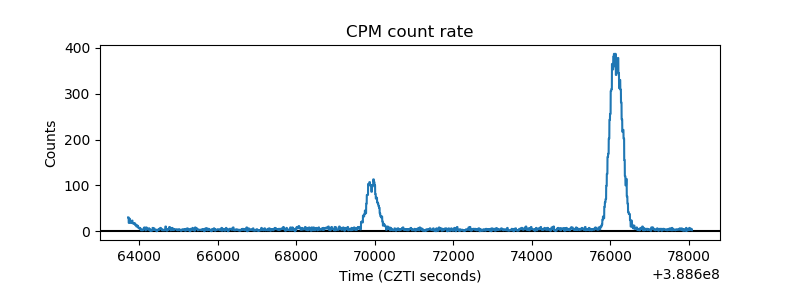 |
| CZT Counter | 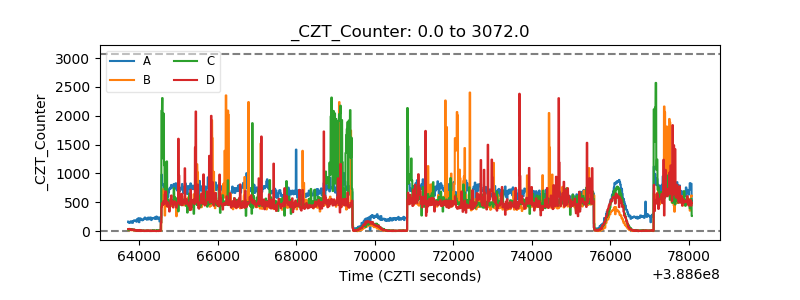 |
| +2.5 Volts monitor |  |
| +5 Volts monitor |  |
| _ROLL_ROT |  |
| _Roll_DEC |  |
| _Roll_RA | 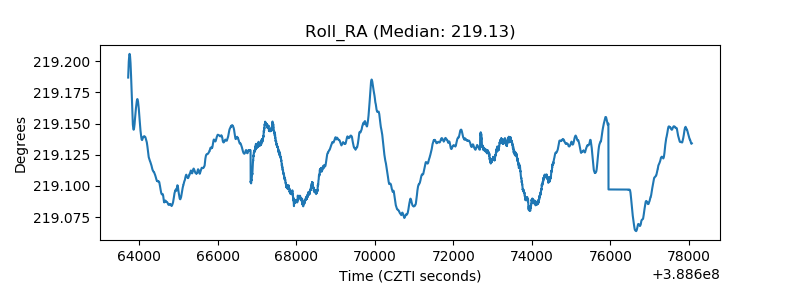 |
| Veto Counter | 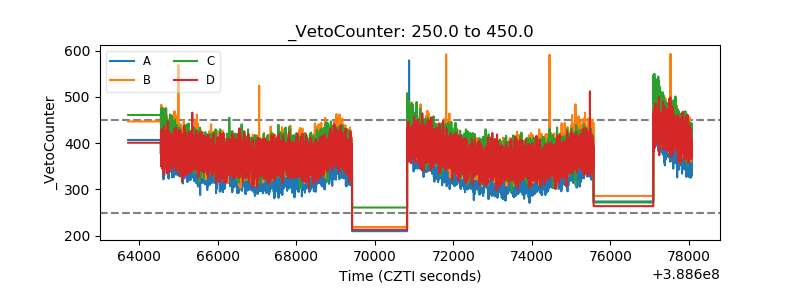 |