| Param | Original file | Final file |
|---|---|---|
| Filename | modeM0/AS1T05_026T01_9000005092_35567cztM0_level2.evt | modeM0/AS1T05_026T01_9000005092_35567cztM0_level2_quad_clean.evt |
| Size (bytes) | 413,585,280 | 70,876,800 |
| Size | 394.4 MB | 67.6 MB |
| Events in quadrant A | 2,805,638 | 439,924 |
| Events in quadrant B | 2,822,054 | 460,348 |
| Events in quadrant C | 3,359,724 | 456,610 |
| Events in quadrant D | 3,199,120 | 439,528 |
| Mode SS | |||
|---|---|---|---|
| Quadrant | BADHDUFLAG | Total packets | Discarded packets |
| A | 0 | 106 | 0 |
| B | 0 | 106 | 0 |
| C | 0 | 106 | 0 |
| D | 0 | 106 | 0 |
| Mode M9 | |||
|---|---|---|---|
| Quadrant | BADHDUFLAG | Total packets | Discarded packets |
| A | 0 | 42 | 0 |
| B | 0 | 42 | 0 |
| C | 0 | 42 | 0 |
| D | 0 | 42 | 0 |
| Mode M0 | |||
|---|---|---|---|
| Quadrant | BADHDUFLAG | Total packets | Discarded packets |
| A | 0 | 11256 | 3 |
| B | 0 | 11572 | 2 |
| C | 0 | 13122 | 2 |
| D | 0 | 12728 | 2 |
| Quadrant | Total seconds | Saturated seconds | Saturation percentage |
|---|---|---|---|
| A | 4979 | 6 | 0.120506% |
| B | 4979 | 132 | 2.651135% |
| C | 4979 | 171 | 3.434425% |
| D | 4979 | 188 | 3.775859% |
Noise dominated data is calculated using 1-second bins in cleaned event files. If a bin has >2000 counts, and if more than 50% of those come from <1% of pixels, then it is considered to be noise-dominated and hence unusable.
| Quadrant | # 1 sec bins | Bins with >0 counts | Bins with >2000 counts | High rate bins dominated by noise | Noise dominated (total time) | Noise dominated (detector-on time) | Marked lightcurve |
|---|---|---|---|---|---|---|---|
| A | 9254 | 4981 | 0 | 0 | 0.00% | 0.00% | 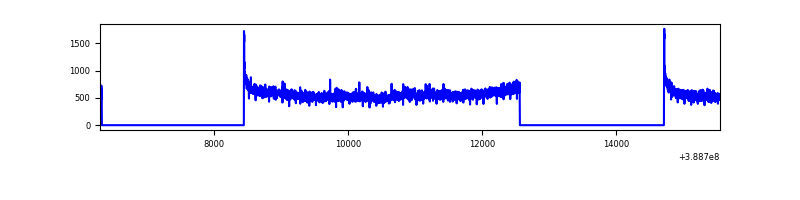 |
| B | 9254 | 4981 | 63 | 63 | 0.68% | 1.26% | 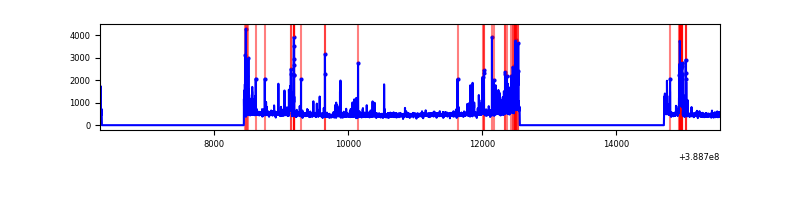 |
| C | 9254 | 4981 | 118 | 118 | 1.28% | 2.37% | 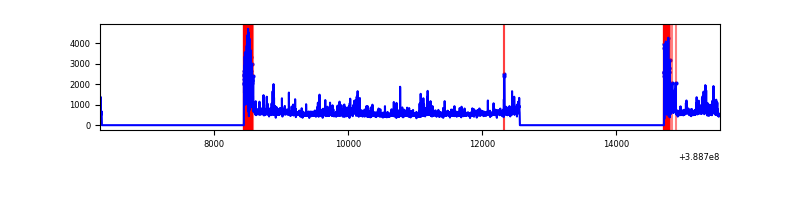 |
| D | 9254 | 4981 | 156 | 156 | 1.69% | 3.13% | 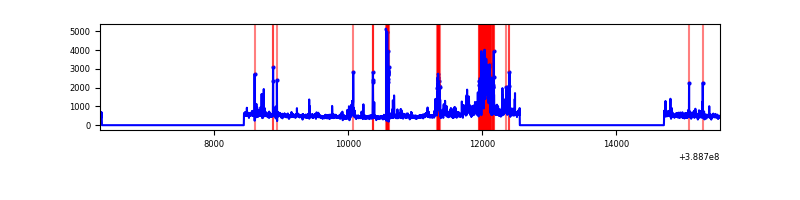 |
Top three noisy pixels from each quadrant. If the there are fewer than three noisy pixels in the level2.evt file, extra rows are filled as -1
| Pixel properties | Quadrant properties | ||||||
|---|---|---|---|---|---|---|---|
| Quadrant | DetID | PixID | Counts | Sigma | Mean | Median | Sigma |
| A | 15 | 169 | 416963 | 3611.39 | 580 | 570 | 115.3 |
| A | 10 | 83 | 129480 | 1118.04 | 580 | 570 | 115.3 |
| A | 13 | 6 | 16909 | 141.71 | 580 | 570 | 115.3 |
| B | 5 | 172 | 406225 | 3710.48 | 585 | 570 | 109.3 |
| B | 4 | 81 | 70856 | 642.9 | 585 | 570 | 109.3 |
| B | 0 | 189 | 23614 | 210.78 | 585 | 570 | 109.3 |
| C | 0 | 10 | 582306 | 4395.36 | 571 | 578 | 132.4 |
| C | 9 | 187 | 288927 | 2178.68 | 571 | 578 | 132.4 |
| C | 15 | 214 | 218535 | 1646.82 | 571 | 578 | 132.4 |
| D | 14 | 52 | 460958 | 3413.04 | 562 | 547 | 134.9 |
| D | 8 | 195 | 203531 | 1504.73 | 562 | 547 | 134.9 |
| D | 2 | 250 | 141422 | 1044.31 | 562 | 547 | 134.9 |
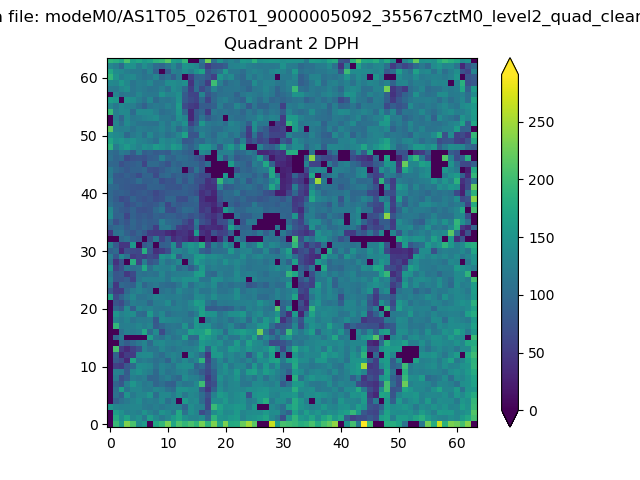
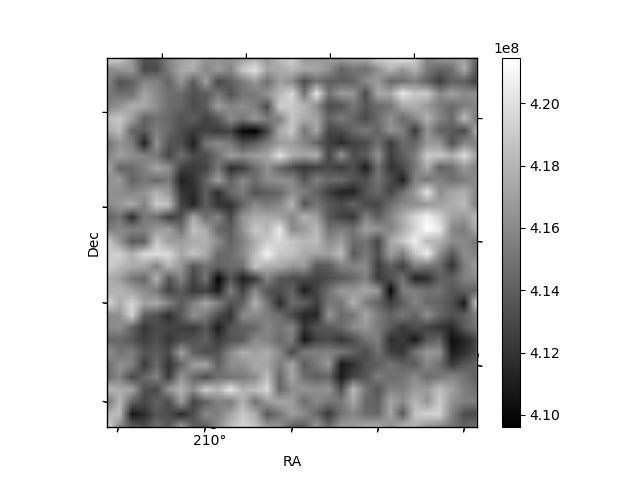
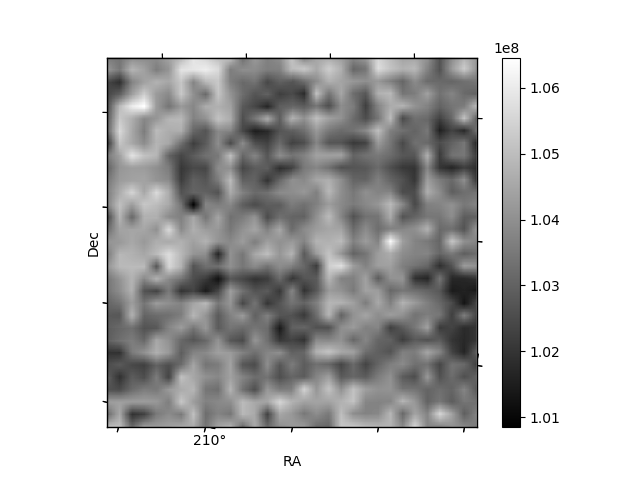
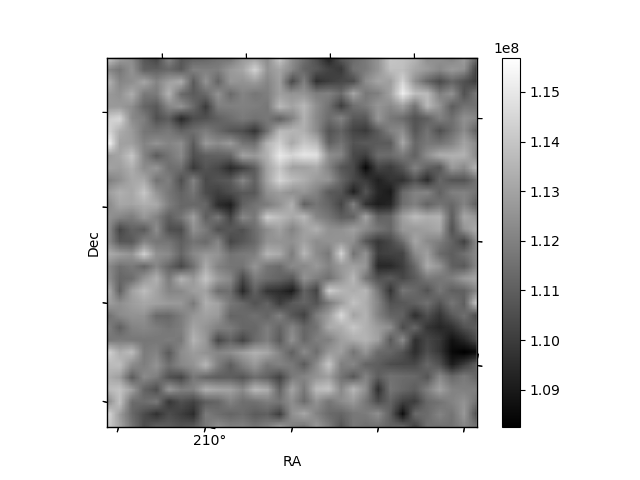
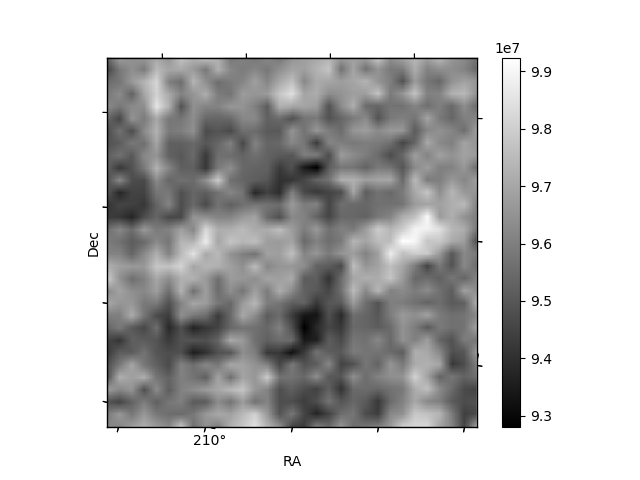
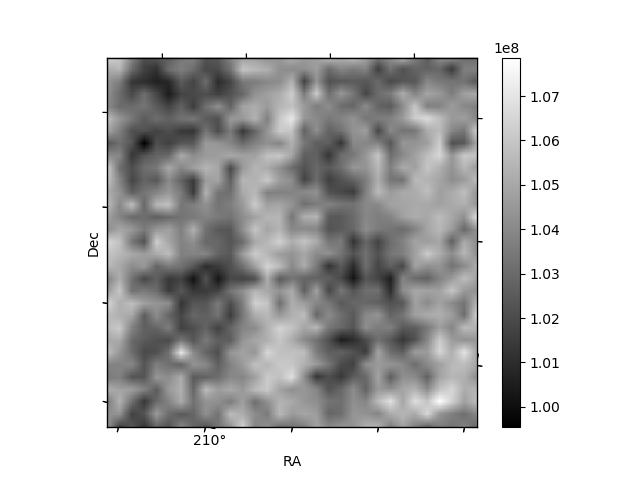
Histogram calculated using DETX and DETY for each event in the final _common_clean file
| Quadrant A | 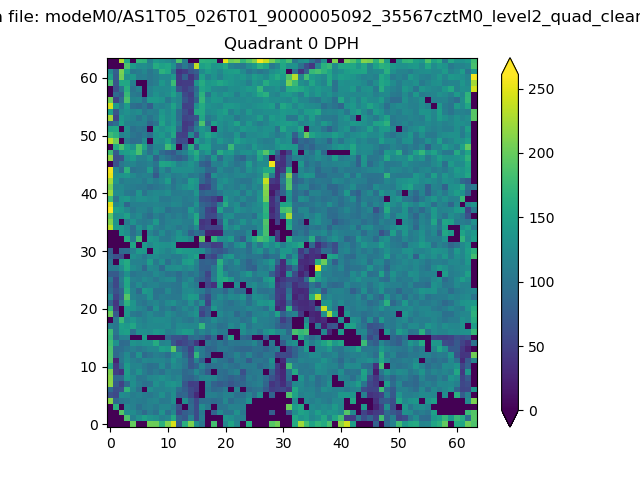 |
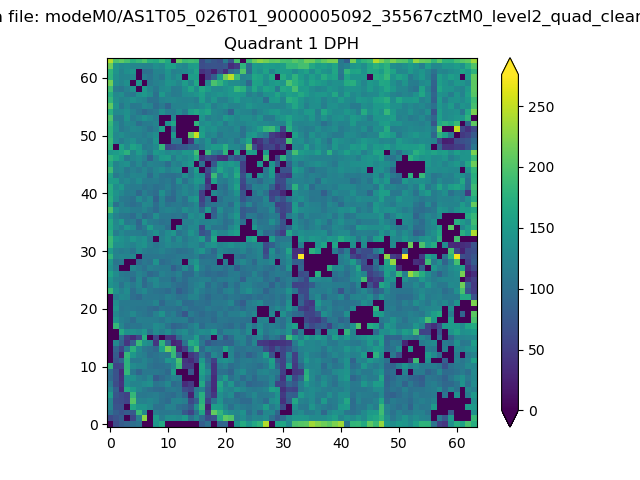 |
Quadrant B |
|---|---|---|---|
| Quadrant D | 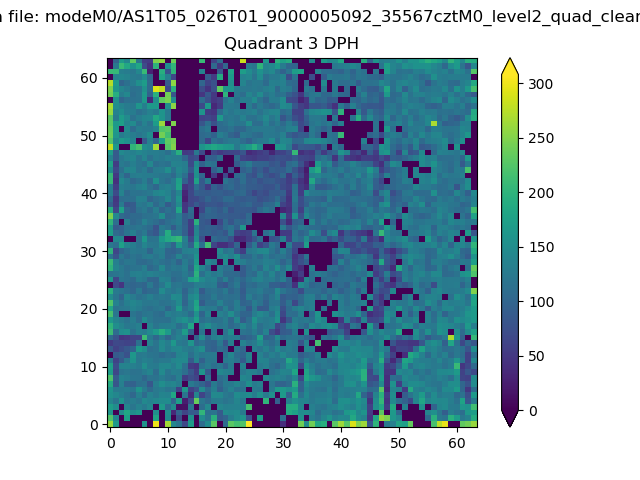 |
 |
Quadrant C |
| Plot type | Count rate plots | Images |
|---|---|---|
| Comparison with Poisson distribution Blue bars denote a histogram of data divided into 1 sec bins. Red curve is a Poisson curve with rate = median count rate of data. |
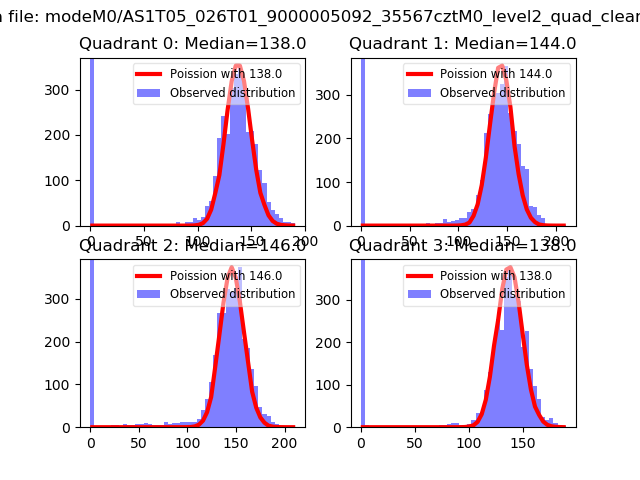 |
 |
| Quadrant-wise count rates Data is divided into 100 sec bins |
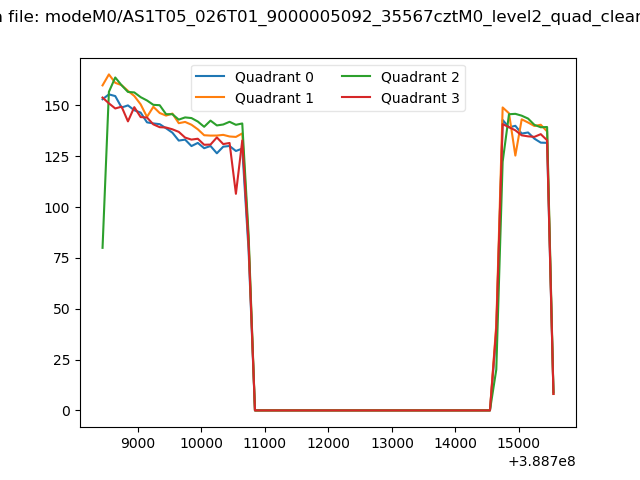 |
|
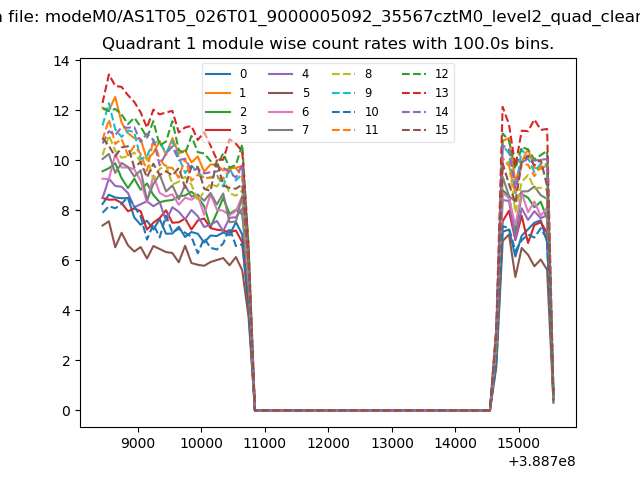
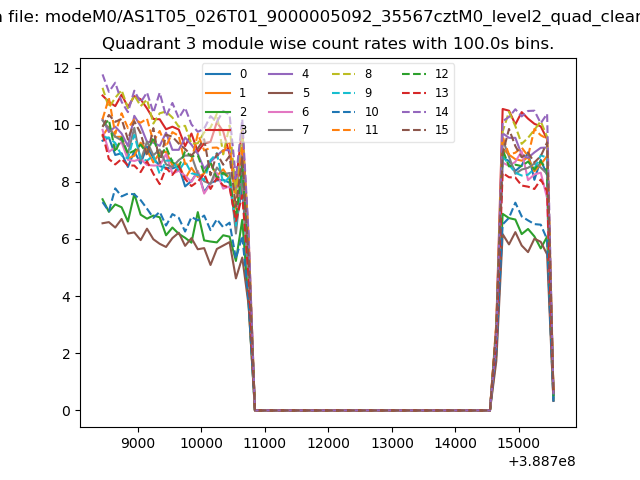
| Module-wise count rates for Quadrant A Data is divided into 100 sec bins |
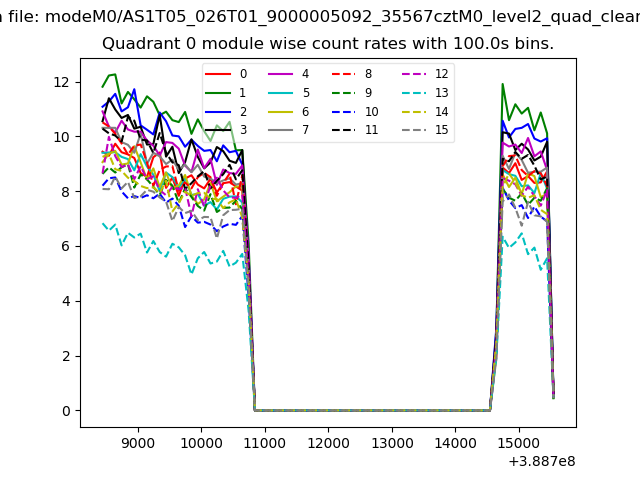 |
 |
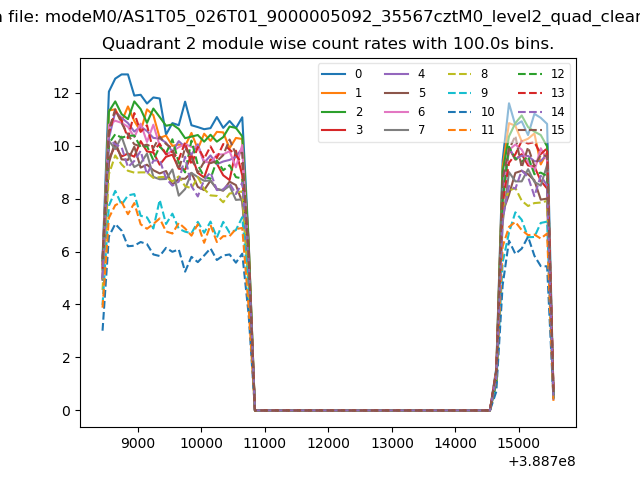
| Module-wise count rates for Quadrant B Data is divided into 100 sec bins |
 |
 |
| Module-wise count rates for Quadrant C Data is divided into 100 sec bins |
 |
 |
| Module-wise count rates for Quadrant D Data is divided into 100 sec bins |
 |
 |
| Parameter | Plot |
|---|---|
| CZT HV Monitor | 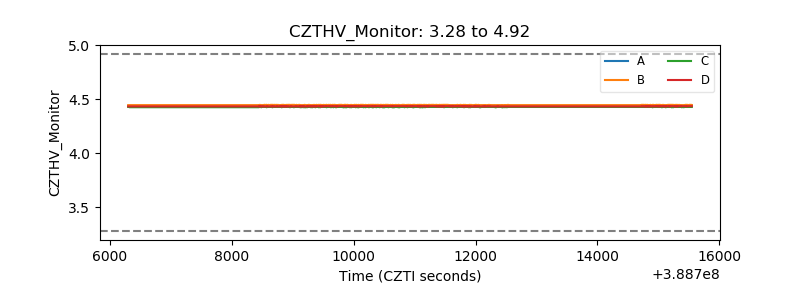 |
| D_VDD | 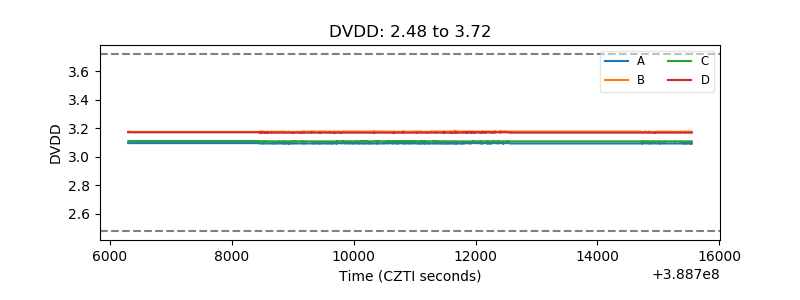 |
| Temperature 1 | 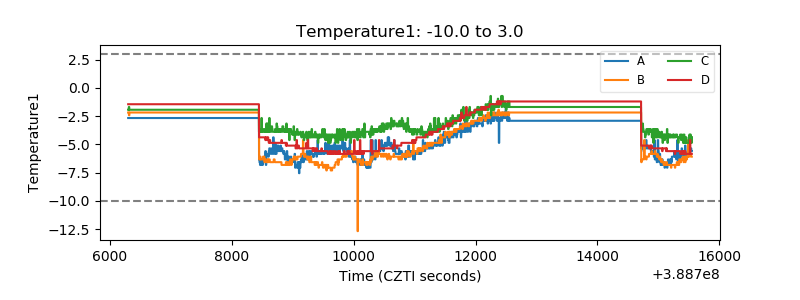 |
| Veto HV Monitor | 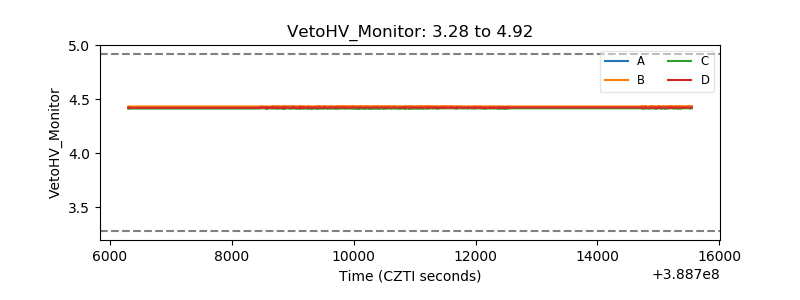 |
| Veto LLD |  |
| Alpha Counter | 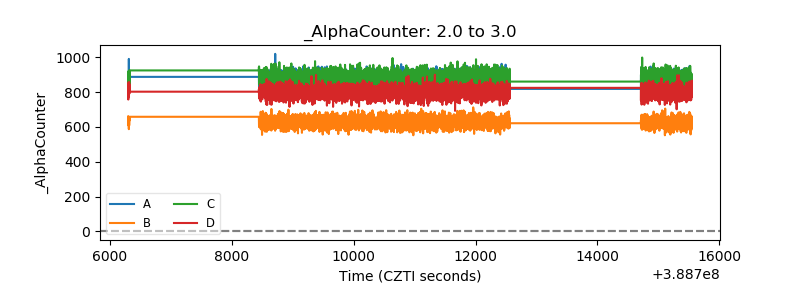 |
| _CPM_Rate |  |
| CZT Counter | 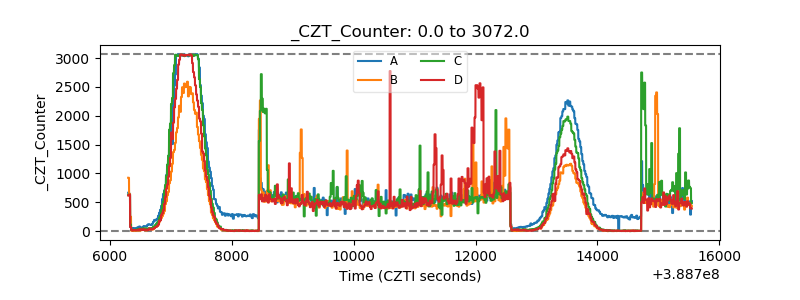 |
| +2.5 Volts monitor |  |
| +5 Volts monitor |  |
| _ROLL_ROT | 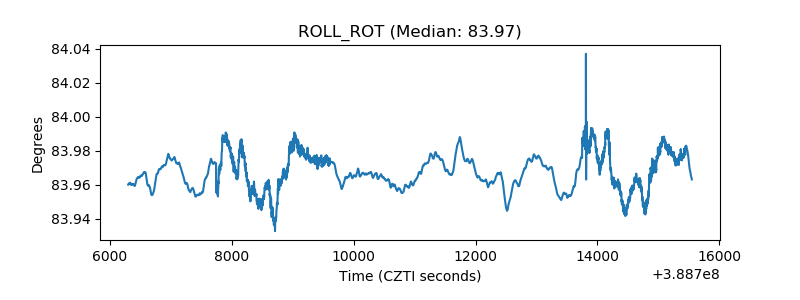 |
| _Roll_DEC | 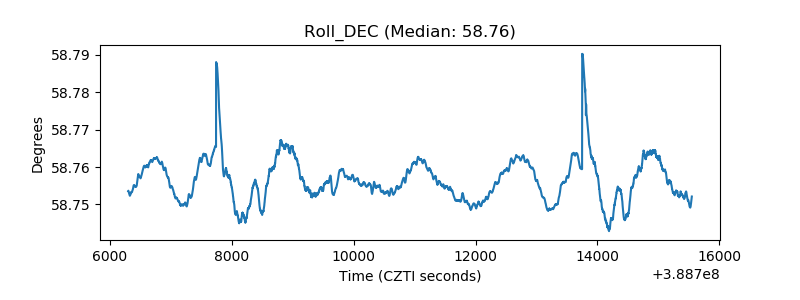 |
| _Roll_RA | 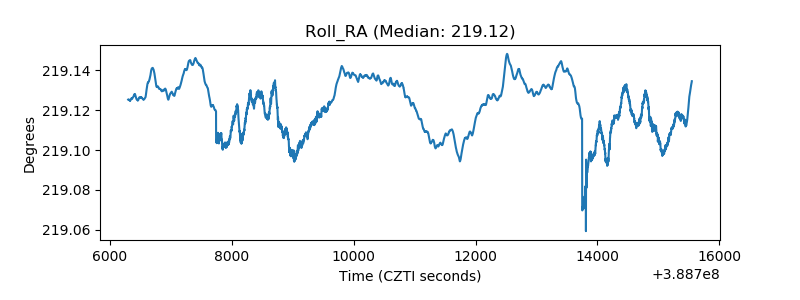 |
| Veto Counter | 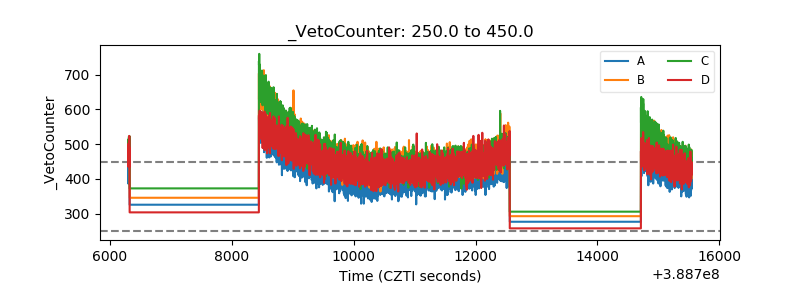 |