| Param | Original file | Final file |
|---|---|---|
| Filename | modeM0/AS1A10_071T01_9000005096cztM0_level2.fits | modeM0/AS1A10_071T01_9000005096cztM0_level2_quad_clean.evt |
| Size (bytes) | 406,768,320 | 301,826,880 |
| Size | 387.9 MB | 287.8 MB |
| Events in quadrant A | 2,483,940 | 1,617,667 |
| Events in quadrant B | 2,335,834 | 1,566,000 |
| Events in quadrant C | 2,450,740 | 1,584,893 |
| Events in quadrant D | 2,135,192 | 1,457,944 |
| Mode SS | |||
|---|---|---|---|
| Quadrant | BADHDUFLAG | Total packets | Discarded packets |
| A | 0 | 864 | 0 |
| B | 0 | 864 | 0 |
| C | 0 | 864 | 0 |
| D | 0 | 864 | 0 |
| Mode M9 | |||
|---|---|---|---|
| Quadrant | BADHDUFLAG | Total packets | Discarded packets |
| A | 0 | 165 | 0 |
| B | 0 | 165 | 0 |
| C | 0 | 165 | 0 |
| D | 0 | 165 | 0 |
| Mode M0 | |||
|---|---|---|---|
| Quadrant | BADHDUFLAG | Total packets | Discarded packets |
| A | 0 | 99331 | 0 |
| B | 0 | 109792 | 0 |
| C | 0 | 93223 | 0 |
| D | 0 | 95632 | 0 |
| Quadrant | Total seconds | Saturated seconds | Saturation percentage |
|---|---|---|---|
| A | 42429 | 988 | 2.328596% |
| B | 42429 | 2696 | 6.354145% |
| C | 42429 | 702 | 1.654529% |
| D | 42429 | 404 | 0.952179% |
Noise dominated data is calculated using 1-second bins in cleaned event files. If a bin has >2000 counts, and if more than 50% of those come from <1% of pixels, then it is considered to be noise-dominated and hence unusable.
| Quadrant | # 1 sec bins | Bins with >0 counts | Bins with >2000 counts | High rate bins dominated by noise | Noise dominated (total time) | Noise dominated (detector-on time) | Marked lightcurve |
|---|---|---|---|---|---|---|---|
| A | 58774 | 42335 | 0 | 0 | 0.00% | 0.00% |  |
| B | 58774 | 42412 | 0 | 0 | 0.00% | 0.00% |  |
| C | 58774 | 42415 | 0 | 0 | 0.00% | 0.00% |  |
| D | 58774 | 42423 | 0 | 0 | 0.00% | 0.00% |  |
Top three noisy pixels from each quadrant. If the there are fewer than three noisy pixels in the level2.evt file, extra rows are filled as -1
| Pixel properties | Quadrant properties | ||||||
|---|---|---|---|---|---|---|---|
| Quadrant | DetID | PixID | Counts | Sigma | Mean | Median | Sigma |
| A | 7 | 110 | 2030 | 8.77 | 648 | 608 | 162.2 |
| A | 0 | 29 | 2001 | 8.59 | 648 | 608 | 162.2 |
| A | 9 | 19 | 1971 | 8.4 | 648 | 608 | 162.2 |
| B | 2 | 9 | 2004 | 11.66 | 617 | 589 | 121.3 |
| B | 3 | 80 | 1793 | 9.92 | 617 | 589 | 121.3 |
| B | 5 | 128 | 1654 | 8.77 | 617 | 589 | 121.3 |
| C | 3 | 234 | 1717 | 6.5 | 649 | 609 | 170.6 |
| C | 9 | 233 | 1643 | 6.06 | 649 | 609 | 170.6 |
| C | 12 | 250 | 1613 | 5.89 | 649 | 609 | 170.6 |
| D | 4 | 160 | 1566 | 6.18 | 610 | 559 | 163.0 |
| D | 10 | 113 | 1553 | 6.1 | 610 | 559 | 163.0 |
| D | 7 | 3 | 1530 | 5.96 | 610 | 559 | 163.0 |
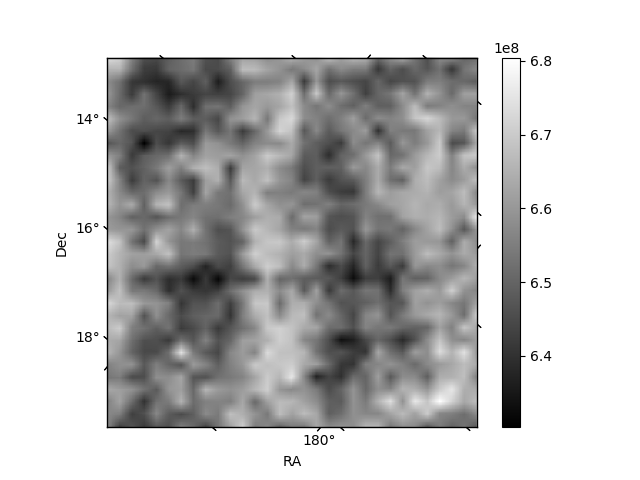
Histogram calculated using DETX and DETY for each event in the final _common_clean file
| Quadrant A |  |
 |
Quadrant B |
|---|---|---|---|
| Quadrant D |  |
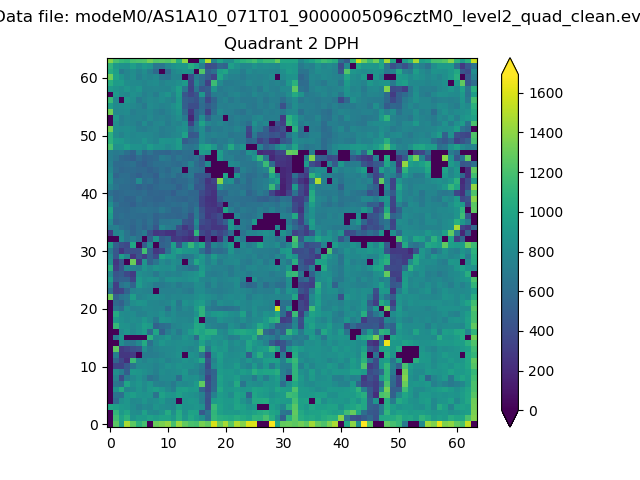 |
Quadrant C |
| Plot type | Count rate plots | Images |
|---|---|---|
| Comparison with Poisson distribution Blue bars denote a histogram of data divided into 1 sec bins. Red curve is a Poisson curve with rate = median count rate of data. |
 |
 |
| Quadrant-wise count rates Data is divided into 100 sec bins |
 |
|
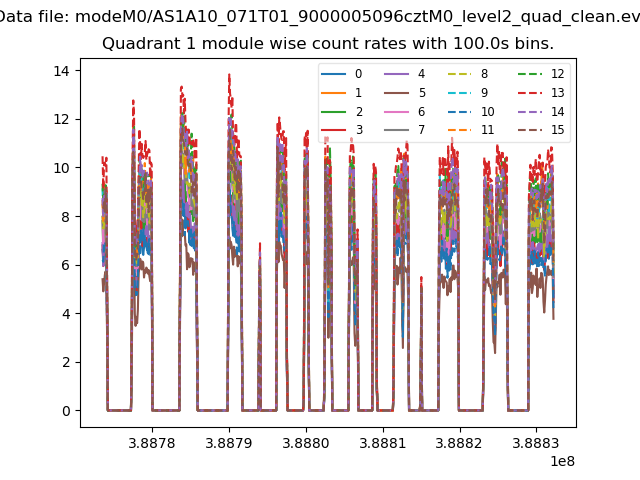
| Module-wise count rates for Quadrant A Data is divided into 100 sec bins |
 |
 |
| Module-wise count rates for Quadrant B Data is divided into 100 sec bins |
 |
 |
| Module-wise count rates for Quadrant C Data is divided into 100 sec bins |
 |
 |
| Module-wise count rates for Quadrant D Data is divided into 100 sec bins |
 |
 |
| Parameter | Plot |
|---|---|
| CZT HV Monitor |  |
| D_VDD | 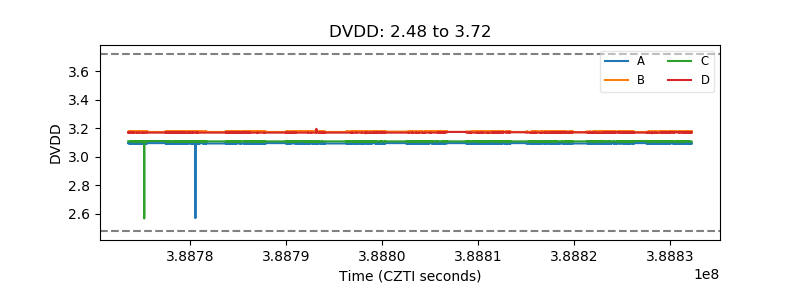 |
| Temperature 1 | 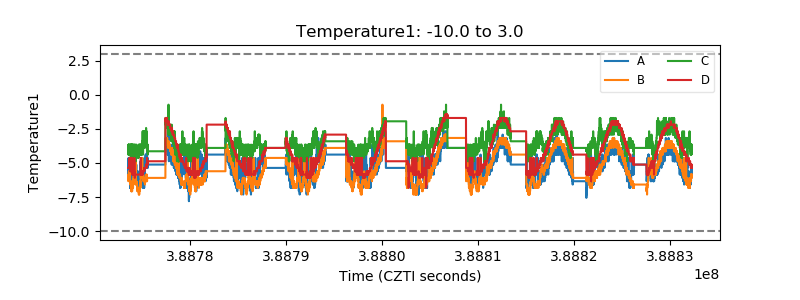 |
| Veto HV Monitor |  |
| Veto LLD |  |
| Alpha Counter |  |
| _CPM_Rate |  |
| CZT Counter |  |
| +2.5 Volts monitor | 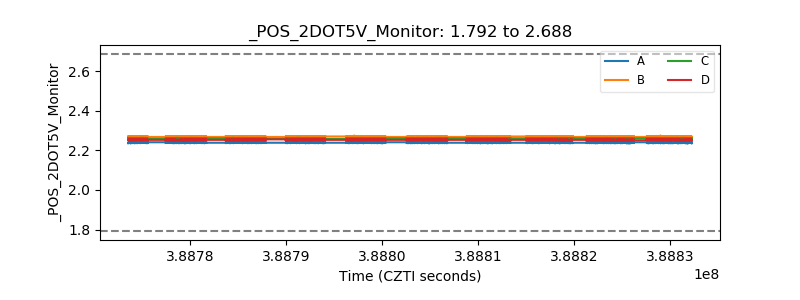 |
| +5 Volts monitor | 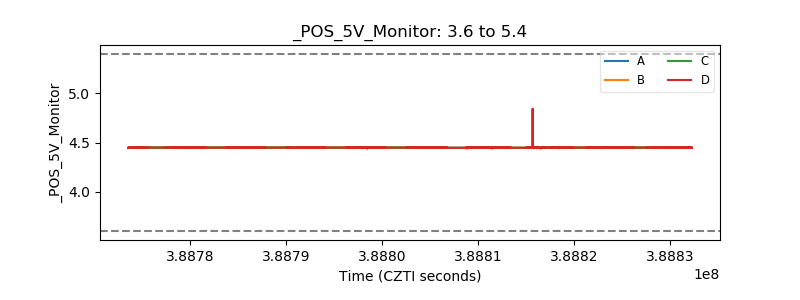 |
| _ROLL_ROT | 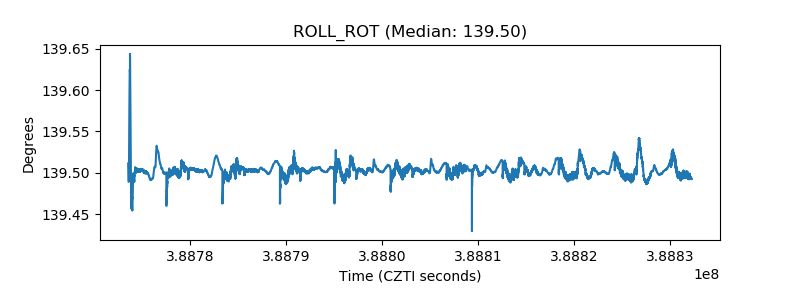 |
| _Roll_DEC | 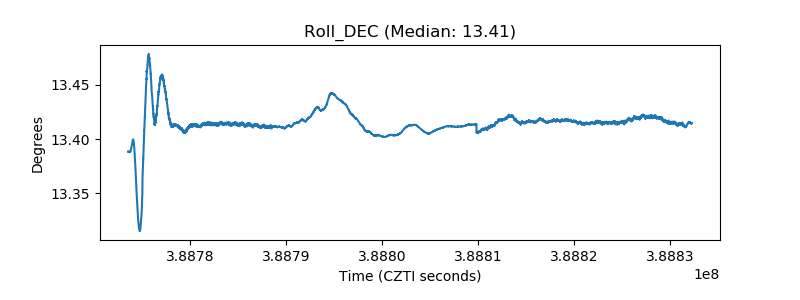 |
| _Roll_RA |  |
| Veto Counter |  |