| Param | Original file | Final file |
|---|---|---|
| Filename | modeM0/AS1A10_071T01_9000005096_35578cztM0_level2.evt | modeM0/AS1A10_071T01_9000005096_35578cztM0_level2_quad_clean.evt |
| Size (bytes) | 252,495,360 | 34,346,880 |
| Size | 240.8 MB | 32.8 MB |
| Events in quadrant A | 1,474,998 | 220,290 |
| Events in quadrant B | 2,547,512 | 188,337 |
| Events in quadrant C | 1,749,583 | 210,888 |
| Events in quadrant D | 1,672,470 | 209,356 |
| Mode SS | |||
|---|---|---|---|
| Quadrant | BADHDUFLAG | Total packets | Discarded packets |
| A | 0 | 62 | 0 |
| B | 0 | 62 | 0 |
| C | 0 | 62 | 0 |
| D | 0 | 62 | 0 |
| Mode M9 | |||
|---|---|---|---|
| Quadrant | BADHDUFLAG | Total packets | Discarded packets |
| A | 0 | 18 | 0 |
| B | 0 | 18 | 0 |
| C | 0 | 18 | 0 |
| D | 0 | 18 | 0 |
| Mode M0 | |||
|---|---|---|---|
| Quadrant | BADHDUFLAG | Total packets | Discarded packets |
| A | 0 | 6222 | 2 |
| B | 0 | 9463 | 1 |
| C | 0 | 6938 | 1 |
| D | 0 | 6901 | 1 |
| Quadrant | Total seconds | Saturated seconds | Saturation percentage |
|---|---|---|---|
| A | 2948 | 5 | 0.169607% |
| B | 2948 | 451 | 15.298507% |
| C | 2948 | 107 | 3.629579% |
| D | 2948 | 19 | 0.644505% |
Noise dominated data is calculated using 1-second bins in cleaned event files. If a bin has >2000 counts, and if more than 50% of those come from <1% of pixels, then it is considered to be noise-dominated and hence unusable.
| Quadrant | # 1 sec bins | Bins with >0 counts | Bins with >2000 counts | High rate bins dominated by noise | Noise dominated (total time) | Noise dominated (detector-on time) | Marked lightcurve |
|---|---|---|---|---|---|---|---|
| A | 4770 | 2949 | 0 | 0 | 0.00% | 0.00% | 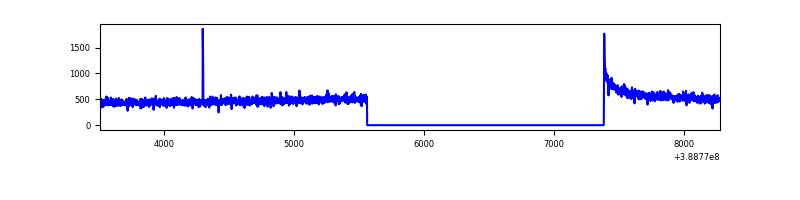 |
| B | 4770 | 2949 | 325 | 325 | 6.81% | 11.02% | 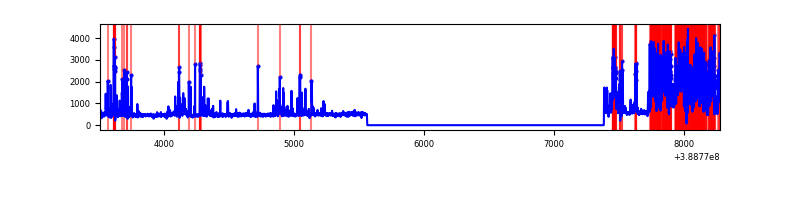 |
| C | 4770 | 2949 | 73 | 73 | 1.53% | 2.48% | 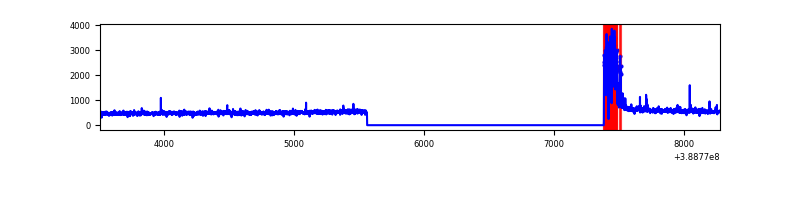 |
| D | 4770 | 2949 | 15 | 15 | 0.31% | 0.51% | 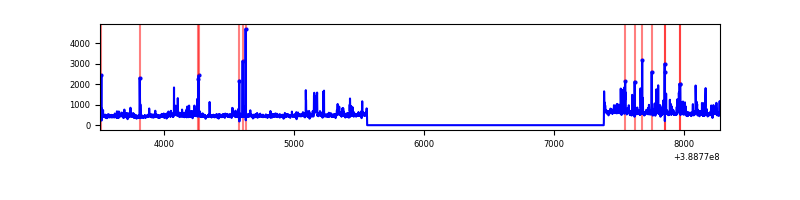 |
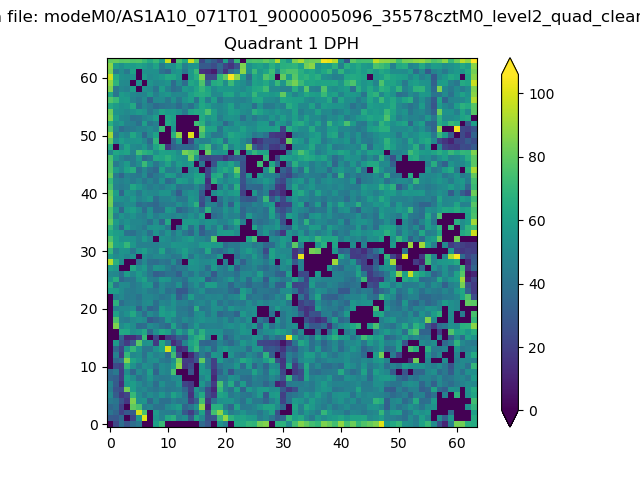
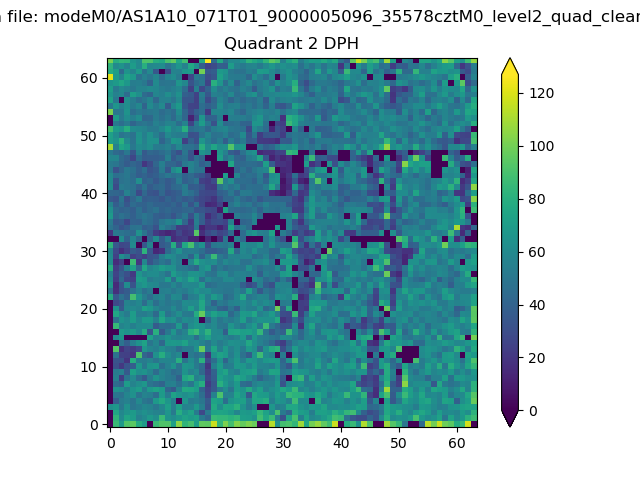
Top three noisy pixels from each quadrant. If the there are fewer than three noisy pixels in the level2.evt file, extra rows are filled as -1
| Pixel properties | Quadrant properties | ||||||
|---|---|---|---|---|---|---|---|
| Quadrant | DetID | PixID | Counts | Sigma | Mean | Median | Sigma |
| A | 10 | 83 | 72982 | 989.11 | 360 | 355 | 73.4 |
| A | 9 | 143 | 5976 | 76.55 | 360 | 355 | 73.4 |
| A | 13 | 6 | 4818 | 60.78 | 360 | 355 | 73.4 |
| B | 5 | 172 | 1234457 | 18750.52 | 332 | 323 | 65.8 |
| B | 12 | 111 | 7899 | 115.1 | 332 | 323 | 65.8 |
| B | 11 | 111 | 7098 | 102.93 | 332 | 323 | 65.8 |
| C | 0 | 10 | 268689 | 3305.27 | 345 | 348 | 81.2 |
| C | 15 | 214 | 120613 | 1481.35 | 345 | 348 | 81.2 |
| C | 14 | 67 | 11707 | 139.91 | 345 | 348 | 81.2 |
| D | 12 | 233 | 62649 | 724.34 | 349 | 340 | 86.0 |
| D | 7 | 80 | 61012 | 705.31 | 349 | 340 | 86.0 |
| D | 13 | 249 | 57680 | 666.57 | 349 | 340 | 86.0 |
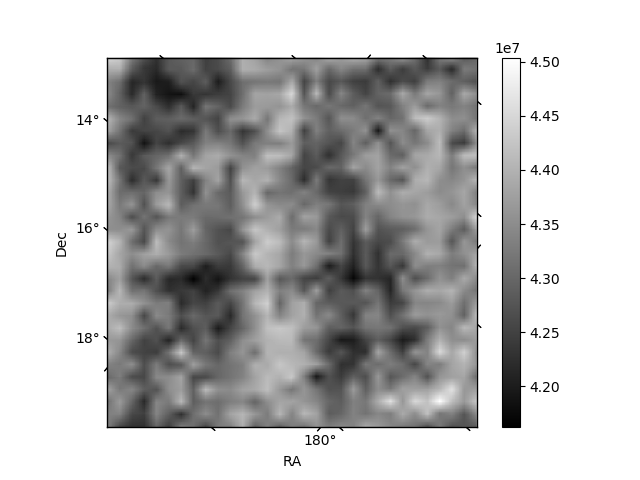
Histogram calculated using DETX and DETY for each event in the final _common_clean file
| Quadrant A | 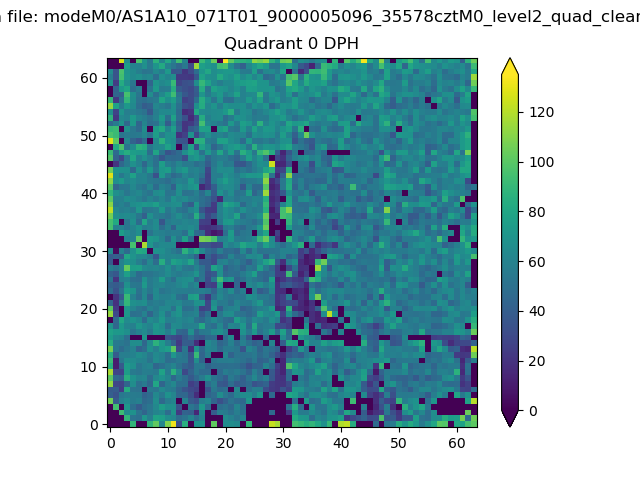 |
 |
Quadrant B |
|---|---|---|---|
| Quadrant D | 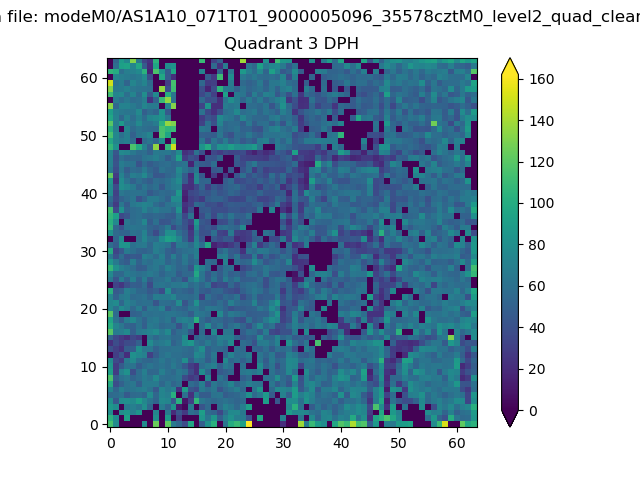 |
 |
Quadrant C |
| Plot type | Count rate plots | Images |
|---|---|---|
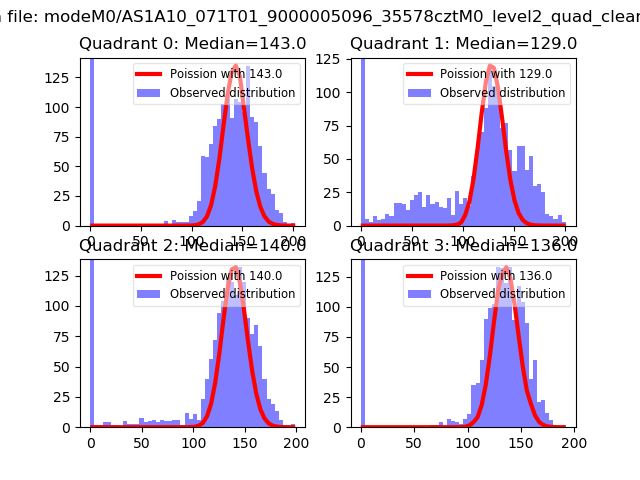
| Comparison with Poisson distribution Blue bars denote a histogram of data divided into 1 sec bins. Red curve is a Poisson curve with rate = median count rate of data. |
 |
 |
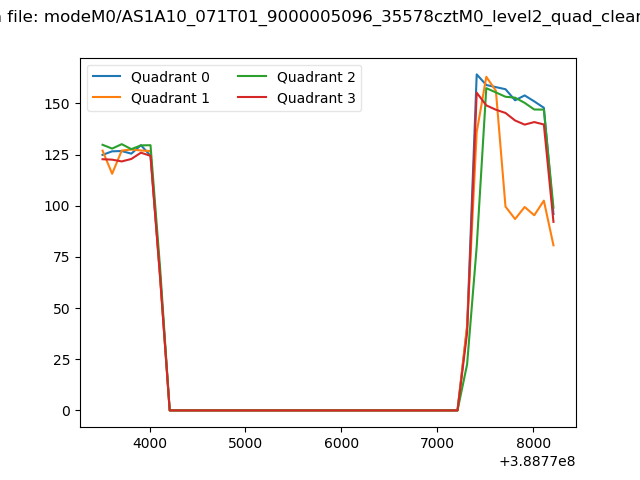
| Quadrant-wise count rates Data is divided into 100 sec bins |
 |
|
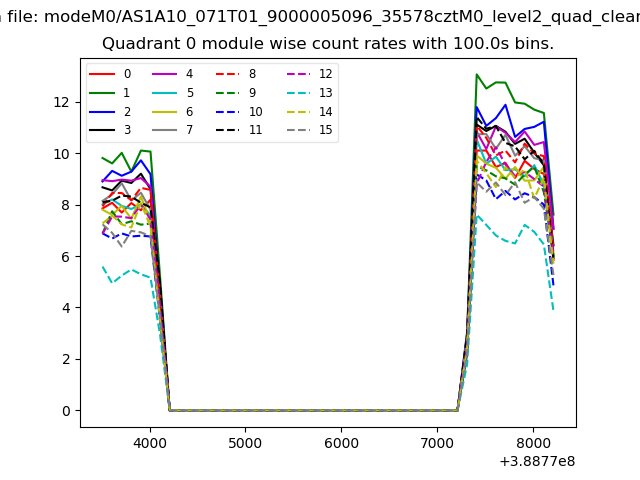
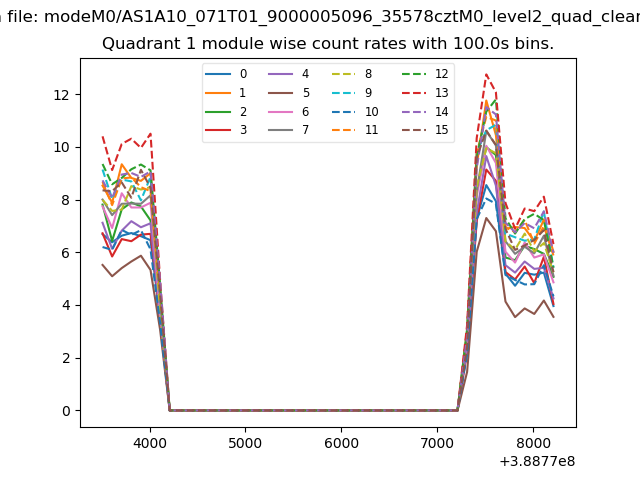
| Module-wise count rates for Quadrant A Data is divided into 100 sec bins |
 |
 |
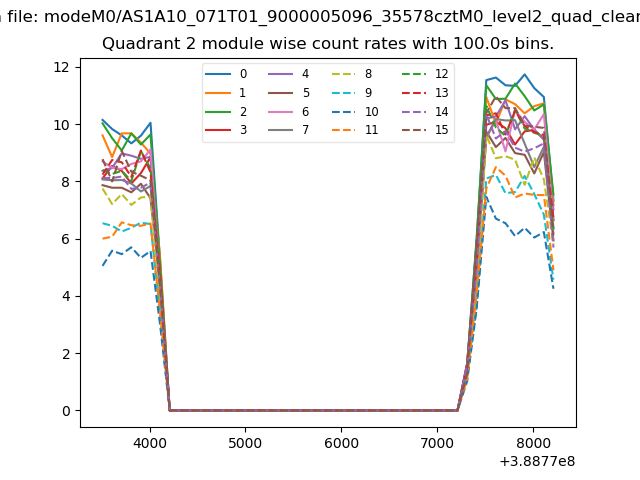
| Module-wise count rates for Quadrant B Data is divided into 100 sec bins |
 |
 |
| Module-wise count rates for Quadrant C Data is divided into 100 sec bins |
 |
 |
| Module-wise count rates for Quadrant D Data is divided into 100 sec bins |
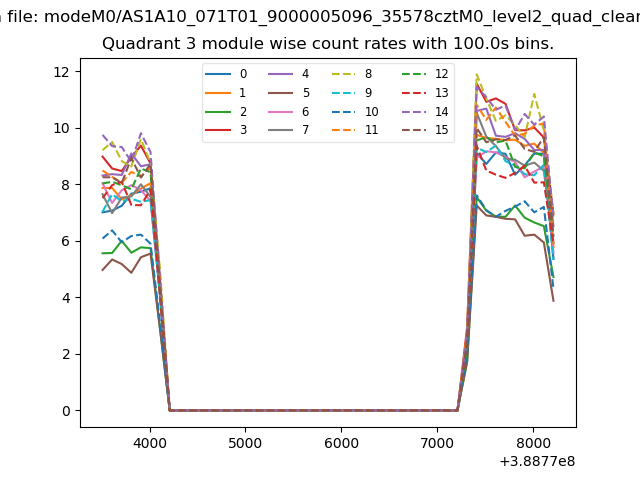 |
 |
| Parameter | Plot |
|---|---|
| CZT HV Monitor | 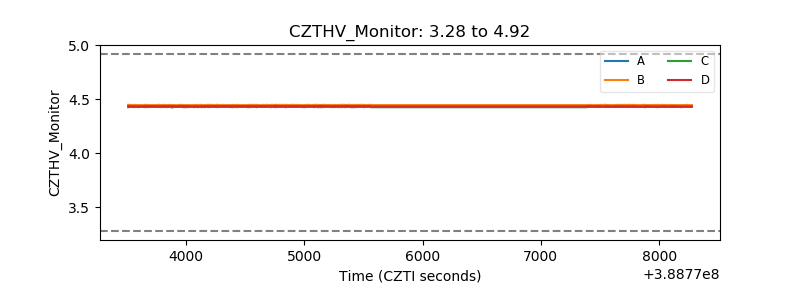 |
| D_VDD | 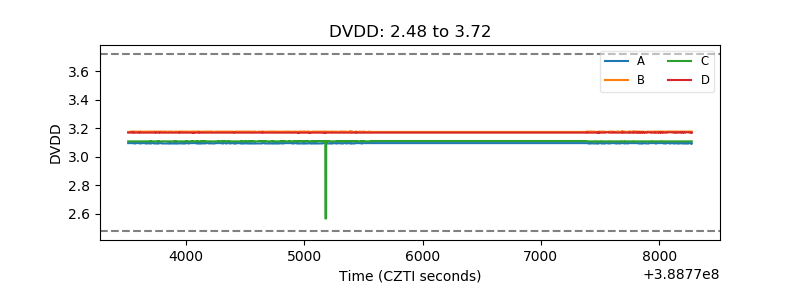 |
| Temperature 1 | 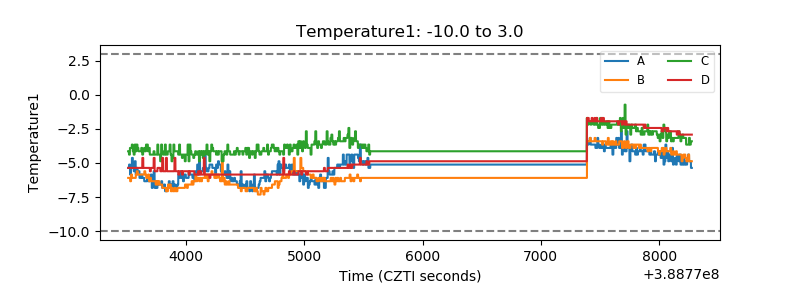 |
| Veto HV Monitor | 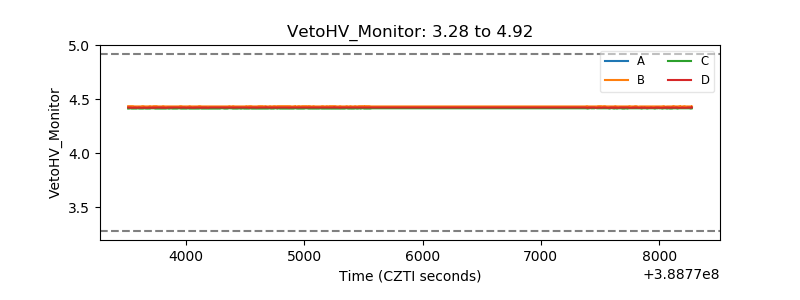 |
| Veto LLD | 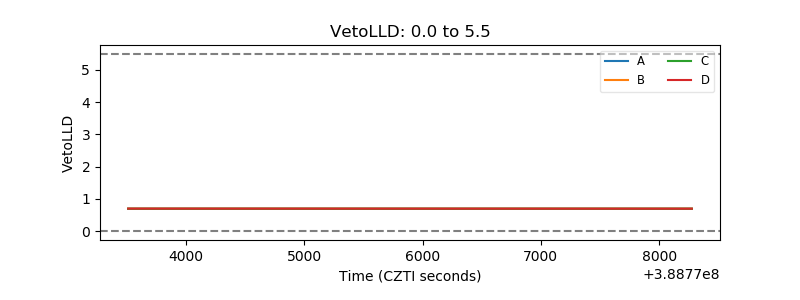 |
| Alpha Counter | 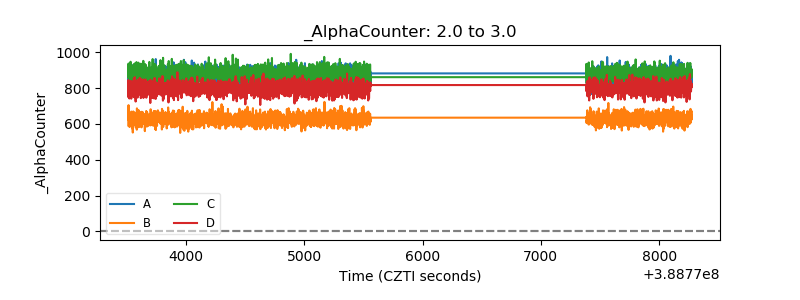 |
| _CPM_Rate | 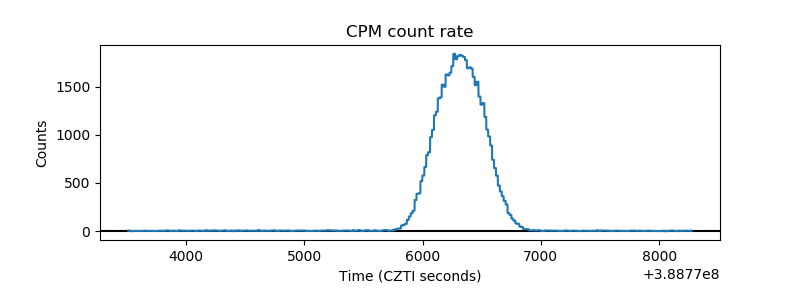 |
| CZT Counter |  |
| +2.5 Volts monitor |  |
| +5 Volts monitor |  |
| _ROLL_ROT | 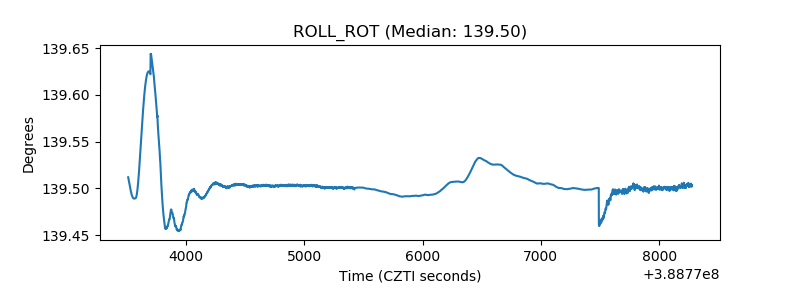 |
| _Roll_DEC | 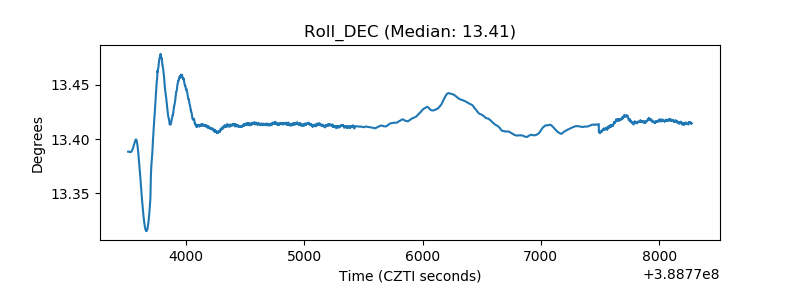 |
| _Roll_RA |  |
| Veto Counter | 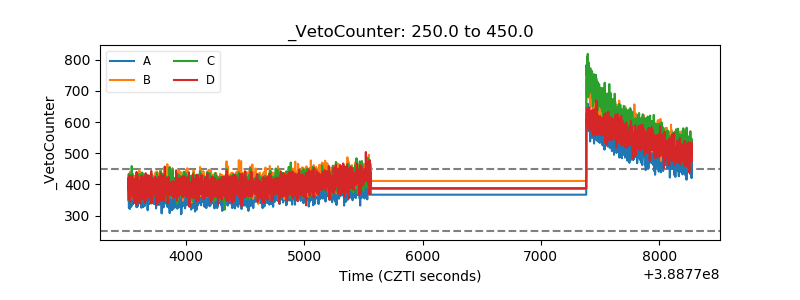 |