| Param | Original file | Final file |
|---|---|---|
| Filename | modeM0/AS1A11_065T21_9000005094cztM0_level2.fits | modeM0/AS1A11_065T21_9000005094cztM0_level2_quad_clean.evt |
| Size (bytes) | 144,365,760 | 150,857,280 |
| Size | 137.7 MB | 143.9 MB |
| Events in quadrant A | 867,586 | 914,784 |
| Events in quadrant B | 798,292 | 874,031 |
| Events in quadrant C | 858,468 | 890,781 |
| Events in quadrant D | 735,574 | 777,485 |
| Mode M0 | |||
|---|---|---|---|
| Quadrant | BADHDUFLAG | Total packets | Discarded packets |
| A | 0 | 35094 | 0 |
| B | 0 | 46961 | 0 |
| C | 0 | 37169 | 0 |
| D | 0 | 44869 | 0 |
| Mode M9 | |||
|---|---|---|---|
| Quadrant | BADHDUFLAG | Total packets | Discarded packets |
| A | 0 | 62 | 0 |
| B | 0 | 62 | 0 |
| C | 0 | 62 | 0 |
| D | 0 | 62 | 0 |
| Mode SS | |||
|---|---|---|---|
| Quadrant | BADHDUFLAG | Total packets | Discarded packets |
| A | 0 | 330 | 0 |
| B | 0 | 330 | 0 |
| C | 0 | 330 | 0 |
| D | 0 | 330 | 0 |
| Quadrant | Total seconds | Saturated seconds | Saturation percentage |
|---|---|---|---|
| A | 16108 | 360 | 2.234914% |
| B | 16108 | 1700 | 10.553762% |
| C | 16108 | 310 | 1.924510% |
| D | 16108 | 878 | 5.450708% |
Noise dominated data is calculated using 1-second bins in cleaned event files. If a bin has >2000 counts, and if more than 50% of those come from <1% of pixels, then it is considered to be noise-dominated and hence unusable.
| Quadrant | # 1 sec bins | Bins with >0 counts | Bins with >2000 counts | High rate bins dominated by noise | Noise dominated (total time) | Noise dominated (detector-on time) | Marked lightcurve |
|---|---|---|---|---|---|---|---|
| A | 22289 | 16095 | 0 | 0 | 0.00% | 0.00% |  |
| B | 22289 | 16100 | 0 | 0 | 0.00% | 0.00% |  |
| C | 22289 | 16101 | 0 | 0 | 0.00% | 0.00% | 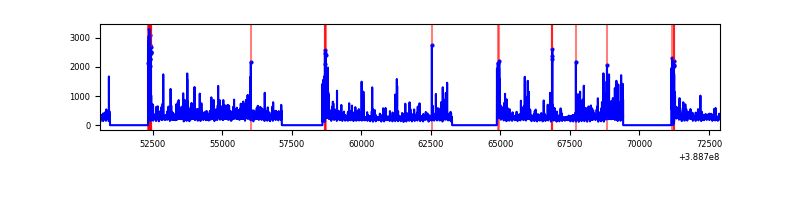 |
| D | 22289 | 16098 | 0 | 0 | 0.00% | 0.00% |  |
Top three noisy pixels from each quadrant. If the there are fewer than three noisy pixels in the level2.evt file, extra rows are filled as -1
| Pixel properties | Quadrant properties | ||||||
|---|---|---|---|---|---|---|---|
| Quadrant | DetID | PixID | Counts | Sigma | Mean | Median | Sigma |
| A | 7 | 110 | 760 | 9.42 | 226 | 214 | 58.0 |
| A | 9 | 19 | 753 | 9.3 | 226 | 214 | 58.0 |
| A | 0 | 29 | 714 | 8.62 | 226 | 214 | 58.0 |
| B | 2 | 9 | 671 | 10.89 | 211 | 202 | 43.1 |
| B | 3 | 80 | 641 | 10.2 | 211 | 202 | 43.1 |
| B | 2 | 8 | 591 | 9.03 | 211 | 202 | 43.1 |
| C | 3 | 187 | 583 | 6.09 | 227 | 213 | 60.7 |
| C | 2 | 31 | 559 | 5.7 | 227 | 213 | 60.7 |
| C | 12 | 241 | 555 | 5.63 | 227 | 213 | 60.7 |
| D | 10 | 113 | 566 | 6.6 | 209 | 191 | 56.8 |
| D | 6 | 62 | 554 | 6.39 | 209 | 191 | 56.8 |
| D | 7 | 3 | 543 | 6.19 | 209 | 191 | 56.8 |
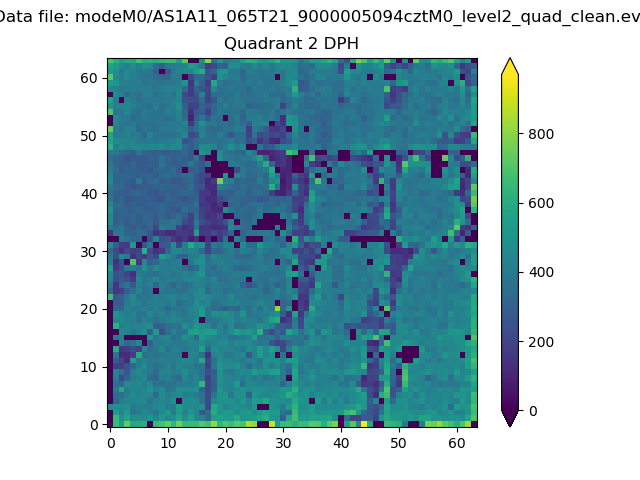
Histogram calculated using DETX and DETY for each event in the final _common_clean file
| Quadrant A |  |
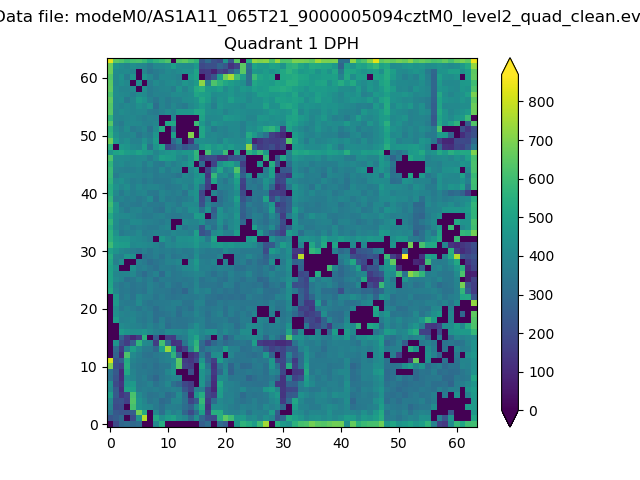 |
Quadrant B |
|---|---|---|---|
| Quadrant D | 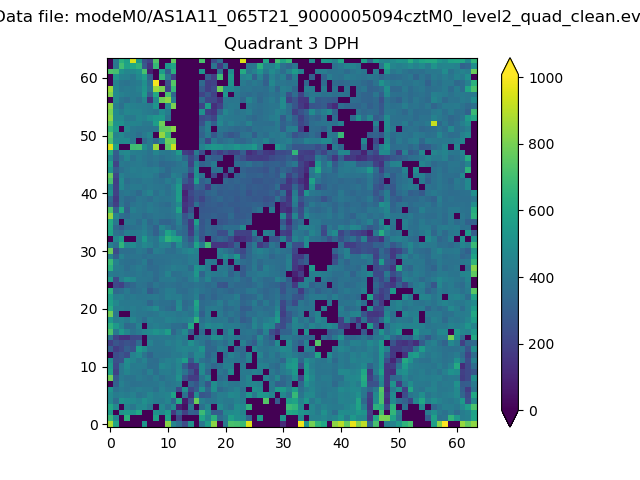 |
 |
Quadrant C |
| Plot type | Count rate plots | Images |
|---|---|---|
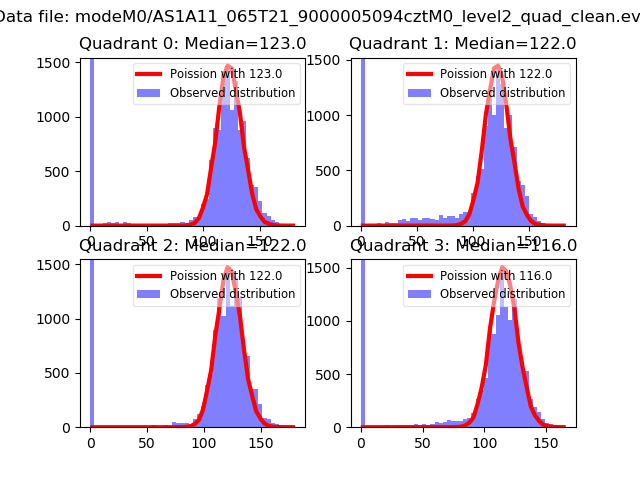
| Comparison with Poisson distribution Blue bars denote a histogram of data divided into 1 sec bins. Red curve is a Poisson curve with rate = median count rate of data. |
 |
 |
| Quadrant-wise count rates Data is divided into 100 sec bins |
 |
|
| Module-wise count rates for Quadrant A Data is divided into 100 sec bins |
 |
 |
| Module-wise count rates for Quadrant B Data is divided into 100 sec bins |
 |
 |
| Module-wise count rates for Quadrant C Data is divided into 100 sec bins |
 |
 |
| Module-wise count rates for Quadrant D Data is divided into 100 sec bins |
 |
 |
| Parameter | Plot |
|---|---|
| CZT HV Monitor |  |
| D_VDD |  |
| Temperature 1 |  |
| Veto HV Monitor |  |
| Veto LLD |  |
| Alpha Counter |  |
| _CPM_Rate |  |
| CZT Counter |  |
| +2.5 Volts monitor | 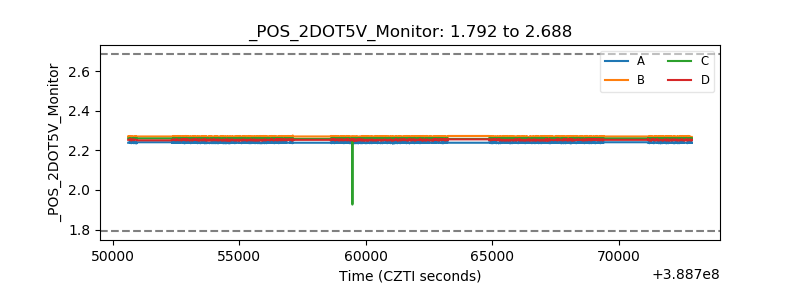 |
| +5 Volts monitor |  |
| _ROLL_ROT |  |
| _Roll_DEC | 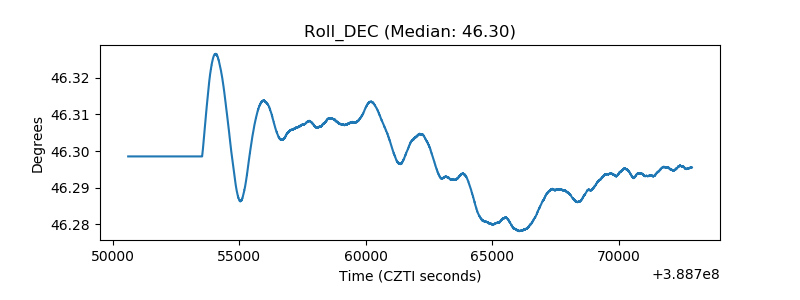 |
| _Roll_RA |  |
| Veto Counter |  |