| Param | Original file | Final file |
|---|---|---|
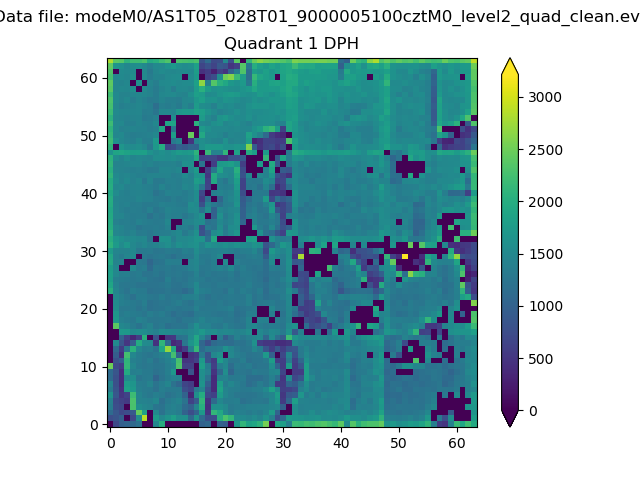
| Filename | modeM0/AS1T05_028T01_9000005100cztM0_level2.fits | modeM0/AS1T05_028T01_9000005100cztM0_level2_quad_clean.evt |
| Size (bytes) | 583,110,720 | 620,280,000 |
| Size | 556.1 MB | 591.5 MB |
| Events in quadrant A | 3,420,480 | 3,479,354 |
| Events in quadrant B | 3,345,466 | 3,789,462 |
| Events in quadrant C | 3,520,506 | 3,758,872 |
| Events in quadrant D | 3,034,280 | 3,426,623 |
| Mode M9 | |||
|---|---|---|---|
| Quadrant | BADHDUFLAG | Total packets | Discarded packets |
| A | 0 | 228 | 0 |
| B | 0 | 228 | 0 |
| C | 0 | 228 | 0 |
| D | 0 | 228 | 0 |
| Mode M0 | |||
|---|---|---|---|
| Quadrant | BADHDUFLAG | Total packets | Discarded packets |
| A | 0 | 188363 | 0 |
| B | 0 | 185218 | 0 |
| C | 0 | 152575 | 0 |
| D | 0 | 162905 | 0 |
| Mode SS | |||
|---|---|---|---|
| Quadrant | BADHDUFLAG | Total packets | Discarded packets |
| A | 0 | 1290 | 0 |
| B | 0 | 1290 | 0 |
| C | 0 | 1289 | 0 |
| D | 0 | 1290 | 0 |
| Quadrant | Total seconds | Saturated seconds | Saturation percentage |
|---|---|---|---|
| A | 63083 | 9289 | 14.725045% |
| B | 63161 | 5737 | 9.083137% |
| C | 63164 | 1570 | 2.485593% |
| D | 63171 | 2095 | 3.316395% |
Noise dominated data is calculated using 1-second bins in cleaned event files. If a bin has >2000 counts, and if more than 50% of those come from <1% of pixels, then it is considered to be noise-dominated and hence unusable.
| Quadrant | # 1 sec bins | Bins with >0 counts | Bins with >2000 counts | High rate bins dominated by noise | Noise dominated (total time) | Noise dominated (detector-on time) | Marked lightcurve |
|---|---|---|---|---|---|---|---|
| A | 85792 | 63182 | 0 | 0 | 0.00% | 0.00% |  |
| B | 85792 | 63165 | 0 | 0 | 0.00% | 0.00% |  |
| C | 85792 | 63167 | 0 | 0 | 0.00% | 0.00% |  |
| D | 85792 | 63202 | 0 | 0 | 0.00% | 0.00% |  |
Top three noisy pixels from each quadrant. If the there are fewer than three noisy pixels in the level2.evt file, extra rows are filled as -1
| Pixel properties | Quadrant properties | ||||||
|---|---|---|---|---|---|---|---|
| Quadrant | DetID | PixID | Counts | Sigma | Mean | Median | Sigma |
| A | 7 | 110 | 2827 | 9.01 | 891 | 838 | 220.7 |
| A | 0 | 29 | 2738 | 8.61 | 891 | 838 | 220.7 |
| A | 9 | 19 | 2694 | 8.41 | 891 | 838 | 220.7 |
| B | 2 | 9 | 2881 | 11.68 | 886 | 846 | 174.2 |
| B | 3 | 80 | 2487 | 9.42 | 886 | 846 | 174.2 |
| B | 2 | 8 | 2339 | 8.57 | 886 | 846 | 174.2 |
| C | 1 | 81 | 2949 | 8.67 | 931 | 874 | 239.4 |
| C | 1 | 80 | 2871 | 8.34 | 931 | 874 | 239.4 |
| C | 3 | 203 | 2836 | 8.19 | 931 | 874 | 239.4 |
| D | 10 | 189 | 2299 | 6.5 | 868 | 792 | 231.7 |
| D | 7 | 3 | 2275 | 6.4 | 868 | 792 | 231.7 |
| D | 3 | 14 | 2261 | 6.34 | 868 | 792 | 231.7 |
Histogram calculated using DETX and DETY for each event in the final _common_clean file
| Quadrant A |  |
 |
Quadrant B |
|---|---|---|---|
| Quadrant D |  |
 |
Quadrant C |
| Plot type | Count rate plots | Images |
|---|---|---|
| Comparison with Poisson distribution Blue bars denote a histogram of data divided into 1 sec bins. Red curve is a Poisson curve with rate = median count rate of data. |
 |
 |
| Quadrant-wise count rates Data is divided into 100 sec bins |
 |
|
| Module-wise count rates for Quadrant A Data is divided into 100 sec bins |
 |
 |
| Module-wise count rates for Quadrant B Data is divided into 100 sec bins |
 |
 |
| Module-wise count rates for Quadrant C Data is divided into 100 sec bins |
 |
 |
| Module-wise count rates for Quadrant D Data is divided into 100 sec bins |
 |
 |
| Parameter | Plot |
|---|---|
| CZT HV Monitor |  |
| D_VDD |  |
| Temperature 1 |  |
| Veto HV Monitor |  |
| Veto LLD |  |
| Alpha Counter |  |
| _CPM_Rate |  |
| CZT Counter |  |
| +2.5 Volts monitor |  |
| +5 Volts monitor |  |
| _ROLL_ROT |  |
| _Roll_DEC |  |
| _Roll_RA |  |
| Veto Counter |  |