| Param | Original file | Final file |
|---|---|---|
| Filename | modeM0/AS1T05_028T01_9000005100_35623cztM0_level2.evt | modeM0/AS1T05_028T01_9000005100_35623cztM0_level2_quad_clean.evt |
| Size (bytes) | 450,498,240 | 98,274,240 |
| Size | 429.6 MB | 93.7 MB |
| Events in quadrant A | 2,794,548 | 670,291 |
| Events in quadrant B | 3,810,637 | 664,879 |
| Events in quadrant C | 3,150,325 | 661,482 |
| Events in quadrant D | 3,535,920 | 616,235 |
| Mode M9 | |||
|---|---|---|---|
| Quadrant | BADHDUFLAG | Total packets | Discarded packets |
| A | 0 | 40 | 0 |
| B | 0 | 40 | 0 |
| C | 0 | 40 | 0 |
| D | 0 | 40 | 0 |
| Mode M0 | |||
|---|---|---|---|
| Quadrant | BADHDUFLAG | Total packets | Discarded packets |
| A | 0 | 11419 | 3 |
| B | 0 | 14566 | 2 |
| C | 0 | 12332 | 2 |
| D | 0 | 13995 | 2 |
| Mode SS | |||
|---|---|---|---|
| Quadrant | BADHDUFLAG | Total packets | Discarded packets |
| A | 0 | 108 | 0 |
| B | 0 | 108 | 0 |
| C | 0 | 108 | 0 |
| D | 0 | 108 | 0 |
| Quadrant | Total seconds | Saturated seconds | Saturation percentage |
|---|---|---|---|
| A | 5182 | 25 | 0.482439% |
| B | 5182 | 381 | 7.352374% |
| C | 5182 | 146 | 2.817445% |
| D | 5182 | 209 | 4.033192% |
Noise dominated data is calculated using 1-second bins in cleaned event files. If a bin has >2000 counts, and if more than 50% of those come from <1% of pixels, then it is considered to be noise-dominated and hence unusable.
| Quadrant | # 1 sec bins | Bins with >0 counts | Bins with >2000 counts | High rate bins dominated by noise | Noise dominated (total time) | Noise dominated (detector-on time) | Marked lightcurve |
|---|---|---|---|---|---|---|---|
| A | 9127 | 5184 | 8 | 8 | 0.09% | 0.15% | 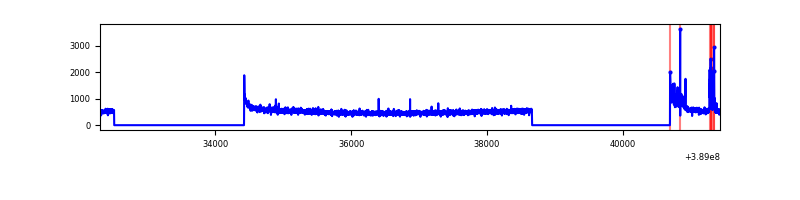 |
| B | 9127 | 5184 | 266 | 266 | 2.91% | 5.13% | 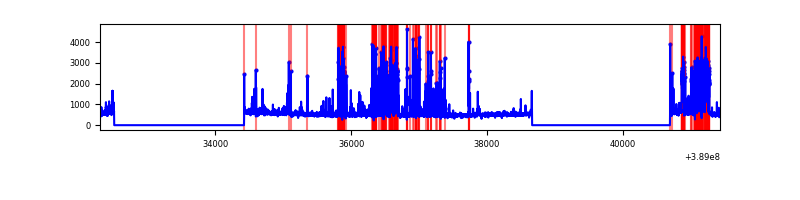 |
| C | 9127 | 5184 | 108 | 108 | 1.18% | 2.08% | 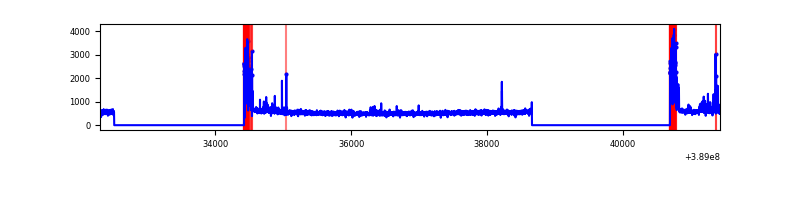 |
| D | 9127 | 5184 | 167 | 167 | 1.83% | 3.22% | 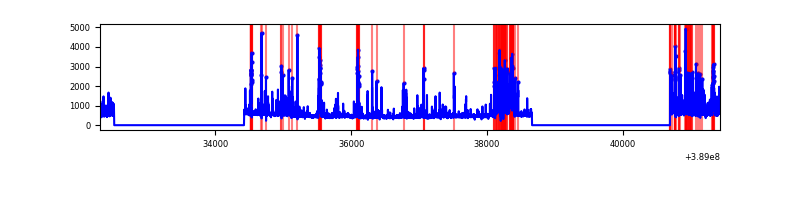 |
Top three noisy pixels from each quadrant. If the there are fewer than three noisy pixels in the level2.evt file, extra rows are filled as -1
| Pixel properties | Quadrant properties | ||||||
|---|---|---|---|---|---|---|---|
| Quadrant | DetID | PixID | Counts | Sigma | Mean | Median | Sigma |
| A | 10 | 83 | 141269 | 1077.04 | 650 | 640 | 130.6 |
| A | 15 | 169 | 126111 | 960.95 | 650 | 640 | 130.6 |
| A | 7 | 3 | 9300 | 66.32 | 650 | 640 | 130.6 |
| B | 5 | 172 | 1209429 | 10198.83 | 634 | 620 | 118.5 |
| B | 0 | 189 | 50233 | 418.59 | 634 | 620 | 118.5 |
| B | 0 | 245 | 22408 | 183.83 | 634 | 620 | 118.5 |
| C | 0 | 10 | 431394 | 2973.38 | 626 | 632 | 144.9 |
| C | 15 | 214 | 213221 | 1467.42 | 626 | 632 | 144.9 |
| C | 9 | 187 | 34863 | 236.28 | 626 | 632 | 144.9 |
| D | 12 | 17 | 438135 | 2921.38 | 619 | 605 | 149.8 |
| D | 2 | 250 | 173540 | 1154.68 | 619 | 605 | 149.8 |
| D | 7 | 80 | 109312 | 725.84 | 619 | 605 | 149.8 |
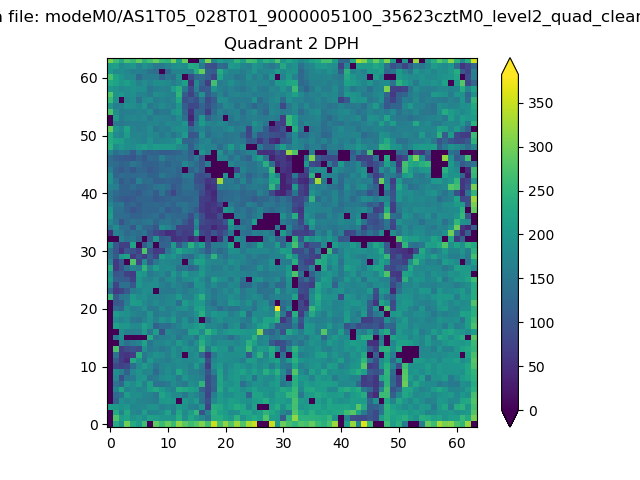
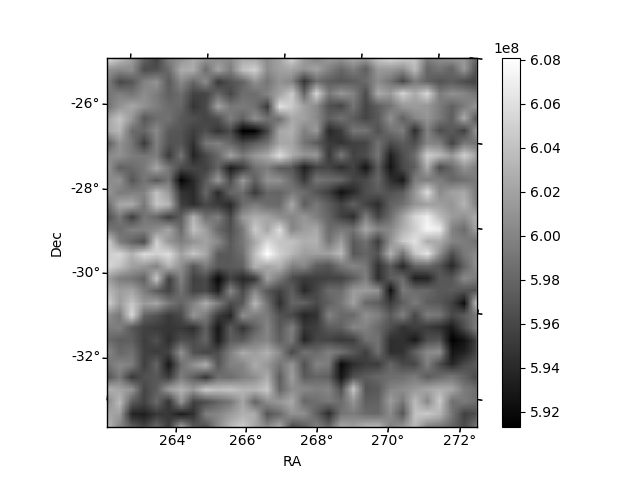
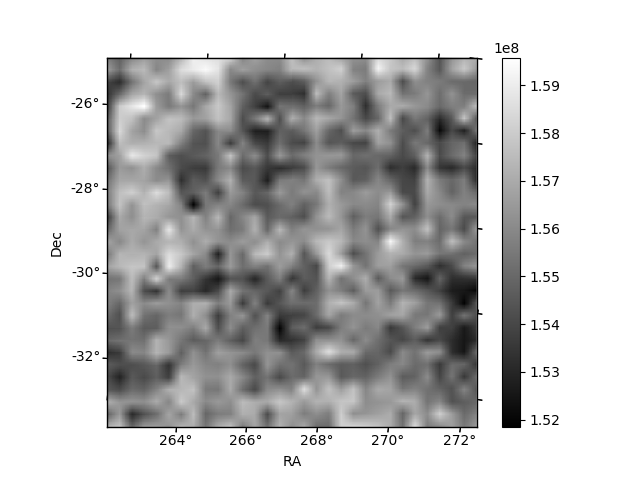
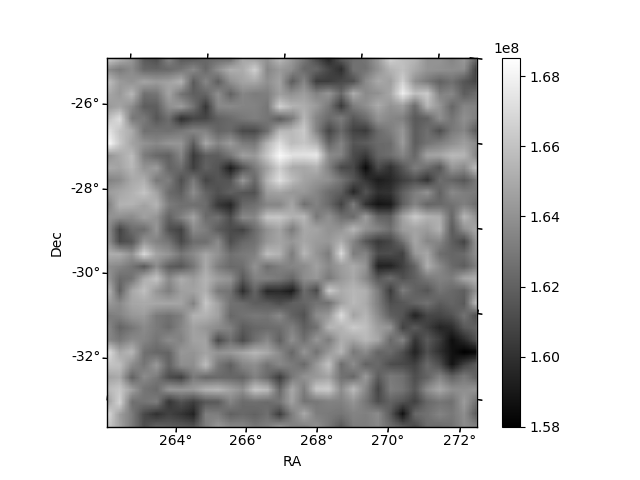
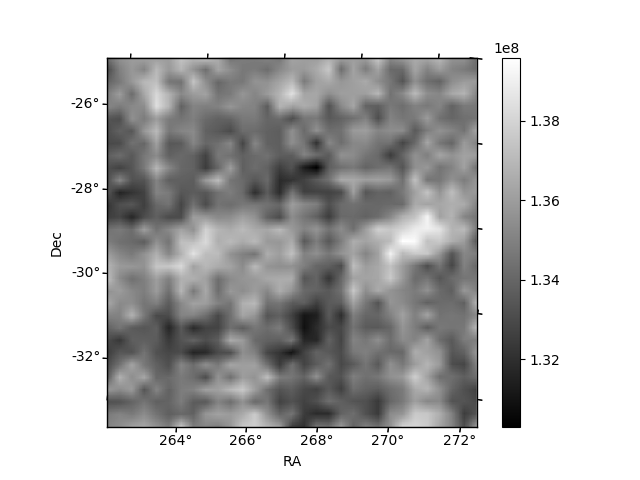
Histogram calculated using DETX and DETY for each event in the final _common_clean file
| Quadrant A | 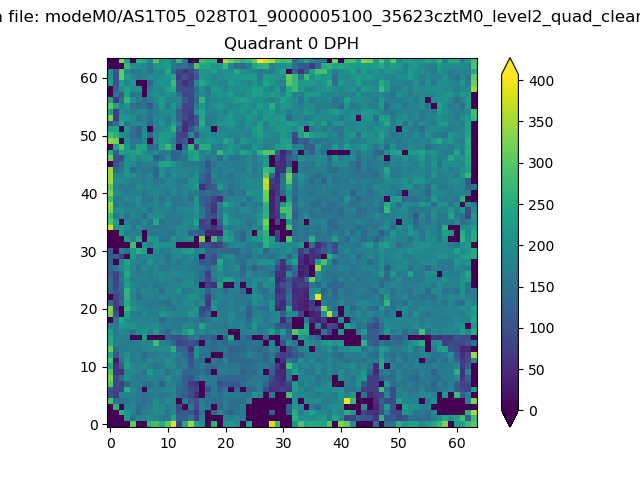 |
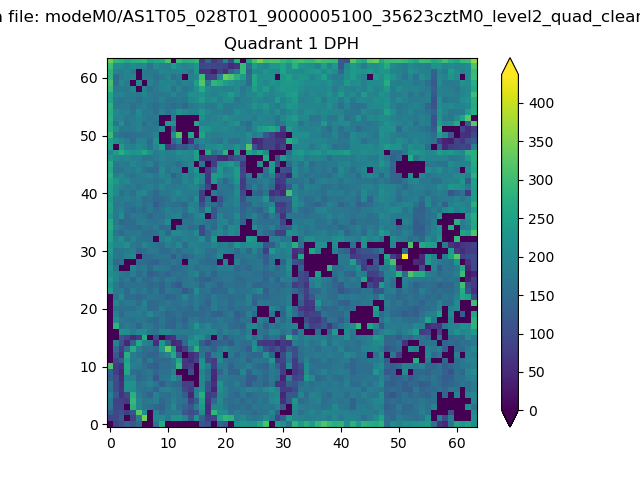 |
Quadrant B |
|---|---|---|---|
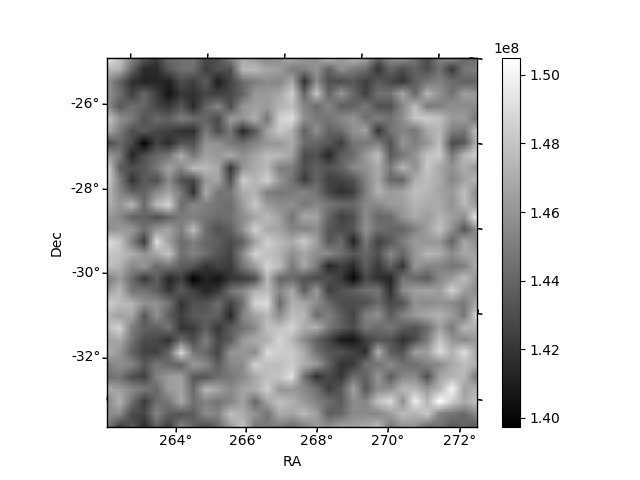
| Quadrant D | 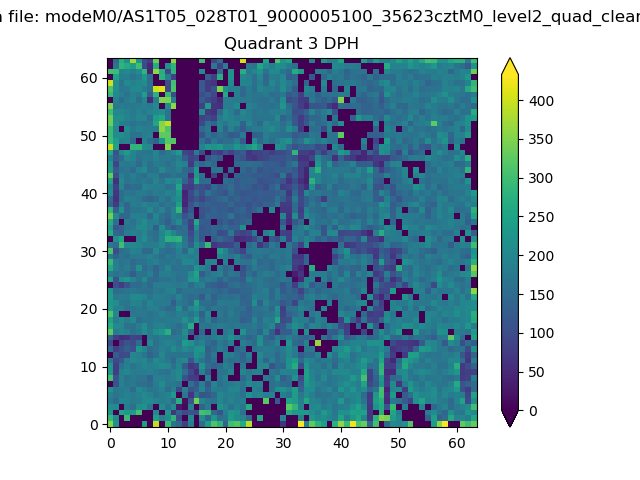 |
 |
Quadrant C |
| Plot type | Count rate plots | Images |
|---|---|---|
| Comparison with Poisson distribution Blue bars denote a histogram of data divided into 1 sec bins. Red curve is a Poisson curve with rate = median count rate of data. |
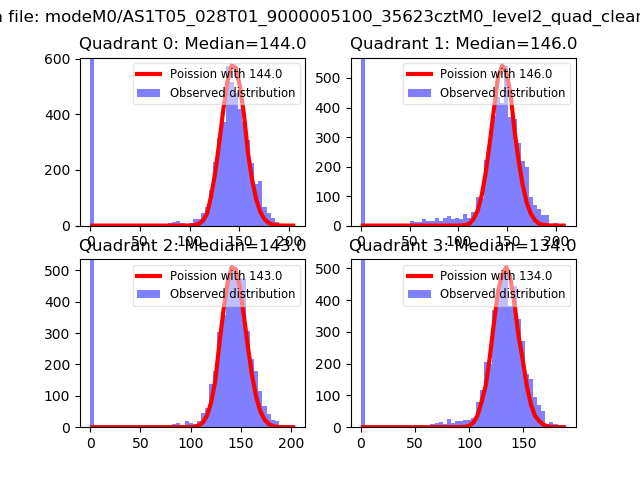 |
 |
| Quadrant-wise count rates Data is divided into 100 sec bins |
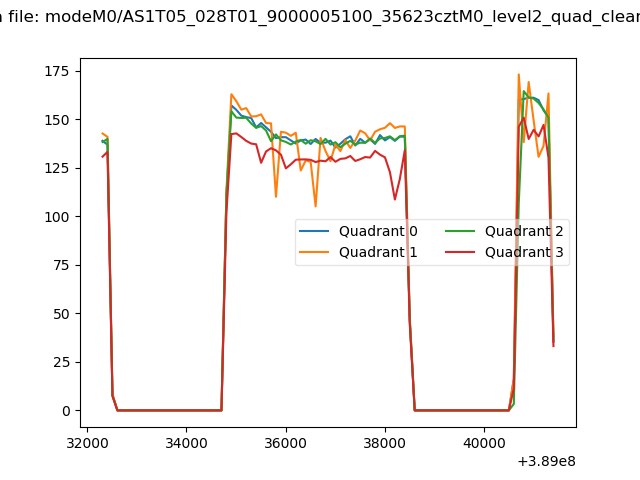 |
|
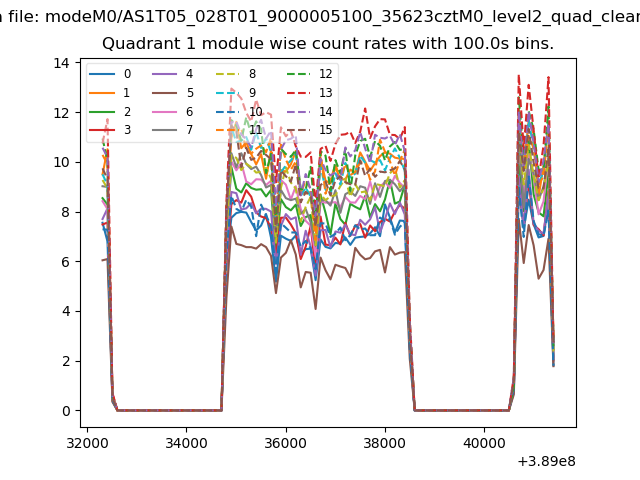
| Module-wise count rates for Quadrant A Data is divided into 100 sec bins |
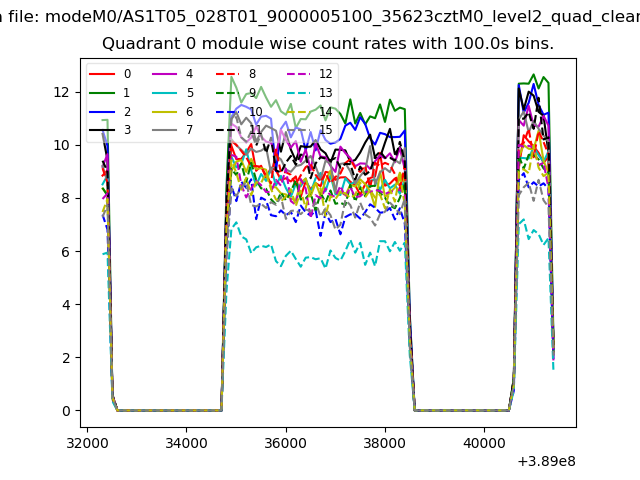 |
 |
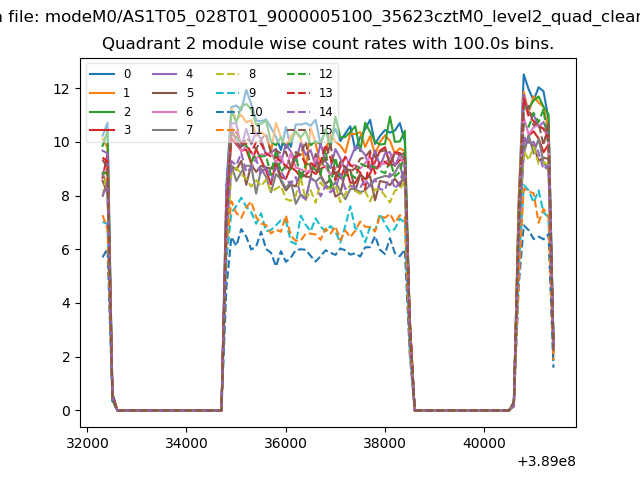
| Module-wise count rates for Quadrant B Data is divided into 100 sec bins |
 |
 |
| Module-wise count rates for Quadrant C Data is divided into 100 sec bins |
 |
 |
| Module-wise count rates for Quadrant D Data is divided into 100 sec bins |
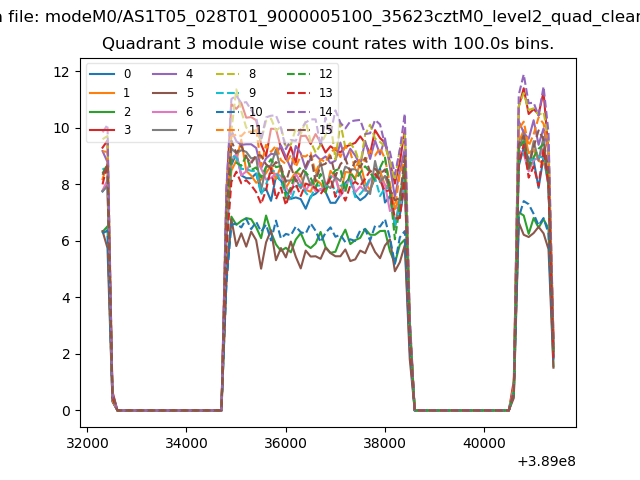 |
 |
| Parameter | Plot |
|---|---|
| CZT HV Monitor | 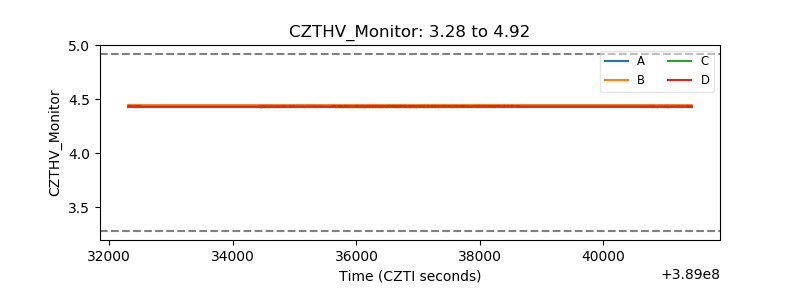 |
| D_VDD | 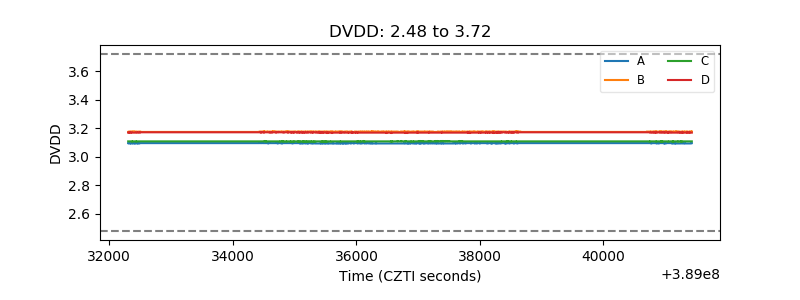 |
| Temperature 1 | 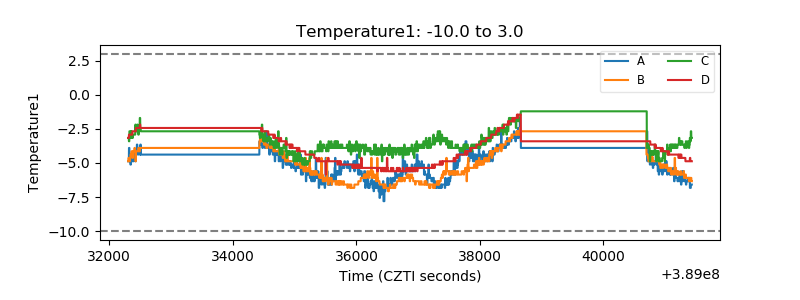 |
| Veto HV Monitor | 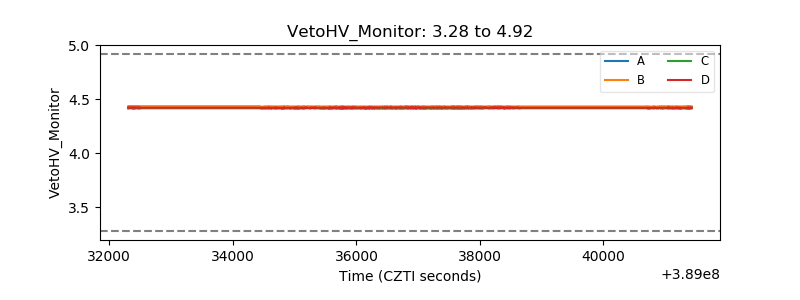 |
| Veto LLD | 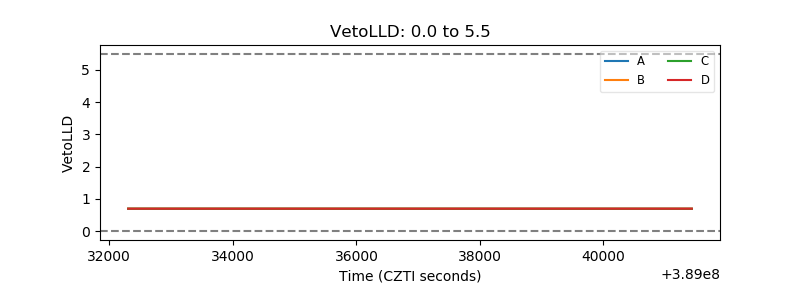 |
| Alpha Counter | 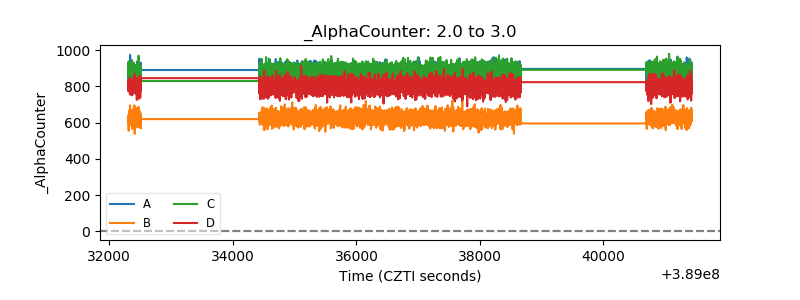 |
| _CPM_Rate | 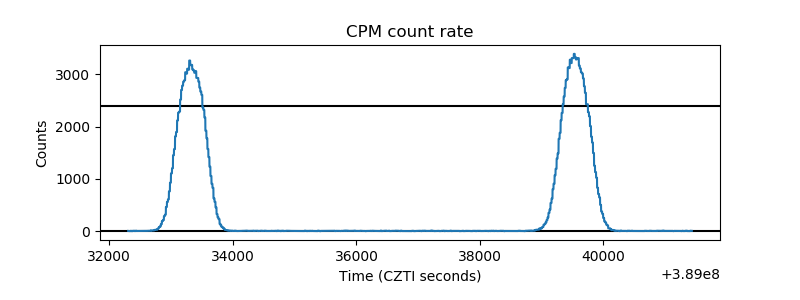 |
| CZT Counter | 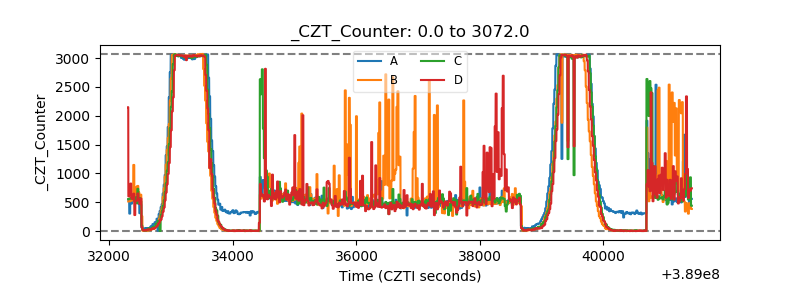 |
| +2.5 Volts monitor |  |
| +5 Volts monitor |  |
| _ROLL_ROT | 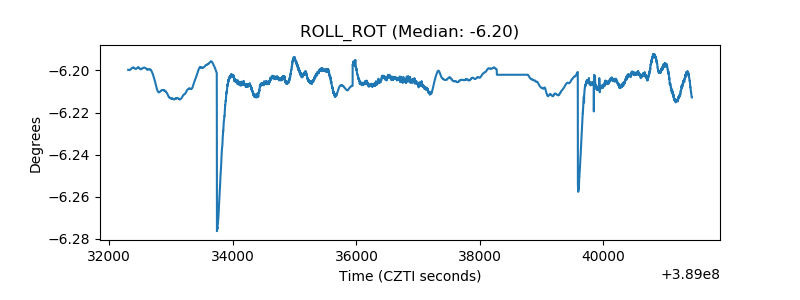 |
| _Roll_DEC | 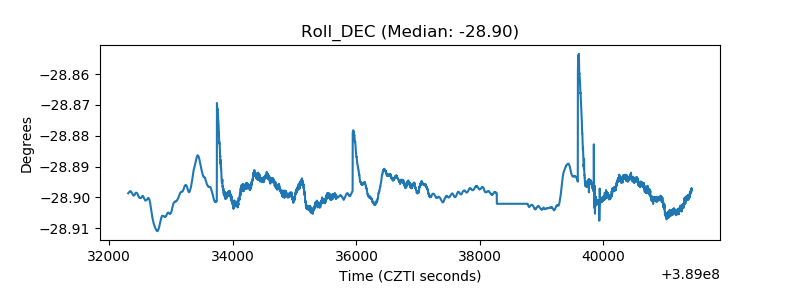 |
| _Roll_RA | 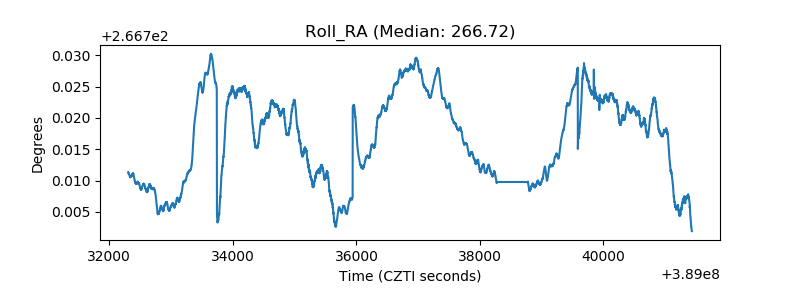 |
| Veto Counter | 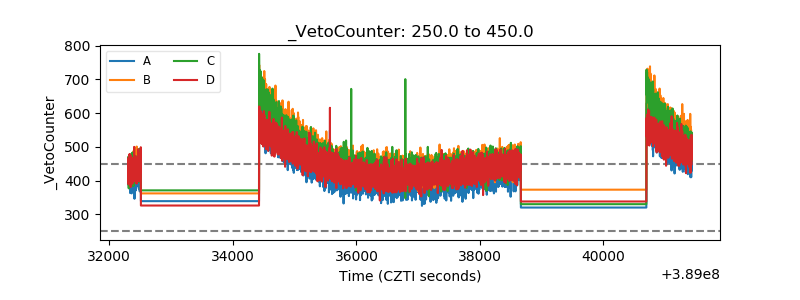 |