| Param | Original file | Final file |
|---|---|---|
| Filename | modeM0/AS1T05_028T01_9000005100_35624cztM0_level2.evt | modeM0/AS1T05_028T01_9000005100_35624cztM0_level2_quad_clean.evt |
| Size (bytes) | 512,164,800 | 94,426,560 |
| Size | 488.4 MB | 90.1 MB |
| Events in quadrant A | 3,499,031 | 646,284 |
| Events in quadrant B | 4,973,719 | 619,961 |
| Events in quadrant C | 3,542,703 | 639,873 |
| Events in quadrant D | 3,159,245 | 605,224 |
| Mode M9 | |||
|---|---|---|---|
| Quadrant | BADHDUFLAG | Total packets | Discarded packets |
| A | 0 | 39 | 0 |
| B | 0 | 39 | 0 |
| C | 0 | 39 | 0 |
| D | 0 | 40 | 0 |
| Mode M0 | |||
|---|---|---|---|
| Quadrant | BADHDUFLAG | Total packets | Discarded packets |
| A | 0 | 13445 | 3 |
| B | 0 | 18016 | 2 |
| C | 0 | 13844 | 2 |
| D | 0 | 12656 | 2 |
| Mode SS | |||
|---|---|---|---|
| Quadrant | BADHDUFLAG | Total packets | Discarded packets |
| A | 0 | 102 | 0 |
| B | 0 | 102 | 0 |
| C | 0 | 102 | 0 |
| D | 0 | 102 | 0 |
| Quadrant | Total seconds | Saturated seconds | Saturation percentage |
|---|---|---|---|
| A | 4959 | 116 | 2.339181% |
| B | 4959 | 900 | 18.148820% |
| C | 4959 | 176 | 3.549103% |
| D | 4959 | 150 | 3.024803% |
Noise dominated data is calculated using 1-second bins in cleaned event files. If a bin has >2000 counts, and if more than 50% of those come from <1% of pixels, then it is considered to be noise-dominated and hence unusable.
| Quadrant | # 1 sec bins | Bins with >0 counts | Bins with >2000 counts | High rate bins dominated by noise | Noise dominated (total time) | Noise dominated (detector-on time) | Marked lightcurve |
|---|---|---|---|---|---|---|---|
| A | 7082 | 4960 | 134 | 134 | 1.89% | 2.70% | 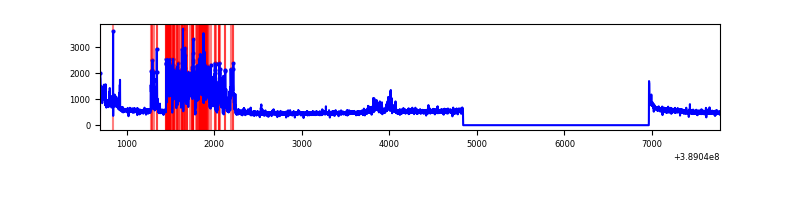 |
| B | 7082 | 4960 | 631 | 631 | 8.91% | 12.72% | 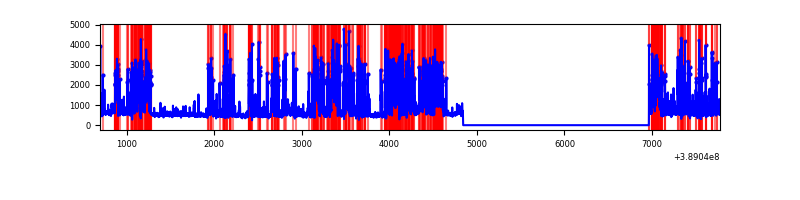 |
| C | 7082 | 4960 | 134 | 134 | 1.89% | 2.70% | 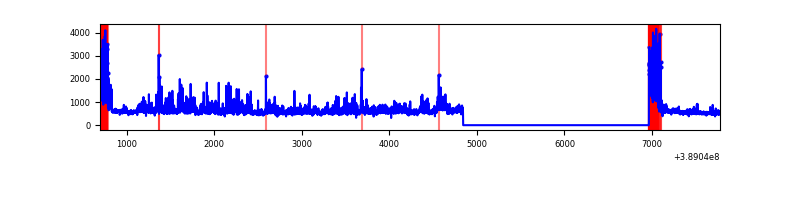 |
| D | 7082 | 4960 | 121 | 121 | 1.71% | 2.44% | 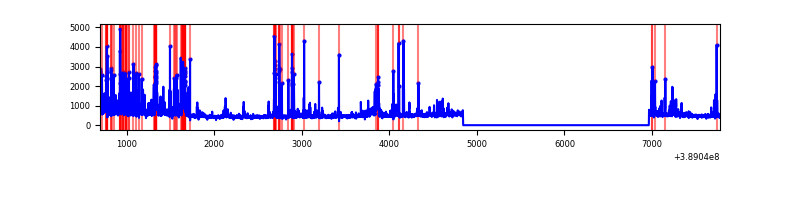 |
Top three noisy pixels from each quadrant. If the there are fewer than three noisy pixels in the level2.evt file, extra rows are filled as -1
| Pixel properties | Quadrant properties | ||||||
|---|---|---|---|---|---|---|---|
| Quadrant | DetID | PixID | Counts | Sigma | Mean | Median | Sigma |
| A | 15 | 169 | 997019 | 8178.66 | 609 | 600 | 121.8 |
| A | 10 | 83 | 135033 | 1103.43 | 609 | 600 | 121.8 |
| A | 13 | 6 | 9679 | 74.52 | 609 | 600 | 121.8 |
| B | 5 | 172 | 2629822 | 24336.7 | 575 | 562 | 108.0 |
| B | 0 | 155 | 36041 | 328.4 | 575 | 562 | 108.0 |
| B | 0 | 245 | 22024 | 198.65 | 575 | 562 | 108.0 |
| C | 0 | 10 | 1008373 | 7332.27 | 594 | 601 | 137.4 |
| C | 15 | 214 | 203225 | 1474.24 | 594 | 601 | 137.4 |
| C | 9 | 187 | 6615 | 43.76 | 594 | 601 | 137.4 |
| D | 12 | 17 | 235706 | 1640.37 | 590 | 576 | 143.3 |
| D | 13 | 249 | 155980 | 1084.16 | 590 | 576 | 143.3 |
| D | 2 | 250 | 139552 | 969.56 | 590 | 576 | 143.3 |
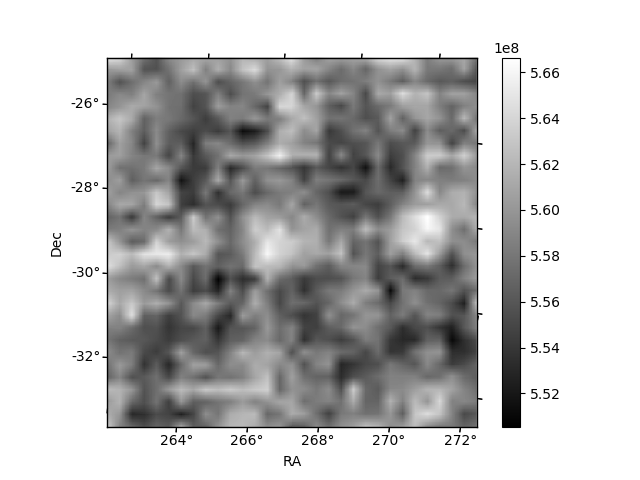
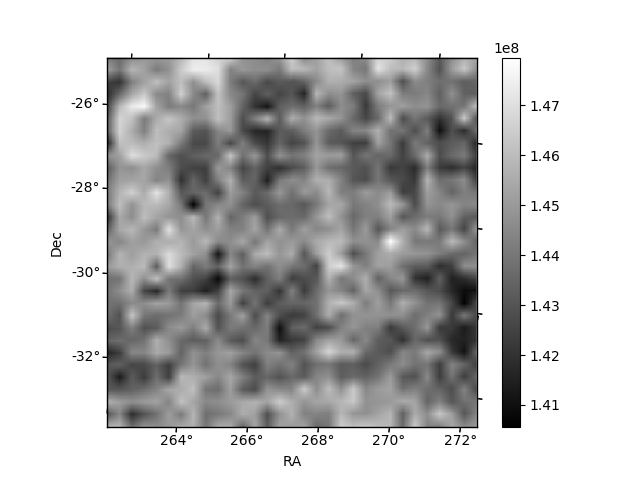
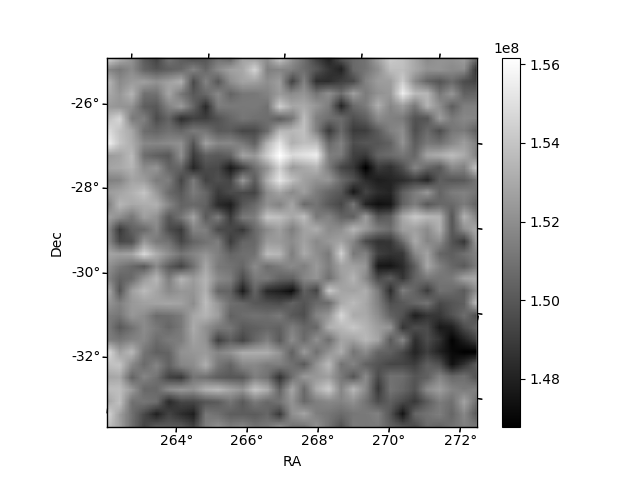
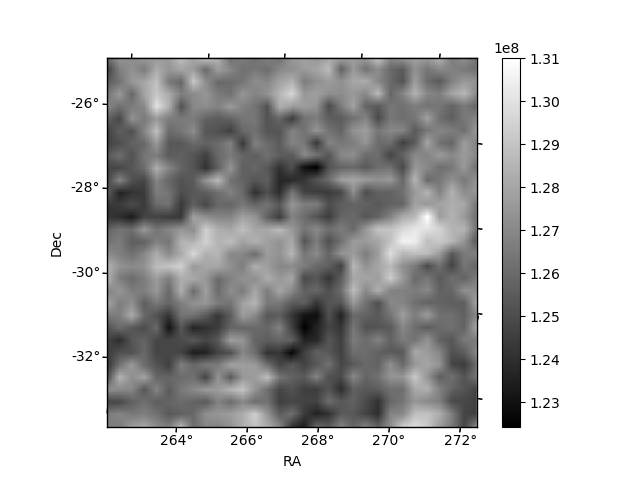
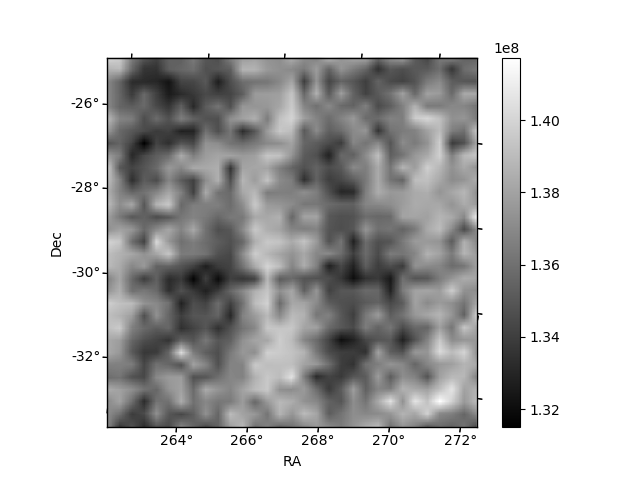
Histogram calculated using DETX and DETY for each event in the final _common_clean file
| Quadrant A | 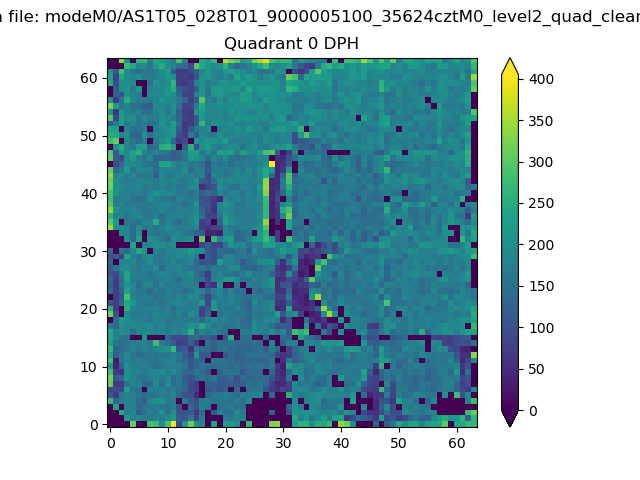 |
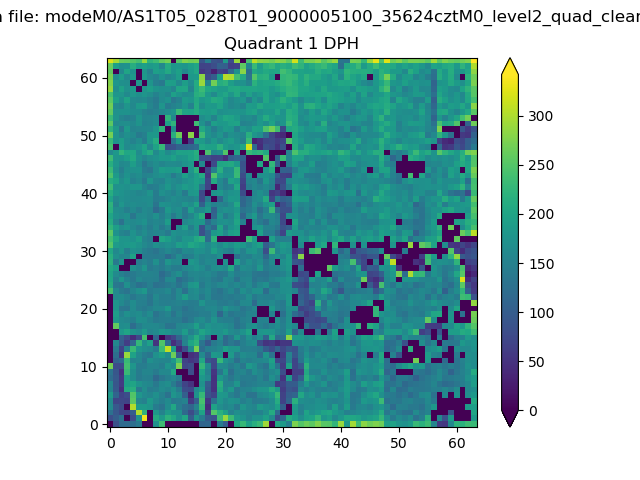 |
Quadrant B |
|---|---|---|---|
| Quadrant D |  |
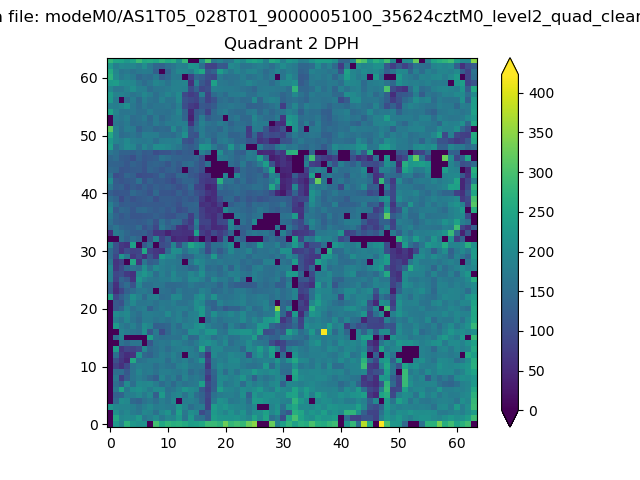 |
Quadrant C |
| Plot type | Count rate plots | Images |
|---|---|---|
| Comparison with Poisson distribution Blue bars denote a histogram of data divided into 1 sec bins. Red curve is a Poisson curve with rate = median count rate of data. |
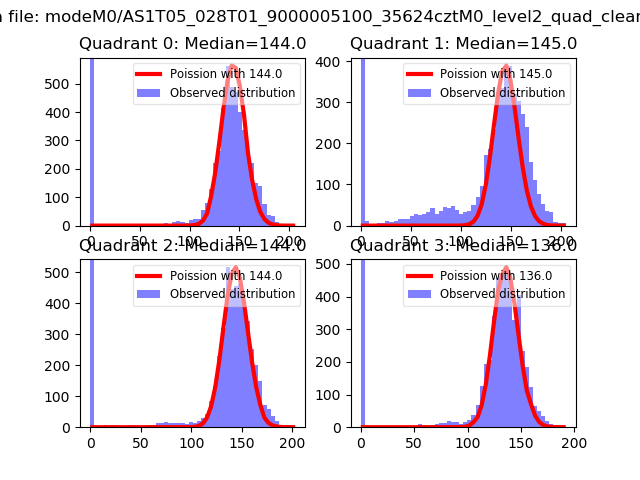 |
 |
| Quadrant-wise count rates Data is divided into 100 sec bins |
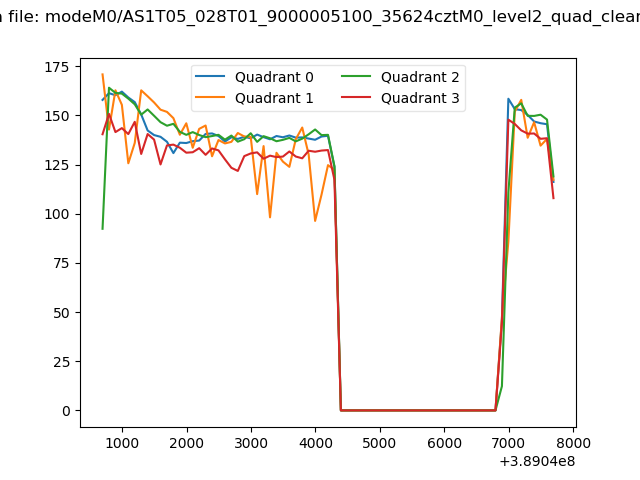 |
|
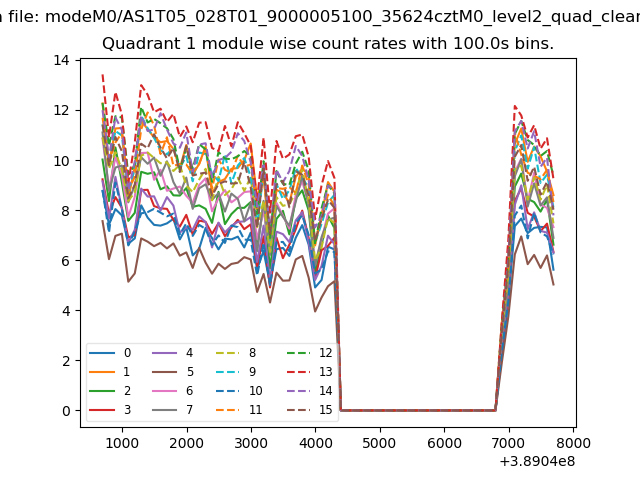
| Module-wise count rates for Quadrant A Data is divided into 100 sec bins |
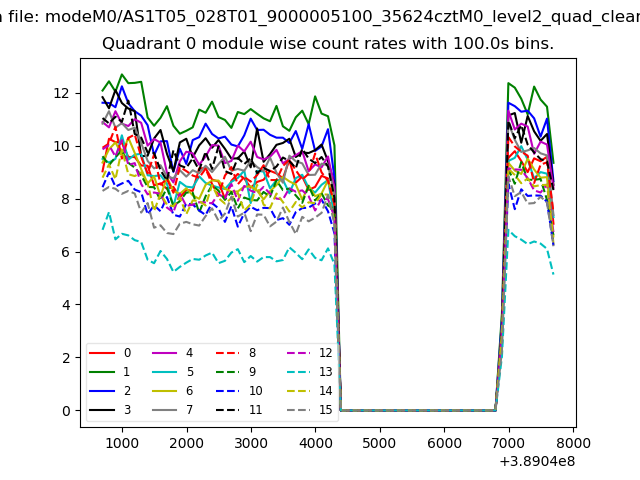 |
 |
| Module-wise count rates for Quadrant B Data is divided into 100 sec bins |
 |
 |
| Module-wise count rates for Quadrant C Data is divided into 100 sec bins |
 |
 |
| Module-wise count rates for Quadrant D Data is divided into 100 sec bins |
 |
 |
| Parameter | Plot |
|---|---|
| CZT HV Monitor | 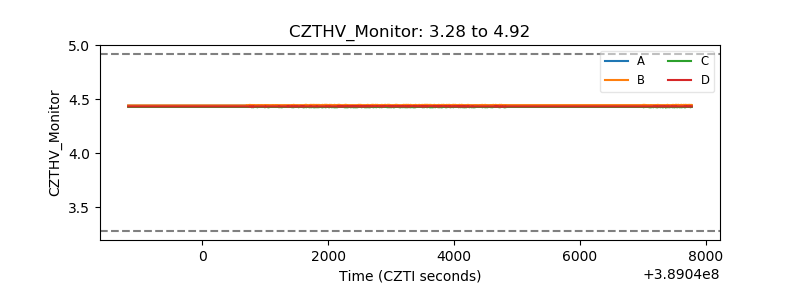 |
| D_VDD | 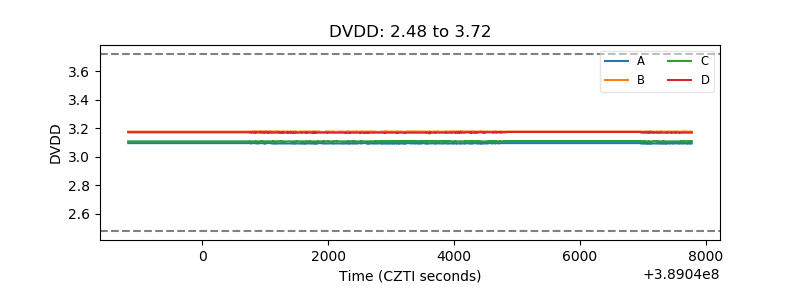 |
| Temperature 1 | 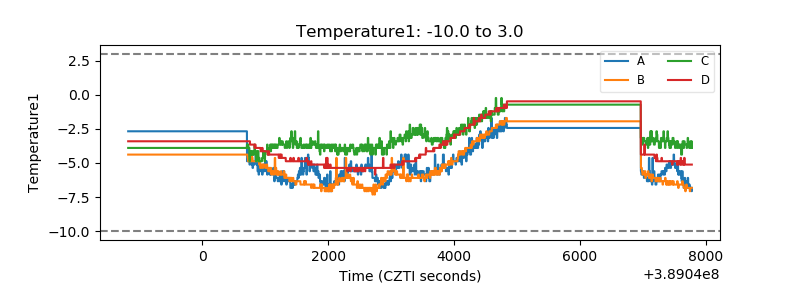 |
| Veto HV Monitor | 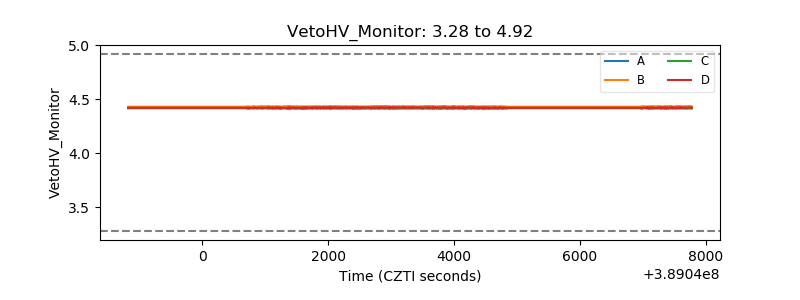 |
| Veto LLD | 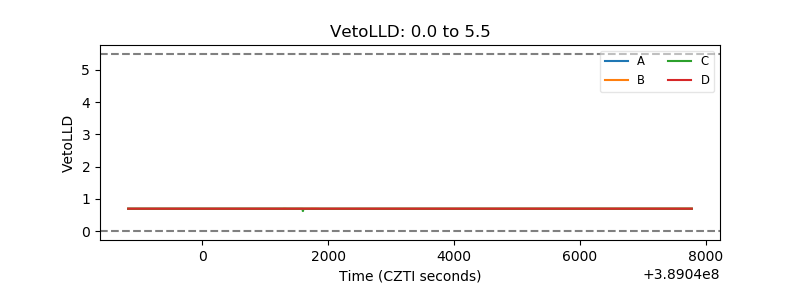 |
| Alpha Counter | 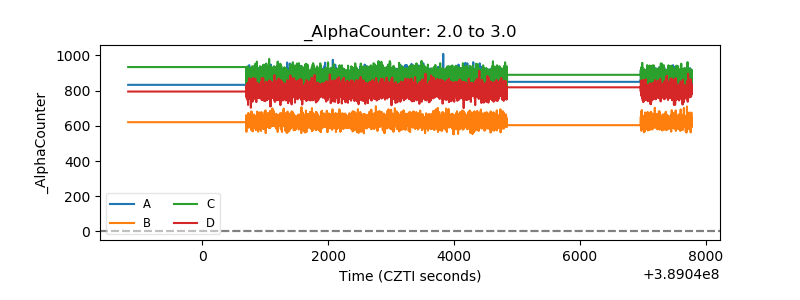 |
| _CPM_Rate | 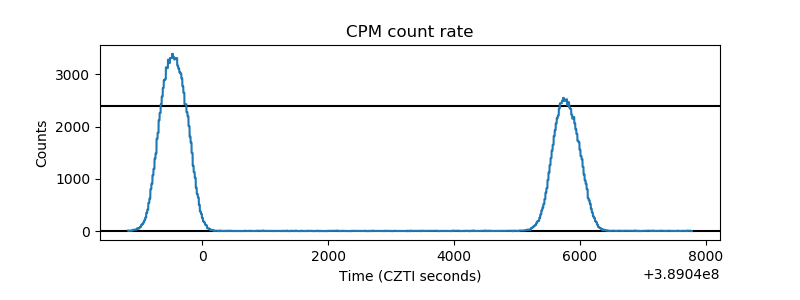 |
| CZT Counter | 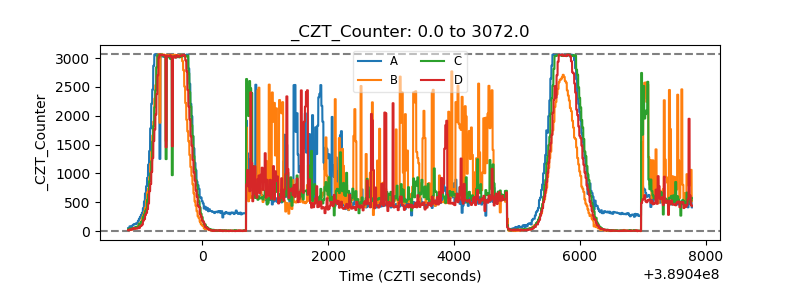 |
| +2.5 Volts monitor |  |
| +5 Volts monitor |  |
| _ROLL_ROT | 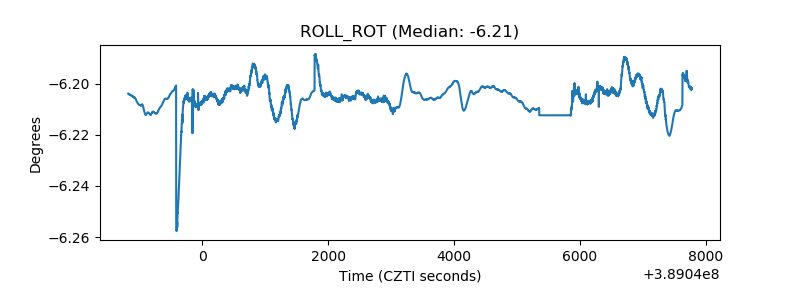 |
| _Roll_DEC | 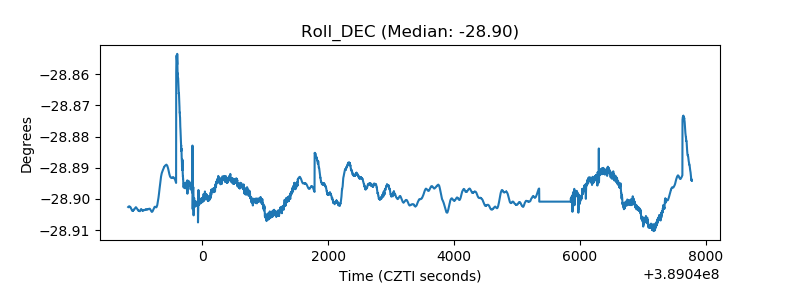 |
| _Roll_RA | 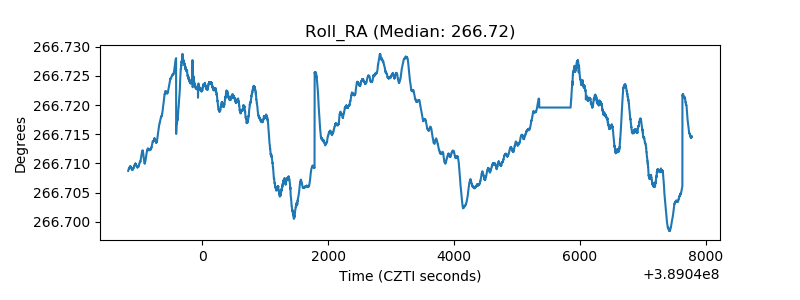 |
| Veto Counter | 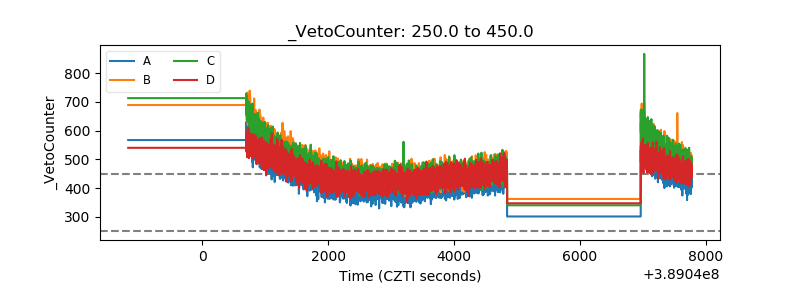 |