| Param | Original file | Final file |
|---|---|---|
| Filename | modeM0/AS1T05_028T01_9000005100_35627cztM0_level2.evt | modeM0/AS1T05_028T01_9000005100_35627cztM0_level2_quad_clean.evt |
| Size (bytes) | 436,599,360 | 62,510,400 |
| Size | 416.4 MB | 59.6 MB |
| Events in quadrant A | 2,516,318 | 391,589 |
| Events in quadrant B | 3,821,607 | 384,337 |
| Events in quadrant C | 3,142,181 | 381,208 |
| Events in quadrant D | 3,390,485 | 372,622 |
| Mode M9 | |||
|---|---|---|---|
| Quadrant | BADHDUFLAG | Total packets | Discarded packets |
| A | 0 | 35 | 0 |
| B | 0 | 35 | 0 |
| C | 0 | 35 | 0 |
| D | 0 | 36 | 0 |
| Mode M0 | |||
|---|---|---|---|
| Quadrant | BADHDUFLAG | Total packets | Discarded packets |
| A | 0 | 10750 | 3 |
| B | 0 | 14721 | 2 |
| C | 0 | 12286 | 2 |
| D | 0 | 13524 | 2 |
| Mode SS | |||
|---|---|---|---|
| Quadrant | BADHDUFLAG | Total packets | Discarded packets |
| A | 0 | 106 | 0 |
| B | 0 | 106 | 0 |
| C | 0 | 106 | 0 |
| D | 0 | 106 | 0 |
| Quadrant | Total seconds | Saturated seconds | Saturation percentage |
|---|---|---|---|
| A | 5175 | 17 | 0.328502% |
| B | 5175 | 352 | 6.801932% |
| C | 5175 | 218 | 4.212560% |
| D | 5175 | 179 | 3.458937% |
Noise dominated data is calculated using 1-second bins in cleaned event files. If a bin has >2000 counts, and if more than 50% of those come from <1% of pixels, then it is considered to be noise-dominated and hence unusable.
| Quadrant | # 1 sec bins | Bins with >0 counts | Bins with >2000 counts | High rate bins dominated by noise | Noise dominated (total time) | Noise dominated (detector-on time) | Marked lightcurve |
|---|---|---|---|---|---|---|---|
| A | 6968 | 5176 | 6 | 6 | 0.09% | 0.12% | 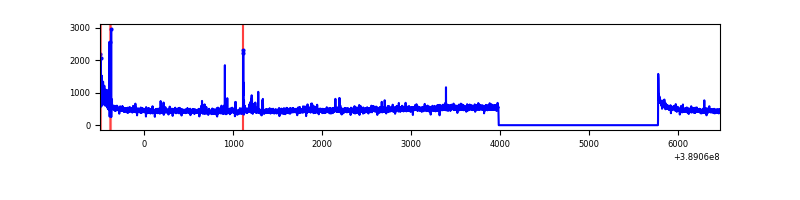 |
| B | 6968 | 5176 | 248 | 248 | 3.56% | 4.79% | 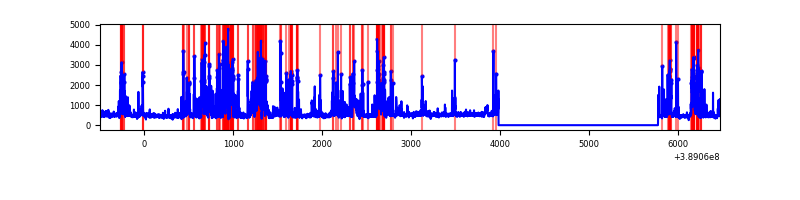 |
| C | 6968 | 5176 | 178 | 178 | 2.55% | 3.44% | 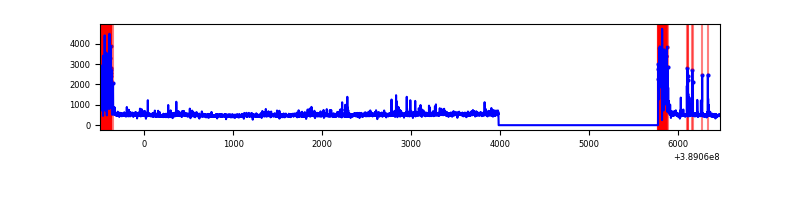 |
| D | 6968 | 5176 | 163 | 163 | 2.34% | 3.15% | 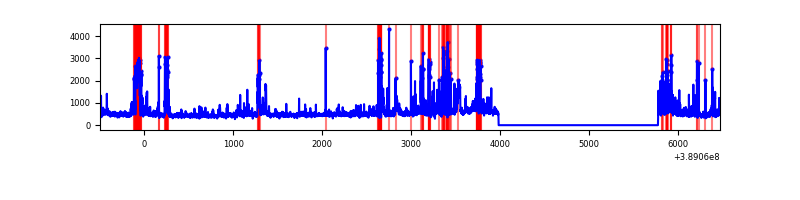 |
Top three noisy pixels from each quadrant. If the there are fewer than three noisy pixels in the level2.evt file, extra rows are filled as -1
| Pixel properties | Quadrant properties | ||||||
|---|---|---|---|---|---|---|---|
| Quadrant | DetID | PixID | Counts | Sigma | Mean | Median | Sigma |
| A | 10 | 83 | 140771 | 1171.93 | 594 | 582 | 119.6 |
| A | 15 | 169 | 48435 | 400.03 | 594 | 582 | 119.6 |
| A | 7 | 3 | 11534 | 91.55 | 594 | 582 | 119.6 |
| B | 5 | 172 | 1457252 | 13063.53 | 581 | 567 | 111.5 |
| B | 0 | 189 | 36168 | 319.27 | 581 | 567 | 111.5 |
| B | 12 | 111 | 13559 | 116.51 | 581 | 567 | 111.5 |
| C | 0 | 10 | 674744 | 5055.56 | 574 | 577 | 133.4 |
| C | 15 | 214 | 212349 | 1588.07 | 574 | 577 | 133.4 |
| C | 14 | 67 | 7837 | 54.44 | 574 | 577 | 133.4 |
| D | 7 | 80 | 319610 | 2234.38 | 580 | 566 | 142.8 |
| D | 13 | 249 | 230218 | 1608.34 | 580 | 566 | 142.8 |
| D | 14 | 52 | 195869 | 1367.78 | 580 | 566 | 142.8 |
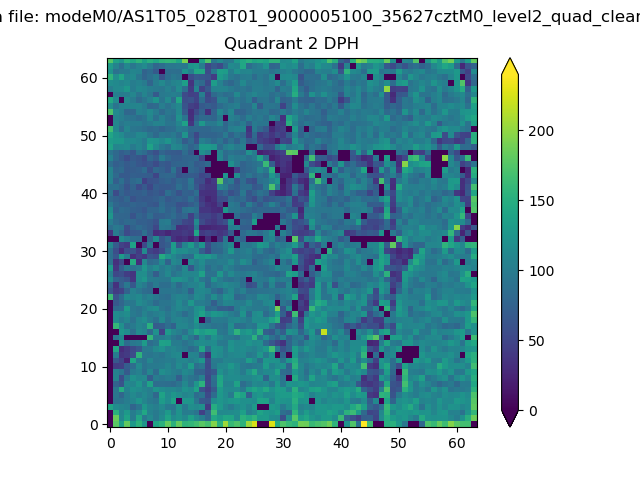
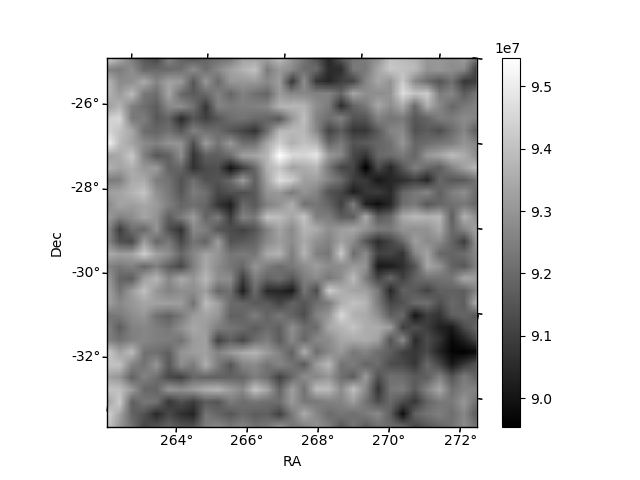
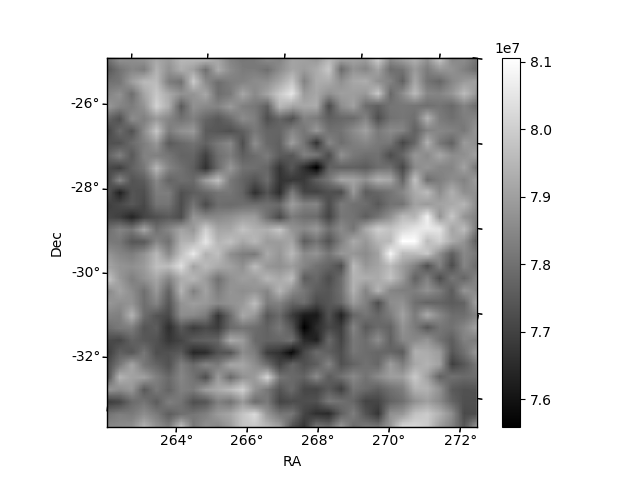
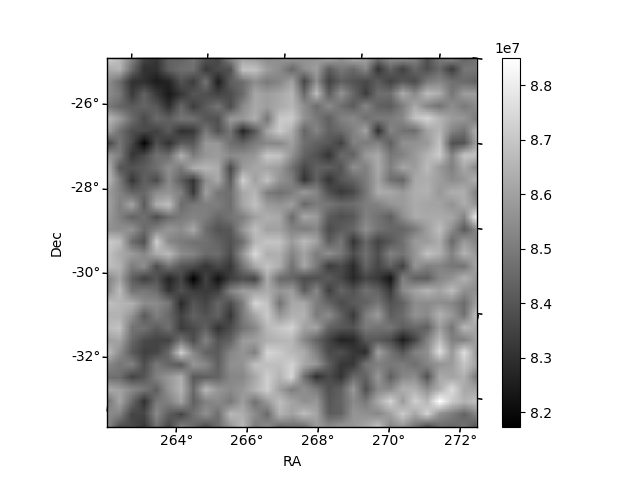
Histogram calculated using DETX and DETY for each event in the final _common_clean file
| Quadrant A | 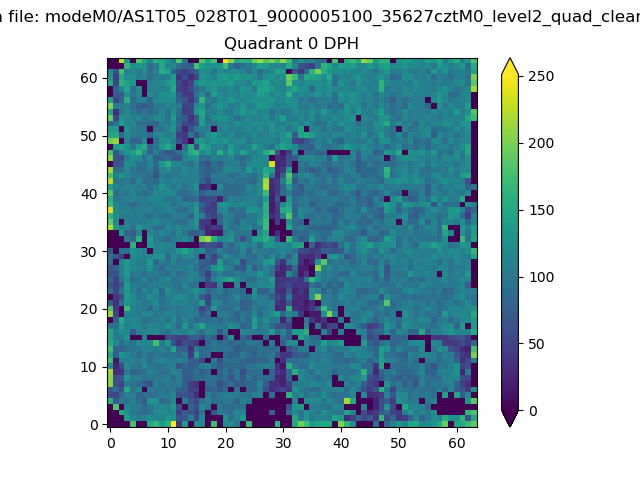 |
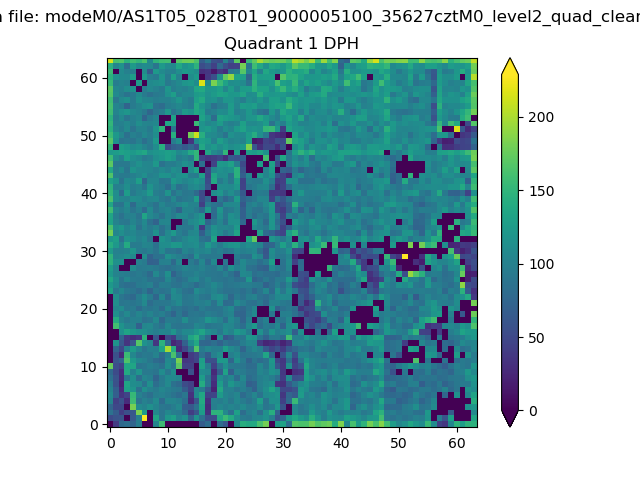 |
Quadrant B |
|---|---|---|---|
| Quadrant D | 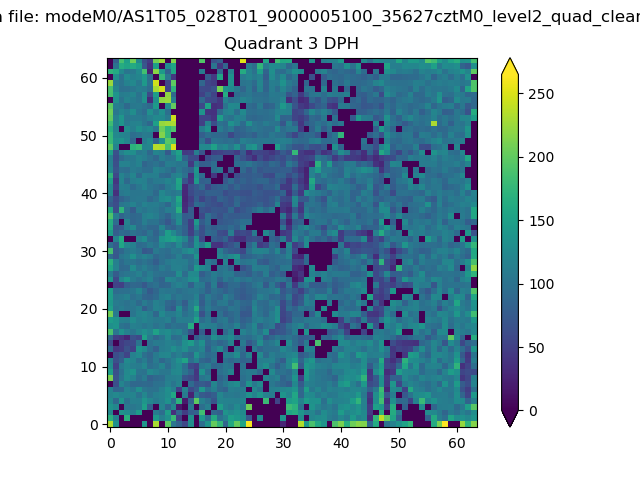 |
 |
Quadrant C |
| Plot type | Count rate plots | Images |
|---|---|---|
| Comparison with Poisson distribution Blue bars denote a histogram of data divided into 1 sec bins. Red curve is a Poisson curve with rate = median count rate of data. |
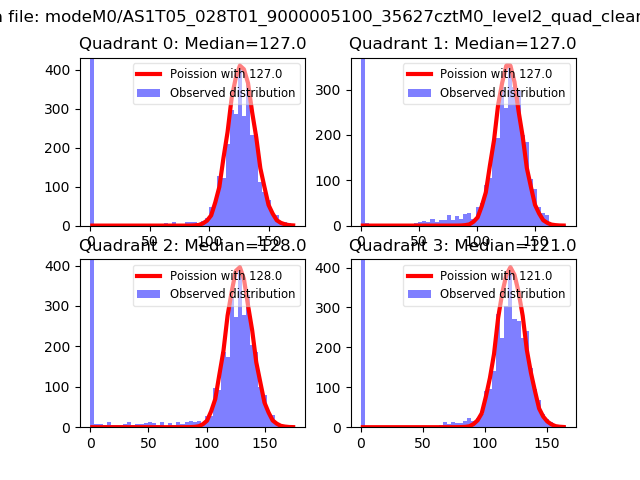 |
 |
| Quadrant-wise count rates Data is divided into 100 sec bins |
 |
|
| Module-wise count rates for Quadrant A Data is divided into 100 sec bins |
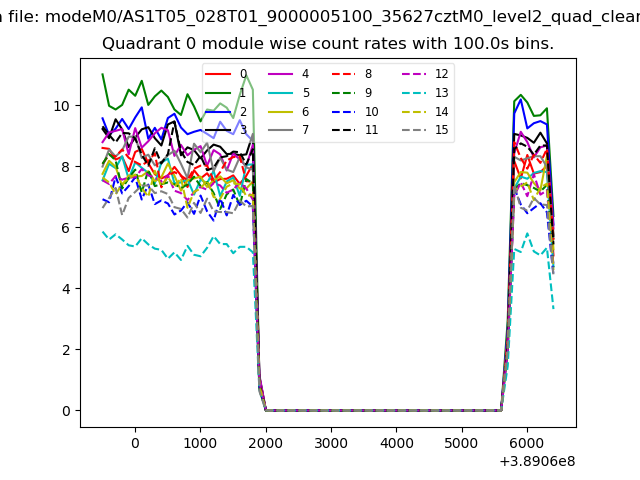 |
 |
| Module-wise count rates for Quadrant B Data is divided into 100 sec bins |
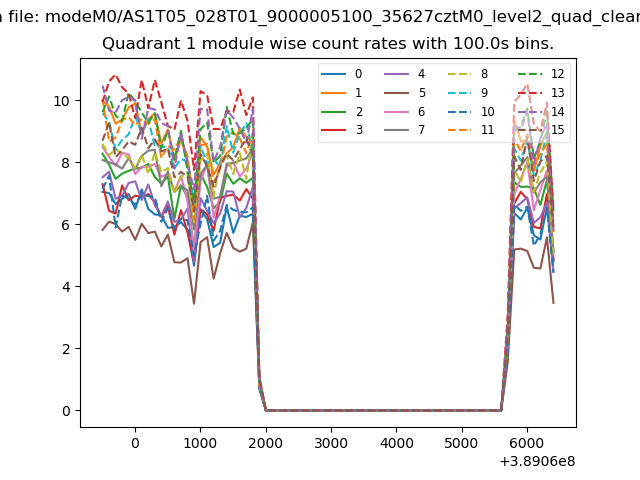 |
 |
| Module-wise count rates for Quadrant C Data is divided into 100 sec bins |
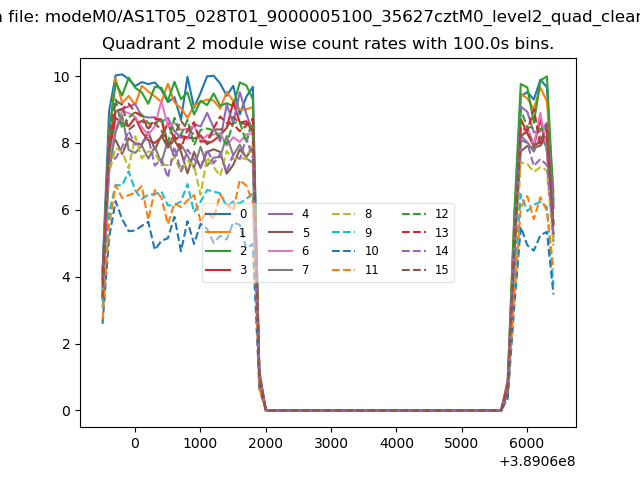 |
 |
| Module-wise count rates for Quadrant D Data is divided into 100 sec bins |
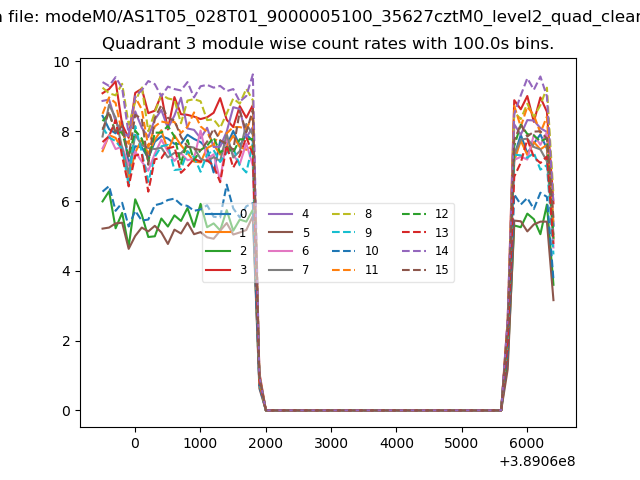 |
 |
| Parameter | Plot |
|---|---|
| CZT HV Monitor | 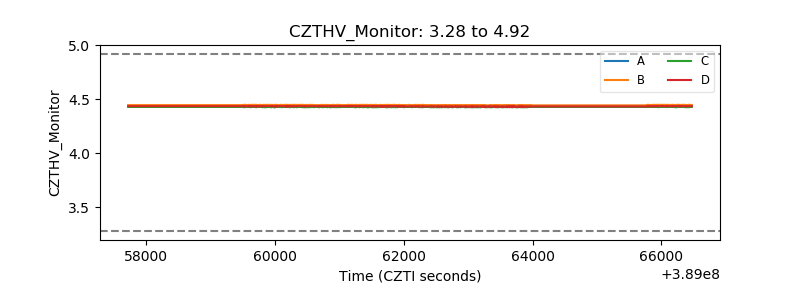 |
| D_VDD | 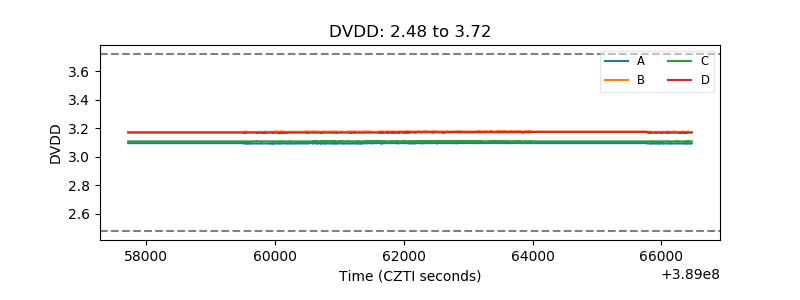 |
| Temperature 1 |  |
| Veto HV Monitor | 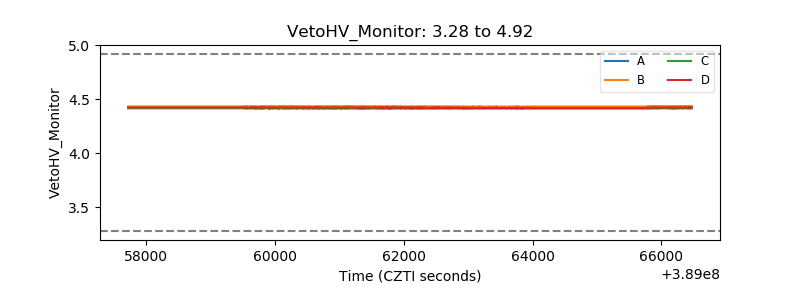 |
| Veto LLD | 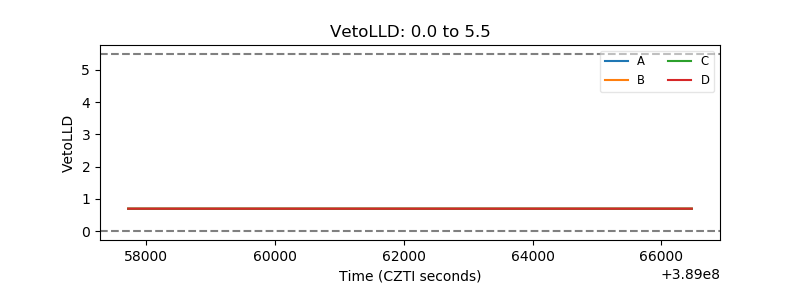 |
| Alpha Counter | 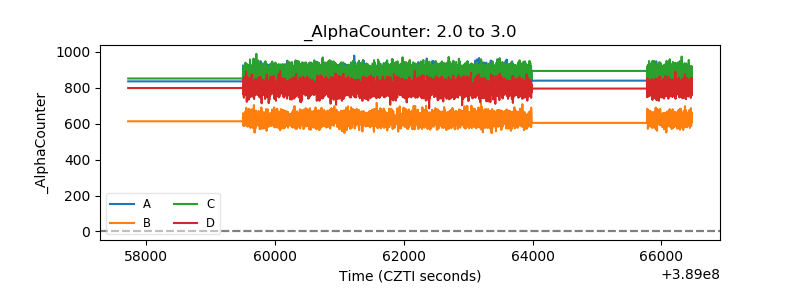 |
| _CPM_Rate | 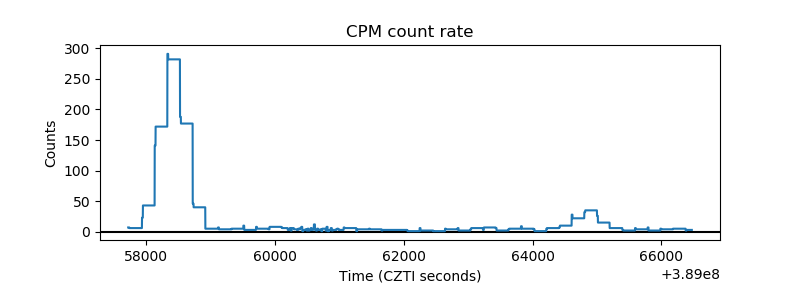 |
| CZT Counter |  |
| +2.5 Volts monitor |  |
| +5 Volts monitor |  |
| _ROLL_ROT | 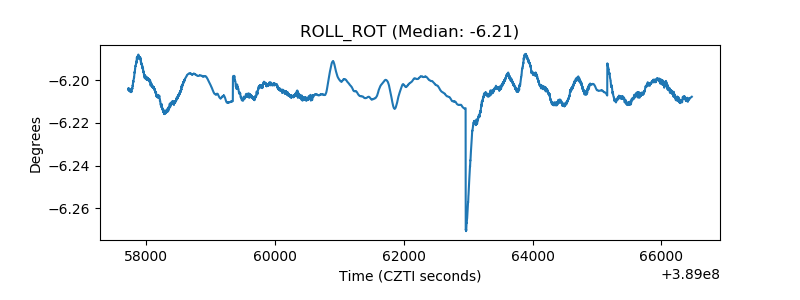 |
| _Roll_DEC | 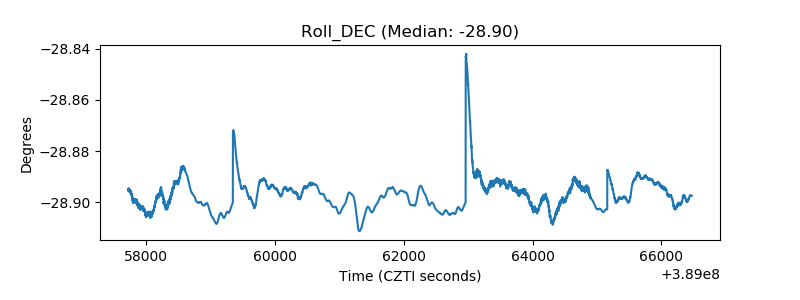 |
| _Roll_RA | 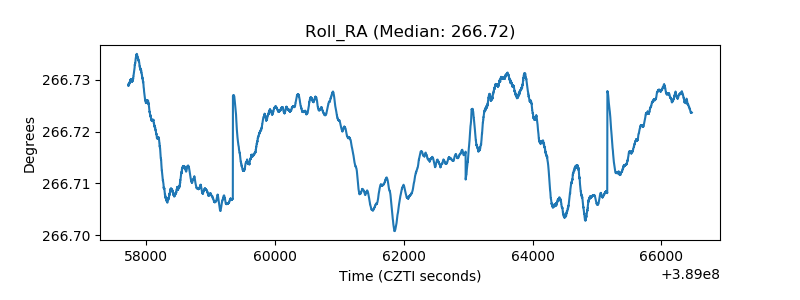 |
| Veto Counter | 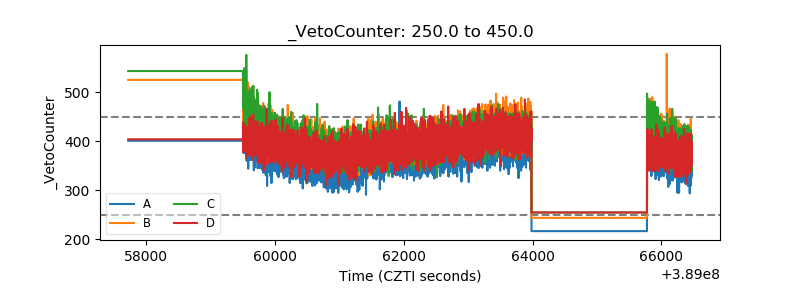 |