| Param | Original file | Final file |
|---|---|---|
| Filename | modeM0/AS1A11_106T01_9000005102cztM0_level2.fits | modeM0/AS1A11_106T01_9000005102cztM0_level2_quad_clean.evt |
| Size (bytes) | 620,000,640 | 533,329,920 |
| Size | 591.3 MB | 508.6 MB |
| Events in quadrant A | 2,141,196 | 33,173 |
| Events in quadrant B | 3,980,180 | 3,883,310 |
| Events in quadrant C | 4,094,052 | 3,805,257 |
| Events in quadrant D | 3,611,570 | 3,514,205 |
| Mode SS | |||
|---|---|---|---|
| Quadrant | BADHDUFLAG | Total packets | Discarded packets |
| A | 0 | 1464 | 0 |
| B | 0 | 1464 | 0 |
| C | 0 | 1464 | 0 |
| D | 0 | 1464 | 0 |
| Mode M0 | |||
|---|---|---|---|
| Quadrant | BADHDUFLAG | Total packets | Discarded packets |
| A | 0 | 570169 | 0 |
| B | 0 | 173657 | 0 |
| C | 0 | 170287 | 0 |
| D | 0 | 160260 | 0 |
| Mode M9 | |||
|---|---|---|---|
| Quadrant | BADHDUFLAG | Total packets | Discarded packets |
| A | 0 | 261 | 0 |
| B | 0 | 261 | 0 |
| C | 0 | 261 | 0 |
| D | 0 | 261 | 0 |
| Quadrant | Total seconds | Saturated seconds | Saturation percentage |
|---|---|---|---|
| A | 71640 | 71136 | 99.296482% |
| B | 71671 | 2062 | 2.877035% |
| C | 71668 | 1661 | 2.317631% |
| D | 71661 | 753 | 1.050781% |
Noise dominated data is calculated using 1-second bins in cleaned event files. If a bin has >2000 counts, and if more than 50% of those come from <1% of pixels, then it is considered to be noise-dominated and hence unusable.
| Quadrant | # 1 sec bins | Bins with >0 counts | Bins with >2000 counts | High rate bins dominated by noise | Noise dominated (total time) | Noise dominated (detector-on time) | Marked lightcurve |
|---|---|---|---|---|---|---|---|
| A | 97015 | 71673 | 0 | 0 | 0.00% | 0.00% |  |
| B | 97016 | 71676 | 0 | 0 | 0.00% | 0.00% |  |
| C | 97016 | 71652 | 0 | 0 | 0.00% | 0.00% |  |
| D | 97016 | 71669 | 0 | 0 | 0.00% | 0.00% |  |
Top three noisy pixels from each quadrant. If the there are fewer than three noisy pixels in the level2.evt file, extra rows are filled as -1
| Pixel properties | Quadrant properties | ||||||
|---|---|---|---|---|---|---|---|
| Quadrant | DetID | PixID | Counts | Sigma | Mean | Median | Sigma |
| A | 7 | 110 | 1761 | 8.84 | 558 | 524 | 139.9 |
| A | 9 | 19 | 1738 | 8.68 | 558 | 524 | 139.9 |
| A | 0 | 29 | 1666 | 8.16 | 558 | 524 | 139.9 |
| B | 2 | 9 | 3465 | 11.77 | 1049 | 999 | 209.5 |
| B | 3 | 80 | 3107 | 10.06 | 1049 | 999 | 209.5 |
| B | 2 | 8 | 2931 | 9.22 | 1049 | 999 | 209.5 |
| C | 1 | 81 | 3474 | 8.77 | 1082 | 1014 | 280.6 |
| C | 1 | 80 | 3429 | 8.61 | 1082 | 1014 | 280.6 |
| C | 3 | 203 | 3204 | 7.8 | 1082 | 1014 | 280.6 |
| D | 3 | 14 | 2599 | 6.05 | 1031 | 941 | 274.1 |
| D | 10 | 189 | 2598 | 6.04 | 1031 | 941 | 274.1 |
| D | 1 | 3 | 2591 | 6.02 | 1031 | 941 | 274.1 |
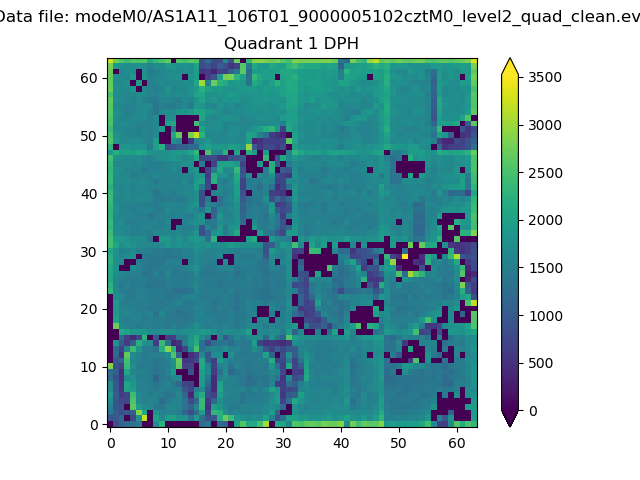
Histogram calculated using DETX and DETY for each event in the final _common_clean file
| Quadrant A |  |
 |
Quadrant B |
|---|---|---|---|
| Quadrant D | 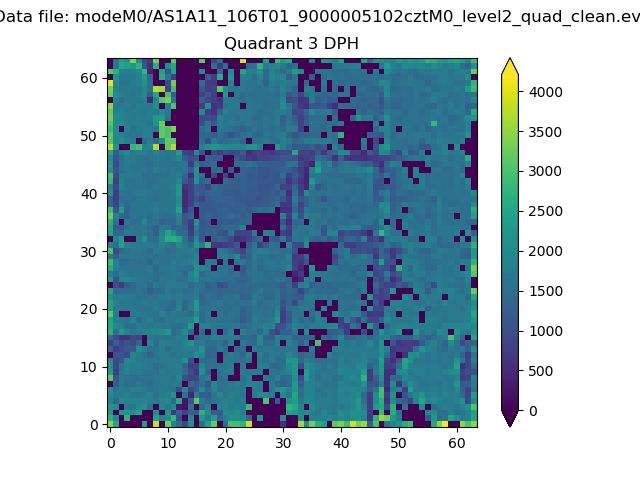 |
 |
Quadrant C |
| Plot type | Count rate plots | Images |
|---|---|---|
| Comparison with Poisson distribution Blue bars denote a histogram of data divided into 1 sec bins. Red curve is a Poisson curve with rate = median count rate of data. |
 |
 |
| Quadrant-wise count rates Data is divided into 100 sec bins |
 |
|
| Module-wise count rates for Quadrant A Data is divided into 100 sec bins |
 |
 |
| Module-wise count rates for Quadrant B Data is divided into 100 sec bins |
 |
 |
| Module-wise count rates for Quadrant C Data is divided into 100 sec bins |
 |
 |
| Module-wise count rates for Quadrant D Data is divided into 100 sec bins |
 |
 |
| Parameter | Plot |
|---|---|
| CZT HV Monitor |  |
| D_VDD |  |
| Temperature 1 |  |
| Veto HV Monitor |  |
| Veto LLD | 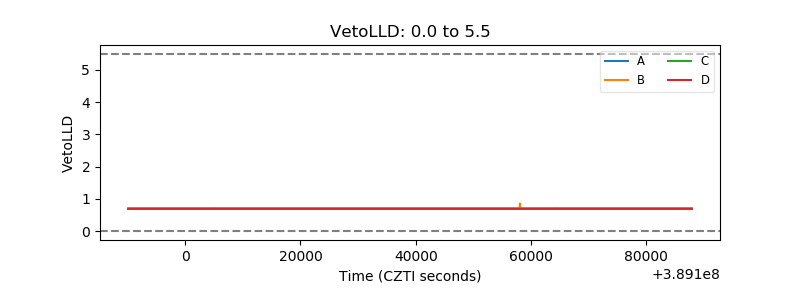 |
| Alpha Counter |  |
| _CPM_Rate |  |
| CZT Counter | 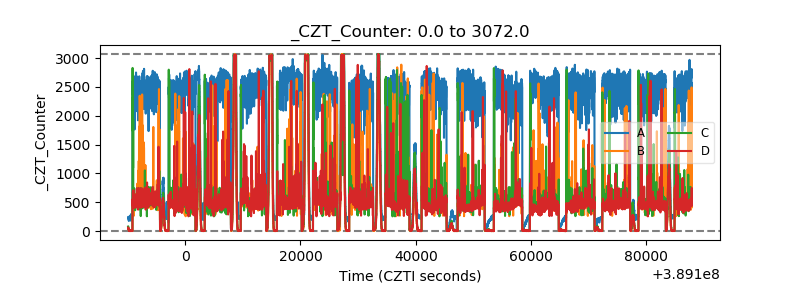 |
| +2.5 Volts monitor | 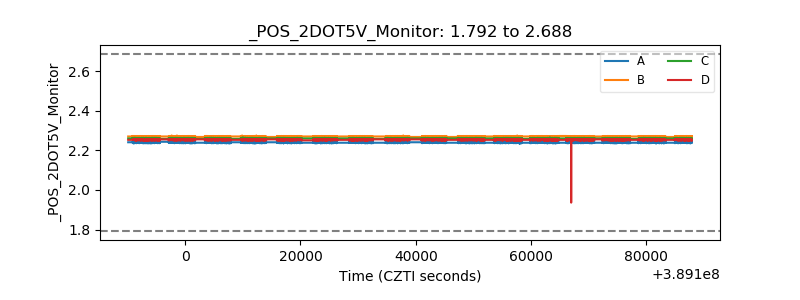 |
| +5 Volts monitor |  |
| _ROLL_ROT |  |
| _Roll_DEC | 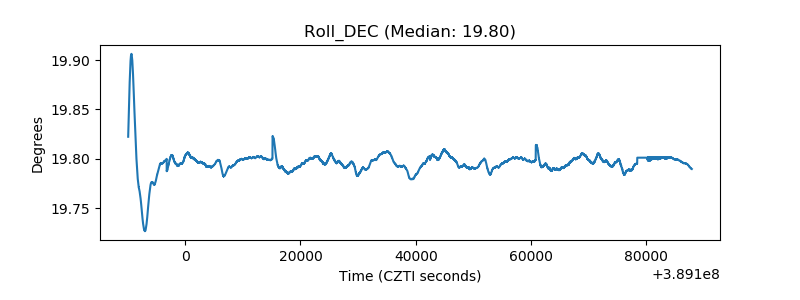 |
| _Roll_RA |  |
| Veto Counter |  |