| Param | Original file | Final file |
|---|---|---|
| Filename | modeM0/AS1A11_106T01_9000005102_35648cztM0_level2.evt | modeM0/AS1A11_106T01_9000005102_35648cztM0_level2_quad_clean.evt |
| Size (bytes) | 4,373,346,240 | 335,361,600 |
| Size | 4.1 GB | 319.8 MB |
| Events in quadrant A | 78,002,523 | 1,172,776 |
| Events in quadrant B | 17,905,715 | 2,305,956 |
| Events in quadrant C | 18,351,456 | 2,281,056 |
| Events in quadrant D | 16,049,426 | 2,203,169 |
| Mode SS | |||
|---|---|---|---|
| Quadrant | BADHDUFLAG | Total packets | Discarded packets |
| A | 0 | 648 | 0 |
| B | 0 | 648 | 0 |
| C | 0 | 648 | 0 |
| D | 0 | 648 | 0 |
| Mode M0 | |||
|---|---|---|---|
| Quadrant | BADHDUFLAG | Total packets | Discarded packets |
| A | 0 | 252869 | 6 |
| B | 0 | 73601 | 6 |
| C | 0 | 73336 | 6 |
| D | 0 | 69409 | 6 |
| Mode M9 | |||
|---|---|---|---|
| Quadrant | BADHDUFLAG | Total packets | Discarded packets |
| A | 0 | 85 | 0 |
| B | 0 | 85 | 0 |
| C | 0 | 85 | 0 |
| D | 0 | 85 | 0 |
| Quadrant | Total seconds | Saturated seconds | Saturation percentage |
|---|---|---|---|
| A | 31799 | 31728 | 99.776723% |
| B | 31799 | 633 | 1.990629% |
| C | 31799 | 558 | 1.754772% |
| D | 31799 | 394 | 1.239033% |
Noise dominated data is calculated using 1-second bins in cleaned event files. If a bin has >2000 counts, and if more than 50% of those come from <1% of pixels, then it is considered to be noise-dominated and hence unusable.
| Quadrant | # 1 sec bins | Bins with >0 counts | Bins with >2000 counts | High rate bins dominated by noise | Noise dominated (total time) | Noise dominated (detector-on time) | Marked lightcurve |
|---|---|---|---|---|---|---|---|
| A | 40308 | 31805 | 30680 | 30680 | 76.11% | 96.46% | 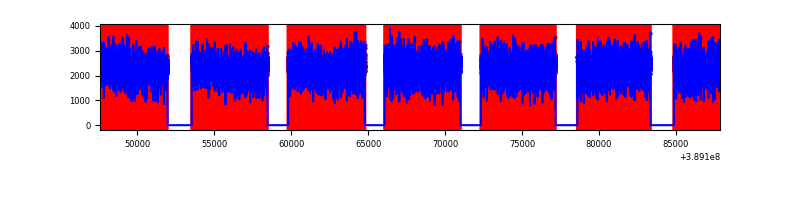 |
| B | 40308 | 31804 | 401 | 401 | 0.99% | 1.26% | 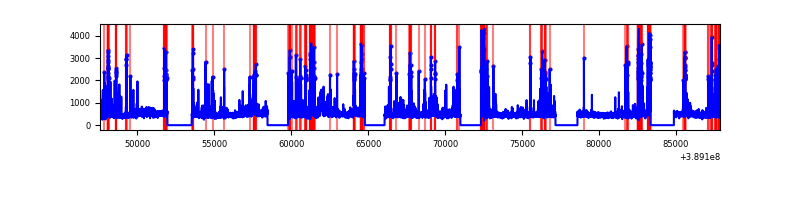 |
| C | 40308 | 31805 | 434 | 434 | 1.08% | 1.36% | 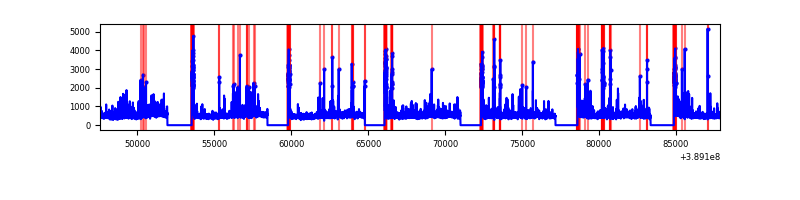 |
| D | 40308 | 31805 | 337 | 337 | 0.84% | 1.06% | 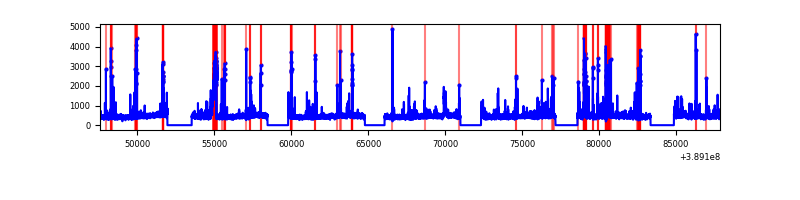 |
Top three noisy pixels from each quadrant. If the there are fewer than three noisy pixels in the level2.evt file, extra rows are filled as -1
| Pixel properties | Quadrant properties | ||||||
|---|---|---|---|---|---|---|---|
| Quadrant | DetID | PixID | Counts | Sigma | Mean | Median | Sigma |
| A | 15 | 169 | 68960993 | 155235.57 | 2237 | 2194 | 444.2 |
| A | 10 | 83 | 356286 | 797.11 | 2237 | 2194 | 444.2 |
| A | 12 | 189 | 28248 | 58.65 | 2237 | 2194 | 444.2 |
| B | 5 | 172 | 3157304 | 4499.19 | 3648 | 3549 | 701.0 |
| B | 0 | 197 | 238638 | 335.38 | 3648 | 3549 | 701.0 |
| B | 0 | 189 | 92054 | 126.26 | 3648 | 3549 | 701.0 |
| C | 0 | 10 | 2043332 | 2460.79 | 3600 | 3626 | 828.9 |
| C | 15 | 214 | 1294995 | 1557.97 | 3600 | 3626 | 828.9 |
| C | 9 | 187 | 455084 | 544.66 | 3600 | 3626 | 828.9 |
| D | 10 | 253 | 587412 | 673.04 | 3604 | 3509 | 867.6 |
| D | 13 | 249 | 493384 | 564.66 | 3604 | 3509 | 867.6 |
| D | 2 | 153 | 429460 | 490.98 | 3604 | 3509 | 867.6 |
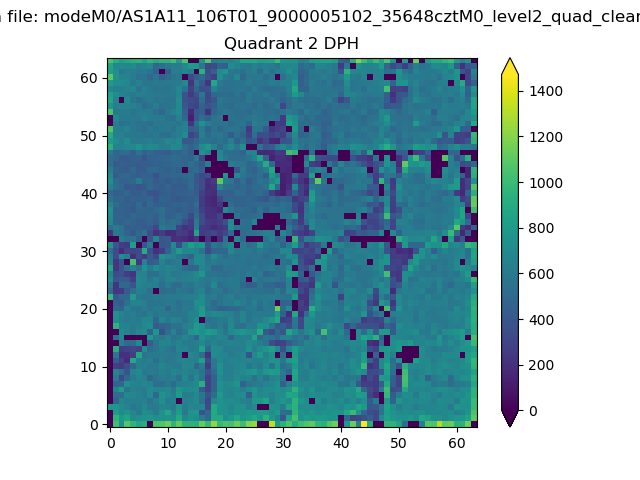
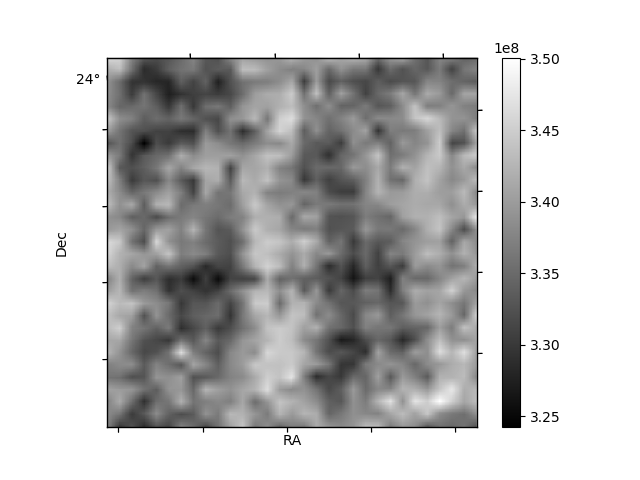
Histogram calculated using DETX and DETY for each event in the final _common_clean file
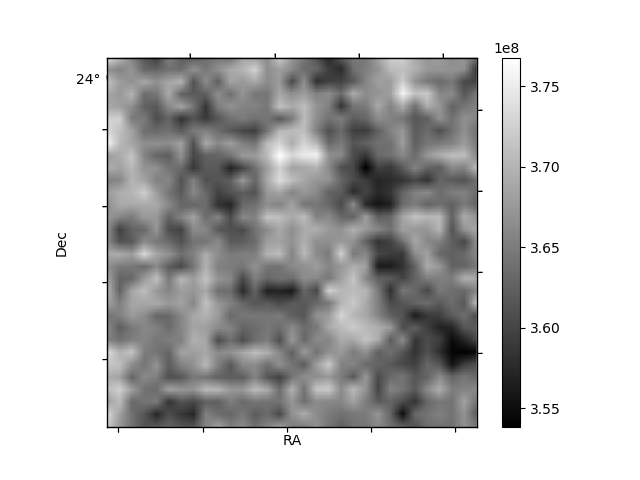
| Quadrant A | 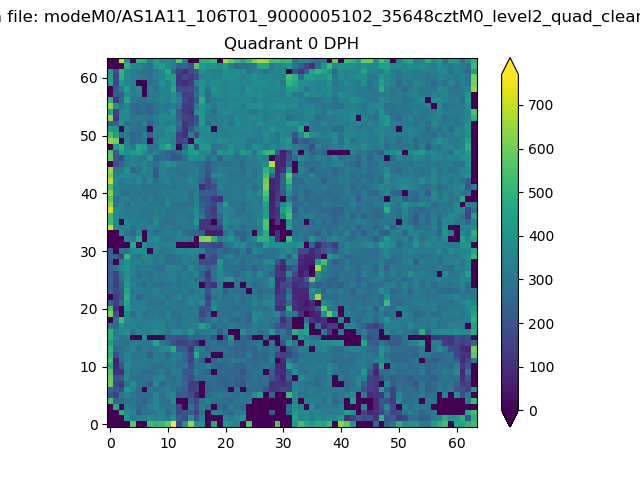 |
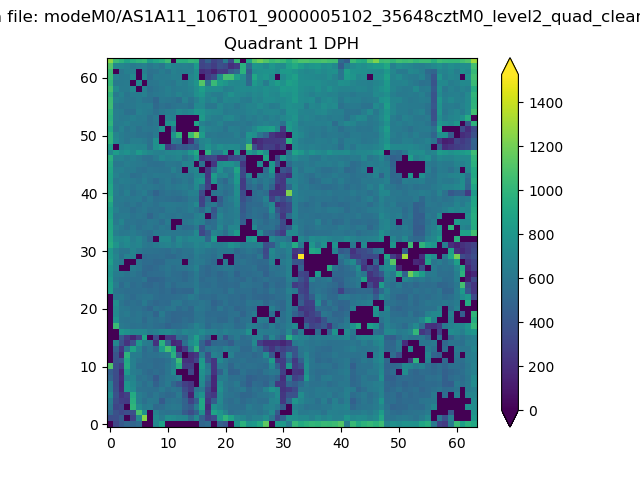 |
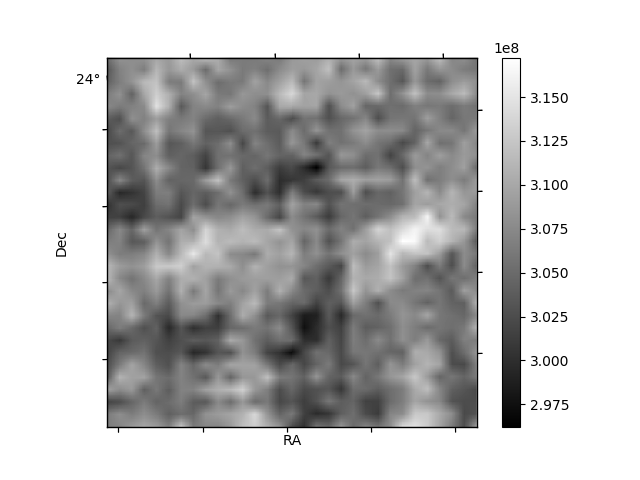
Quadrant B |
|---|---|---|---|
| Quadrant D | 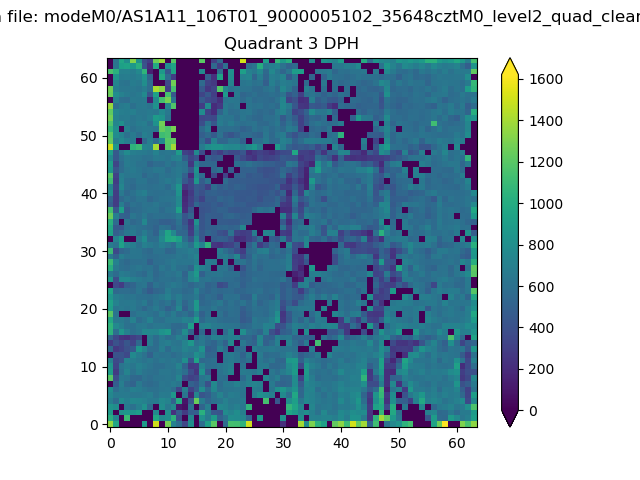 |
 |
Quadrant C |
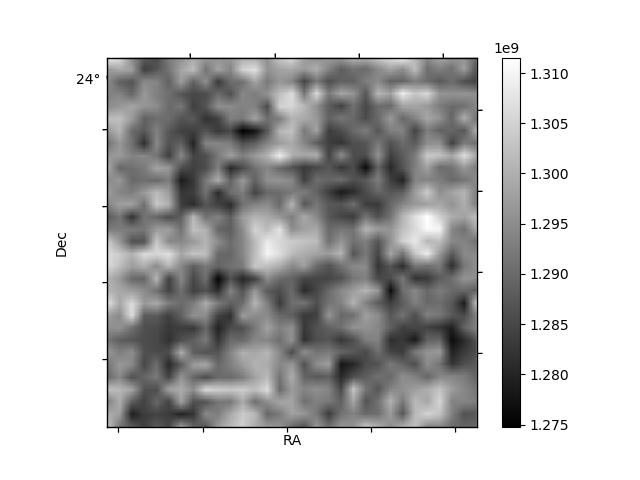
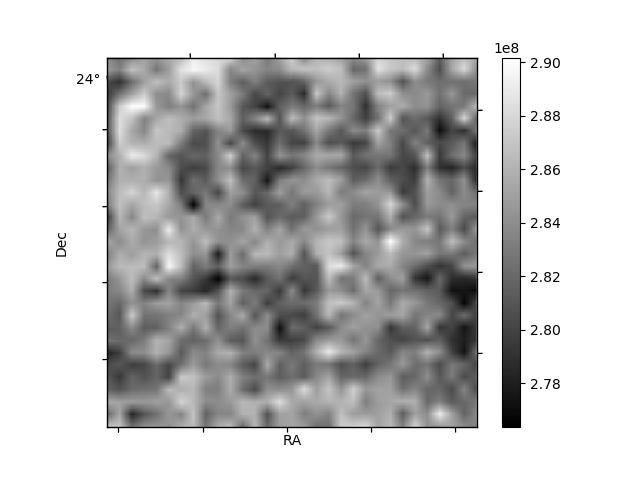
| Plot type | Count rate plots | Images |
|---|---|---|
| Comparison with Poisson distribution Blue bars denote a histogram of data divided into 1 sec bins. Red curve is a Poisson curve with rate = median count rate of data. |
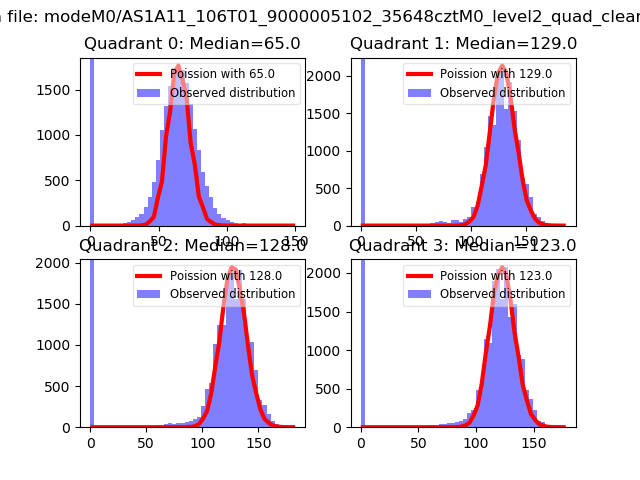 |
 |
| Quadrant-wise count rates Data is divided into 100 sec bins |
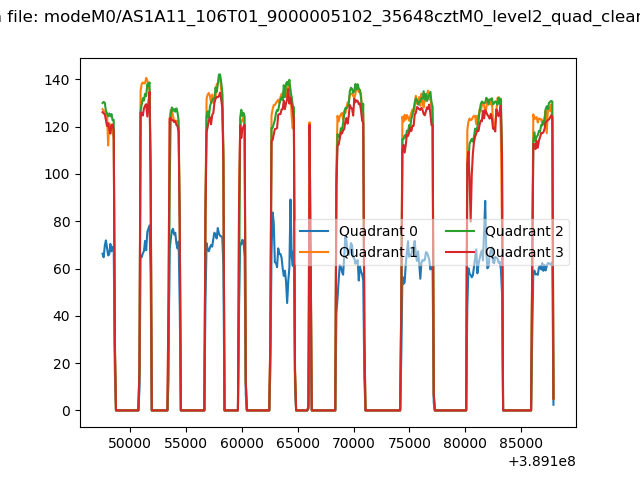 |
|
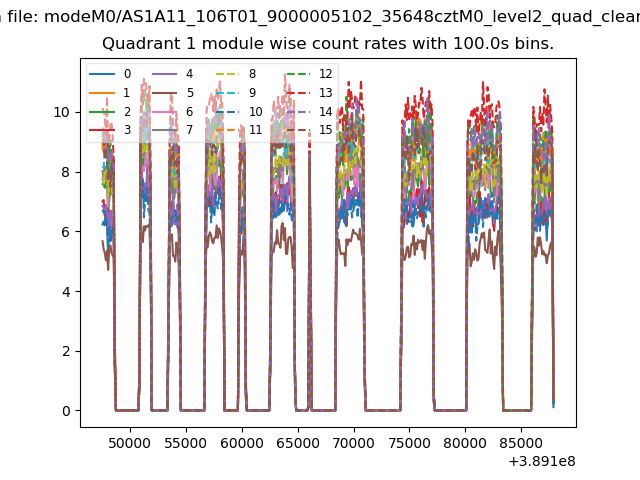
| Module-wise count rates for Quadrant A Data is divided into 100 sec bins |
 |
 |
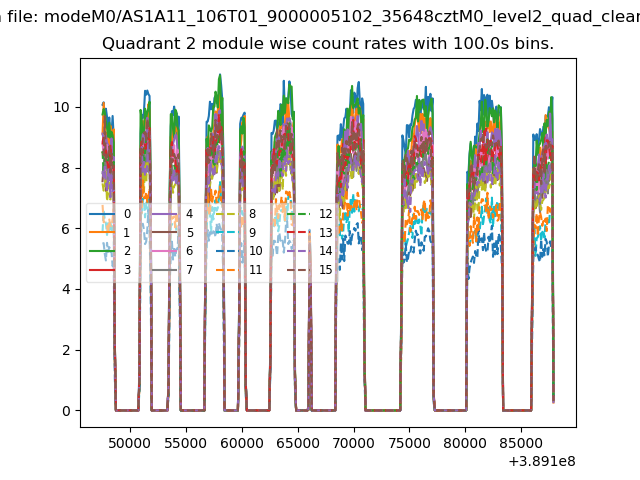
| Module-wise count rates for Quadrant B Data is divided into 100 sec bins |
 |
 |
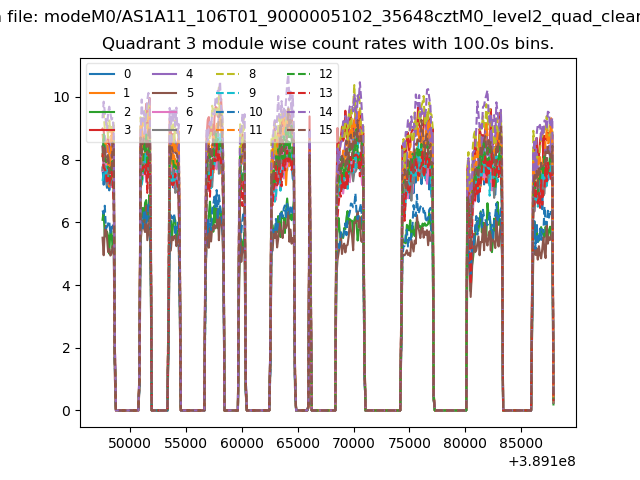
| Module-wise count rates for Quadrant C Data is divided into 100 sec bins |
 |
 |
| Module-wise count rates for Quadrant D Data is divided into 100 sec bins |
 |
 |
| Parameter | Plot |
|---|---|
| CZT HV Monitor | 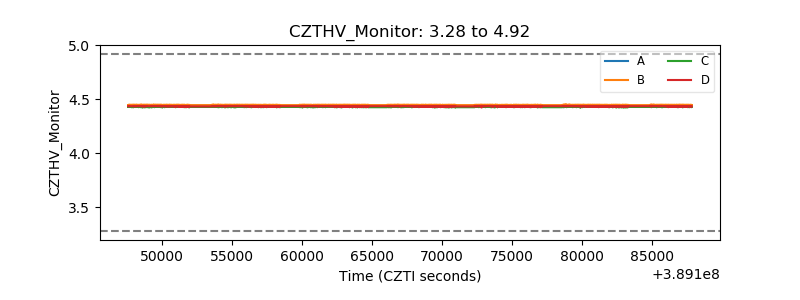 |
| D_VDD | 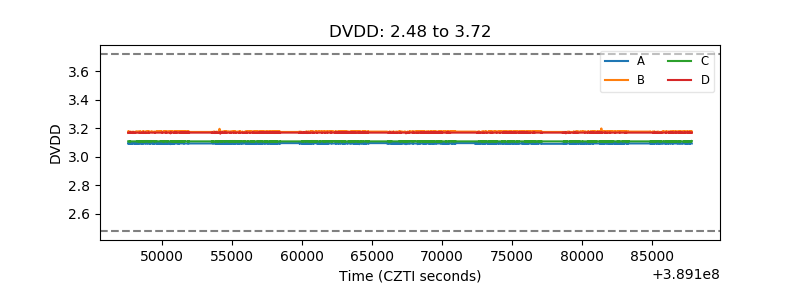 |
| Temperature 1 | 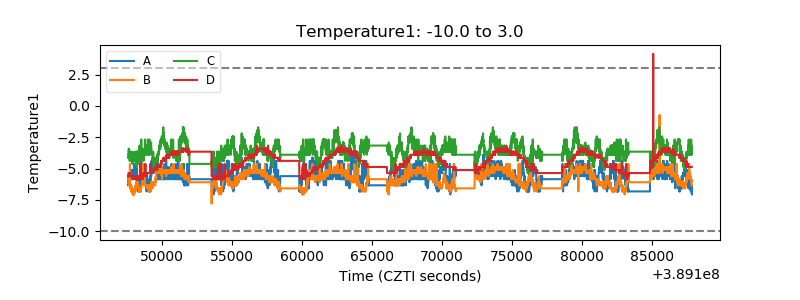 |
| Veto HV Monitor | 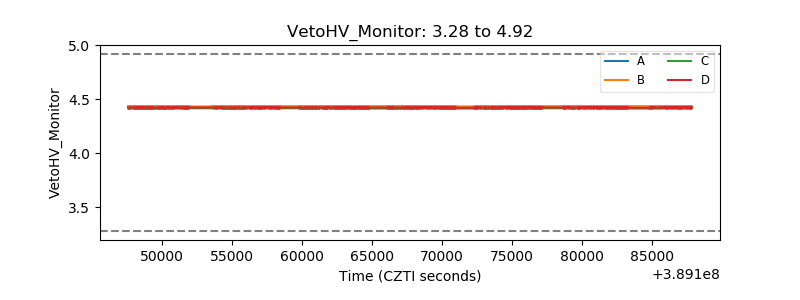 |
| Veto LLD | 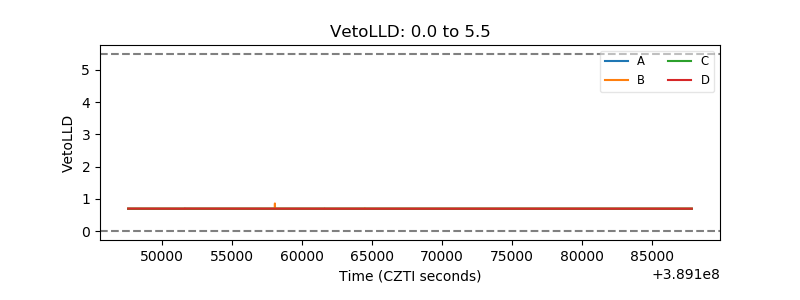 |
| Alpha Counter | 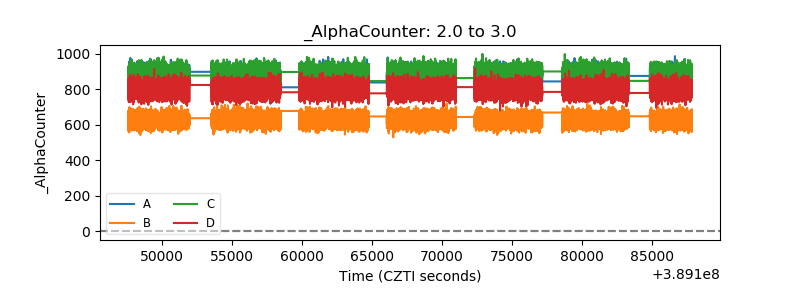 |
| _CPM_Rate | 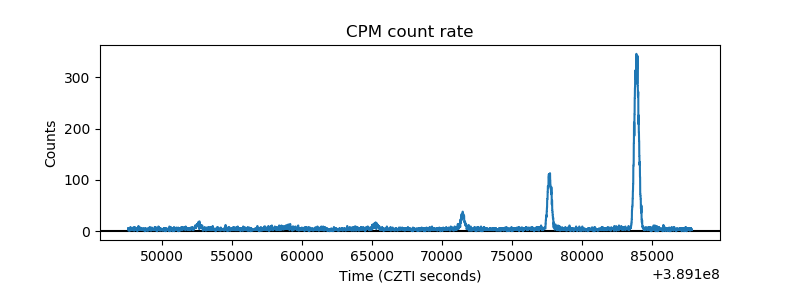 |
| CZT Counter |  |
| +2.5 Volts monitor |  |
| +5 Volts monitor |  |
| _ROLL_ROT | 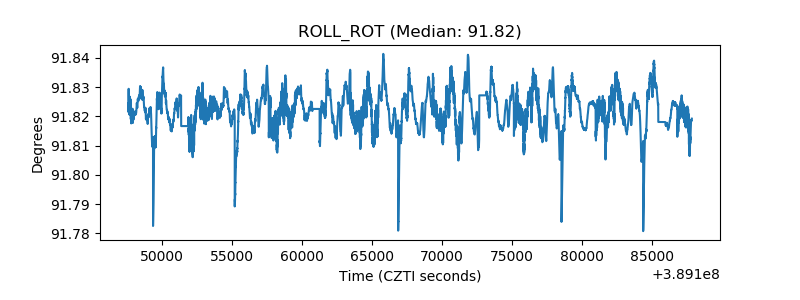 |
| _Roll_DEC |  |
| _Roll_RA |  |
| Veto Counter | 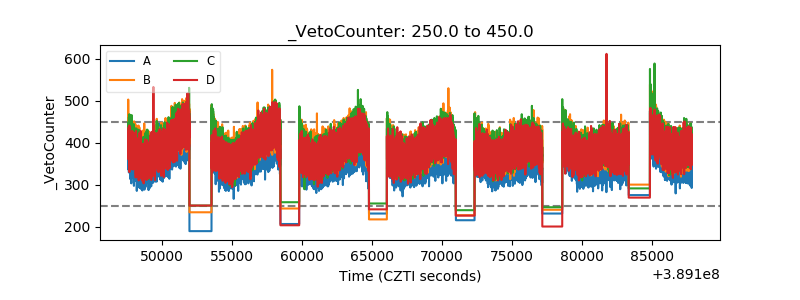 |