| Param | Original file | Final file |
|---|---|---|
| Filename | modeM0/AS1C07_001T07_9000005104cztM0_level2.fits | modeM0/AS1C07_001T07_9000005104cztM0_level2_quad_clean.evt |
| Size (bytes) | 719,657,280 | 834,125,760 |
| Size | 686.3 MB | 795.5 MB |
| Events in quadrant A | 3,802,318 | 3,743,615 |
| Events in quadrant B | 4,238,376 | 5,439,238 |
| Events in quadrant C | 4,514,374 | 5,660,493 |
| Events in quadrant D | 3,818,924 | 5,015,251 |
| Mode SS | |||
|---|---|---|---|
| Quadrant | BADHDUFLAG | Total packets | Discarded packets |
| A | 0 | 1614 | 0 |
| B | 0 | 1614 | 0 |
| C | 0 | 1614 | 0 |
| D | 0 | 1614 | 0 |
| Mode M9 | |||
|---|---|---|---|
| Quadrant | BADHDUFLAG | Total packets | Discarded packets |
| A | 0 | 316 | 0 |
| B | 0 | 316 | 0 |
| C | 0 | 316 | 0 |
| D | 0 | 316 | 0 |
| Mode M0 | |||
|---|---|---|---|
| Quadrant | BADHDUFLAG | Total packets | Discarded packets |
| A | 0 | 384644 | 0 |
| B | 0 | 211321 | 0 |
| C | 0 | 183425 | 0 |
| D | 0 | 212019 | 0 |
| Quadrant | Total seconds | Saturated seconds | Saturation percentage |
|---|---|---|---|
| A | 78803 | 27895 | 35.398399% |
| B | 78803 | 5132 | 6.512442% |
| C | 78803 | 1836 | 2.329861% |
| D | 78803 | 4477 | 5.681256% |
Noise dominated data is calculated using 1-second bins in cleaned event files. If a bin has >2000 counts, and if more than 50% of those come from <1% of pixels, then it is considered to be noise-dominated and hence unusable.
| Quadrant | # 1 sec bins | Bins with >0 counts | Bins with >2000 counts | High rate bins dominated by noise | Noise dominated (total time) | Noise dominated (detector-on time) | Marked lightcurve |
|---|---|---|---|---|---|---|---|
| A | 110529 | 78802 | 0 | 0 | 0.00% | 0.00% |  |
| B | 110529 | 78656 | 0 | 0 | 0.00% | 0.00% |  |
| C | 110529 | 78739 | 0 | 0 | 0.00% | 0.00% |  |
| D | 110529 | 78675 | 0 | 0 | 0.00% | 0.00% |  |
Top three noisy pixels from each quadrant. If the there are fewer than three noisy pixels in the level2.evt file, extra rows are filled as -1
| Pixel properties | Quadrant properties | ||||||
|---|---|---|---|---|---|---|---|
| Quadrant | DetID | PixID | Counts | Sigma | Mean | Median | Sigma |
| A | 9 | 19 | 3123 | 8.86 | 992 | 935 | 246.9 |
| A | 0 | 29 | 3024 | 8.46 | 992 | 935 | 246.9 |
| A | 7 | 110 | 3015 | 8.42 | 992 | 935 | 246.9 |
| B | 2 | 9 | 3747 | 12.18 | 1124 | 1078 | 219.1 |
| B | 3 | 80 | 3234 | 9.84 | 1124 | 1078 | 219.1 |
| B | 2 | 8 | 2994 | 8.75 | 1124 | 1078 | 219.1 |
| C | 1 | 81 | 3769 | 8.56 | 1196 | 1127 | 308.7 |
| C | 1 | 80 | 3670 | 8.24 | 1196 | 1127 | 308.7 |
| C | 3 | 187 | 3150 | 6.55 | 1196 | 1127 | 308.7 |
| D | 6 | 62 | 2818 | 6.2 | 1095 | 1000 | 293.3 |
| D | 7 | 3 | 2814 | 6.18 | 1095 | 1000 | 293.3 |
| D | 10 | 113 | 2804 | 6.15 | 1095 | 1000 | 293.3 |
Histogram calculated using DETX and DETY for each event in the final _common_clean file
| Quadrant A | 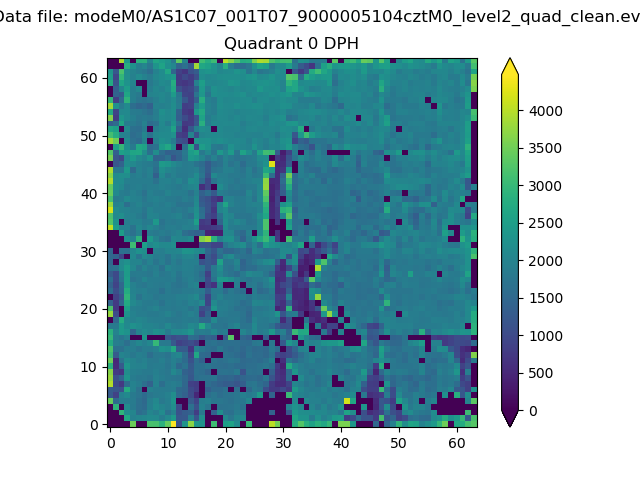 |
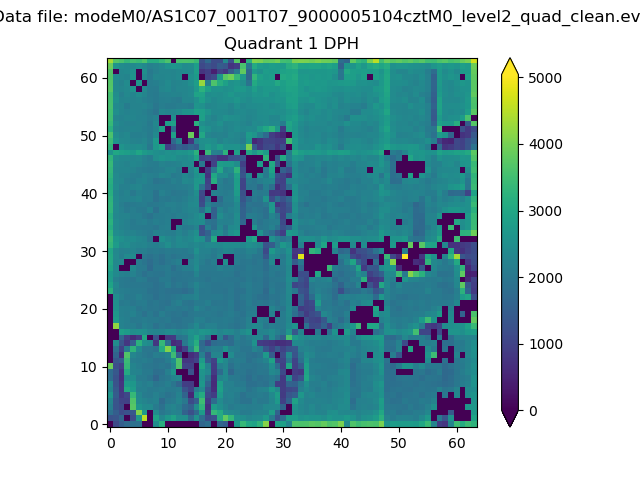 |
Quadrant B |
|---|---|---|---|
| Quadrant D |  |
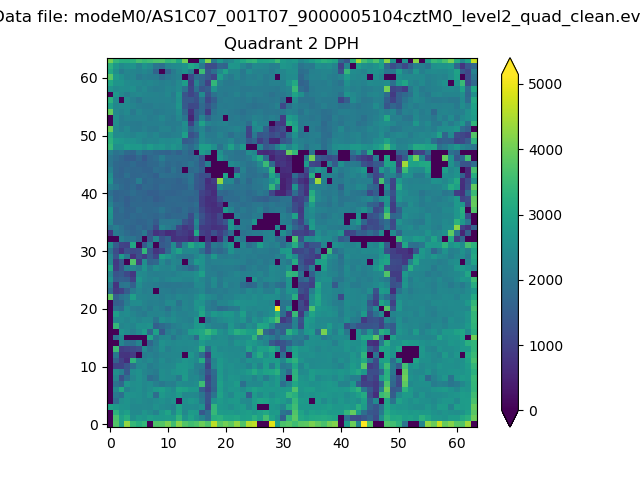 |
Quadrant C |
| Plot type | Count rate plots | Images |
|---|---|---|
| Comparison with Poisson distribution Blue bars denote a histogram of data divided into 1 sec bins. Red curve is a Poisson curve with rate = median count rate of data. |
 |
 |
| Quadrant-wise count rates Data is divided into 100 sec bins |
 |
|
| Module-wise count rates for Quadrant A Data is divided into 100 sec bins |
 |
 |
| Module-wise count rates for Quadrant B Data is divided into 100 sec bins |
 |
 |
| Module-wise count rates for Quadrant C Data is divided into 100 sec bins |
 |
 |
| Module-wise count rates for Quadrant D Data is divided into 100 sec bins |
 |
 |
| Parameter | Plot |
|---|---|
| CZT HV Monitor |  |
| D_VDD |  |
| Temperature 1 |  |
| Veto HV Monitor |  |
| Veto LLD |  |
| Alpha Counter |  |
| _CPM_Rate |  |
| CZT Counter |  |
| +2.5 Volts monitor |  |
| +5 Volts monitor |  |
| _ROLL_ROT |  |
| _Roll_DEC |  |
| _Roll_RA |  |
| Veto Counter |  |