| Param | Original file | Final file |
|---|---|---|
| Filename | modeM0/AS1C07_001T07_9000005104_35665cztM0_level2.evt | modeM0/AS1C07_001T07_9000005104_35665cztM0_level2_quad_clean.evt |
| Size (bytes) | 440,792,640 | 97,375,680 |
| Size | 420.4 MB | 92.9 MB |
| Events in quadrant A | 2,619,283 | 655,592 |
| Events in quadrant B | 4,120,267 | 634,269 |
| Events in quadrant C | 3,083,739 | 659,049 |
| Events in quadrant D | 3,167,394 | 630,453 |
| Mode SS | |||
|---|---|---|---|
| Quadrant | BADHDUFLAG | Total packets | Discarded packets |
| A | 0 | 108 | 0 |
| B | 0 | 108 | 0 |
| C | 0 | 108 | 0 |
| D | 0 | 108 | 0 |
| Mode M9 | |||
|---|---|---|---|
| Quadrant | BADHDUFLAG | Total packets | Discarded packets |
| A | 0 | 19 | 0 |
| B | 0 | 19 | 0 |
| C | 0 | 19 | 0 |
| D | 0 | 19 | 0 |
| Mode M0 | |||
|---|---|---|---|
| Quadrant | BADHDUFLAG | Total packets | Discarded packets |
| A | 0 | 11247 | 3 |
| B | 0 | 15735 | 2 |
| C | 0 | 12275 | 2 |
| D | 0 | 12925 | 2 |
| Quadrant | Total seconds | Saturated seconds | Saturation percentage |
|---|---|---|---|
| A | 5276 | 9 | 0.170584% |
| B | 5276 | 552 | 10.462472% |
| C | 5276 | 150 | 2.843063% |
| D | 5277 | 140 | 2.653023% |
Noise dominated data is calculated using 1-second bins in cleaned event files. If a bin has >2000 counts, and if more than 50% of those come from <1% of pixels, then it is considered to be noise-dominated and hence unusable.
| Quadrant | # 1 sec bins | Bins with >0 counts | Bins with >2000 counts | High rate bins dominated by noise | Noise dominated (total time) | Noise dominated (detector-on time) | Marked lightcurve |
|---|---|---|---|---|---|---|---|
| A | 7127 | 5277 | 0 | 0 | 0.00% | 0.00% | 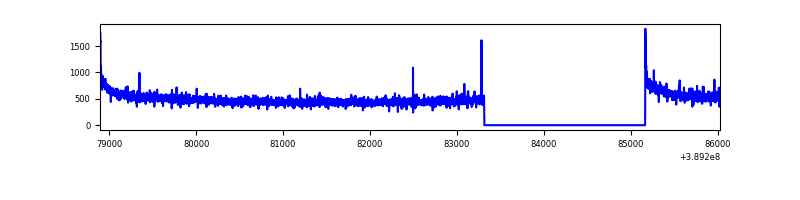 |
| B | 7127 | 5277 | 428 | 428 | 6.01% | 8.11% | 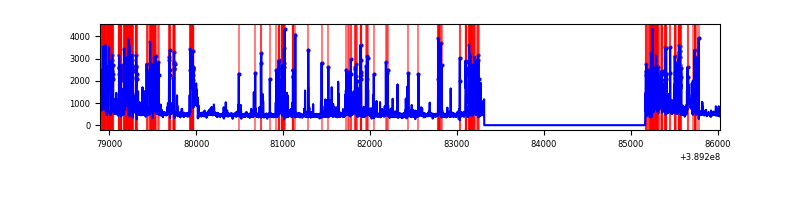 |
| C | 7127 | 5277 | 129 | 129 | 1.81% | 2.44% | 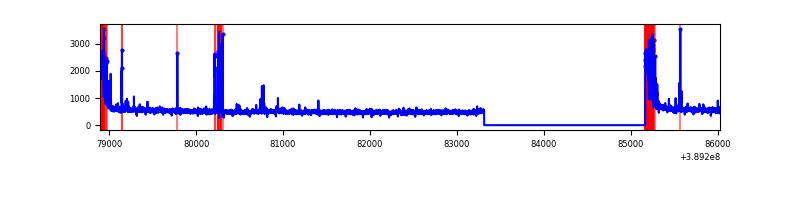 |
| D | 7128 | 5278 | 127 | 127 | 1.78% | 2.41% | 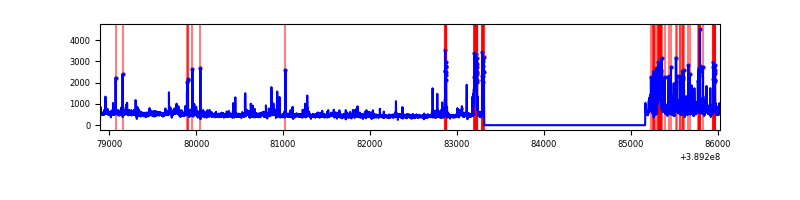 |
Top three noisy pixels from each quadrant. If the there are fewer than three noisy pixels in the level2.evt file, extra rows are filled as -1
| Pixel properties | Quadrant properties | ||||||
|---|---|---|---|---|---|---|---|
| Quadrant | DetID | PixID | Counts | Sigma | Mean | Median | Sigma |
| A | 10 | 83 | 150985 | 1200.07 | 631 | 619 | 125.3 |
| A | 13 | 6 | 22084 | 171.31 | 631 | 619 | 125.3 |
| A | 3 | 137 | 6275 | 45.14 | 631 | 619 | 125.3 |
| B | 5 | 172 | 1486627 | 13162.5 | 592 | 577 | 112.9 |
| B | 5 | 255 | 215182 | 1900.84 | 592 | 577 | 112.9 |
| B | 3 | 112 | 29036 | 252.07 | 592 | 577 | 112.9 |
| C | 0 | 10 | 361590 | 2576.17 | 613 | 618 | 140.1 |
| C | 15 | 214 | 217849 | 1550.32 | 613 | 618 | 140.1 |
| C | 1 | 23 | 78196 | 553.65 | 613 | 618 | 140.1 |
| D | 7 | 80 | 265569 | 1749.76 | 619 | 604 | 151.4 |
| D | 13 | 249 | 188069 | 1237.97 | 619 | 604 | 151.4 |
| D | 2 | 249 | 80819 | 529.72 | 619 | 604 | 151.4 |
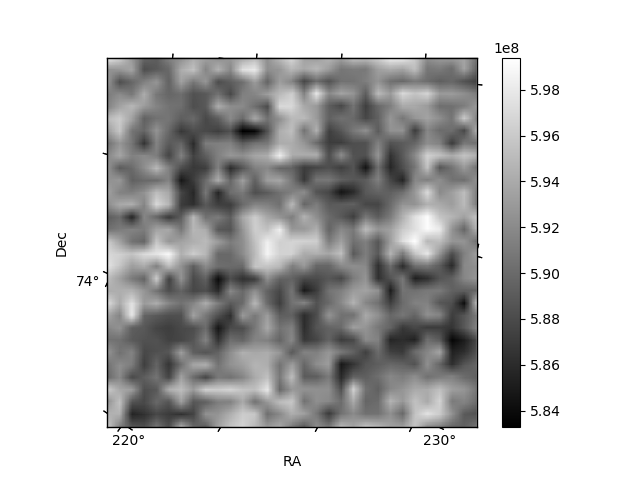
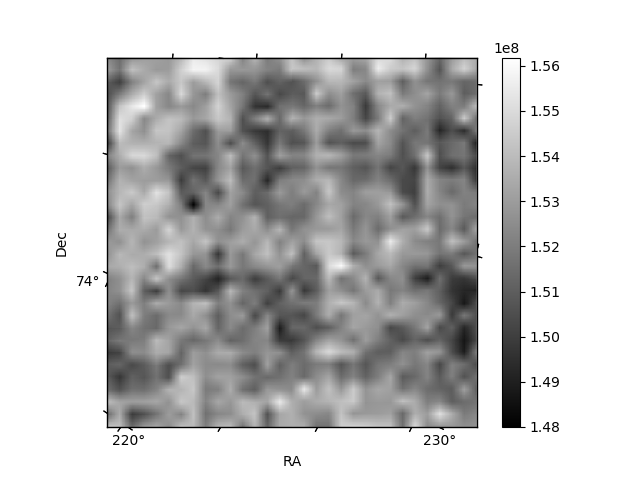
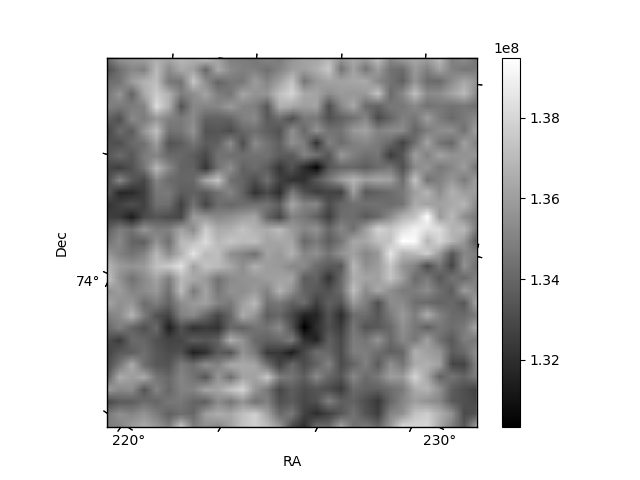
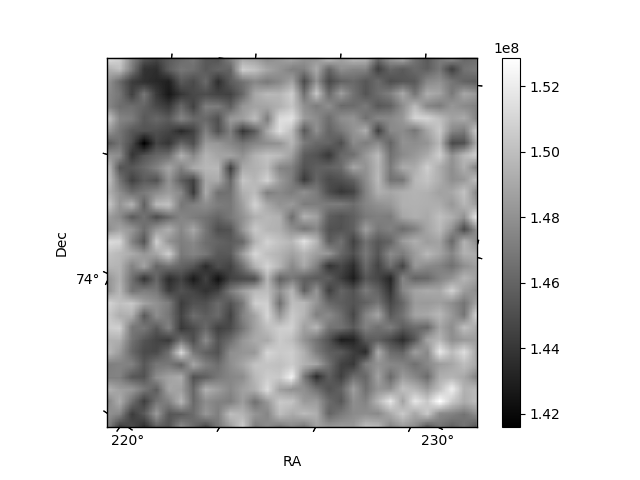
Histogram calculated using DETX and DETY for each event in the final _common_clean file
| Quadrant A | 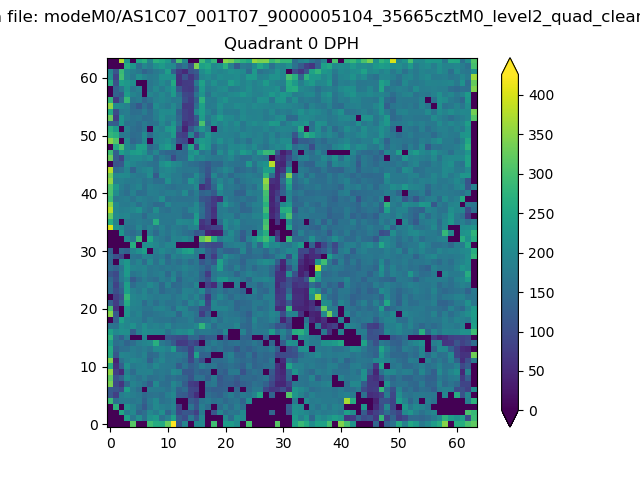 |
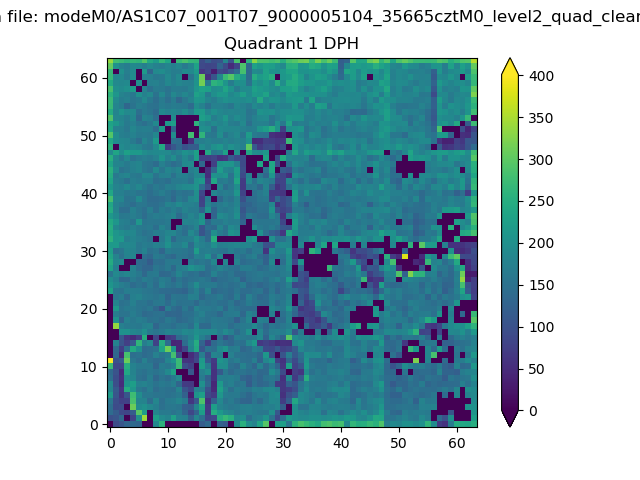 |
Quadrant B |
|---|---|---|---|
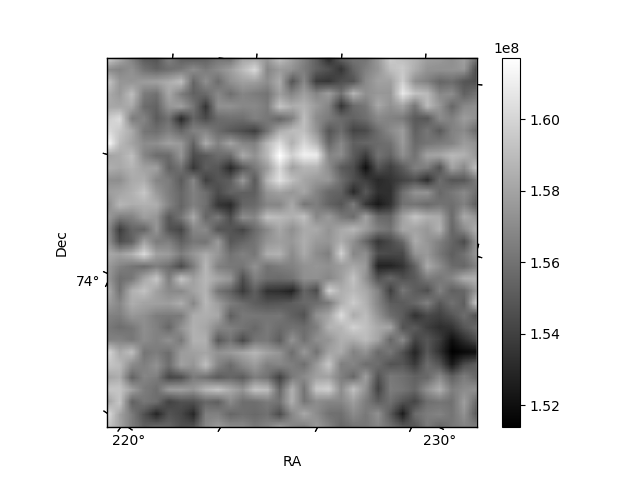
| Quadrant D | 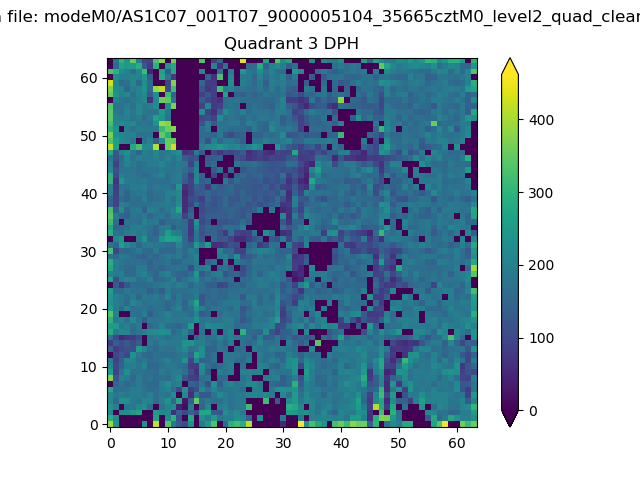 |
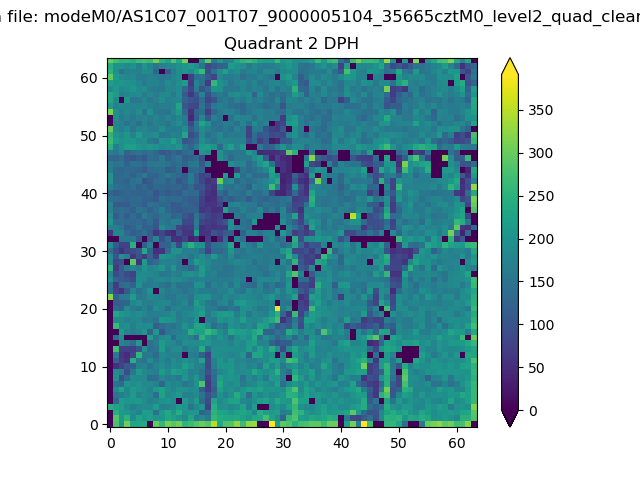 |
Quadrant C |
| Plot type | Count rate plots | Images |
|---|---|---|
| Comparison with Poisson distribution Blue bars denote a histogram of data divided into 1 sec bins. Red curve is a Poisson curve with rate = median count rate of data. |
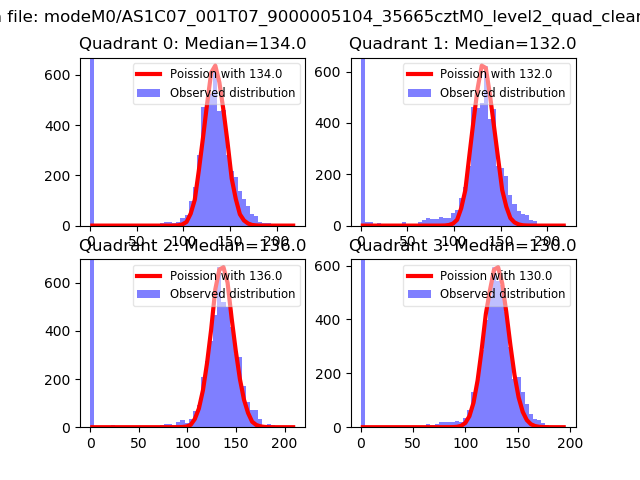 |
 |
| Quadrant-wise count rates Data is divided into 100 sec bins |
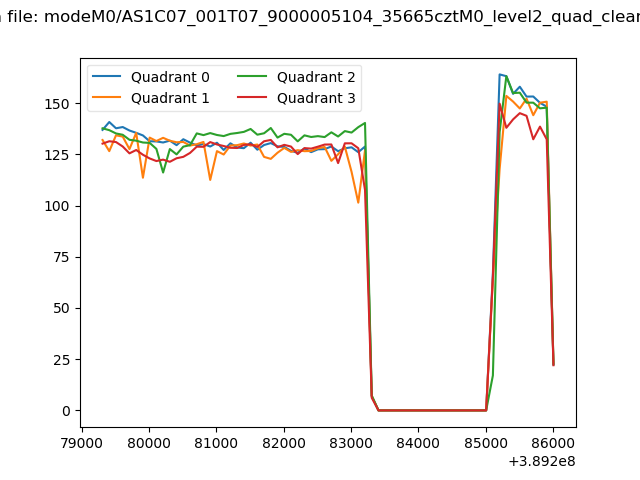 |
|
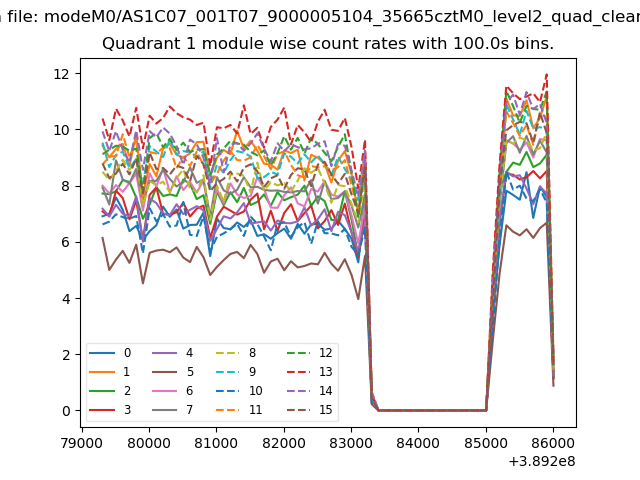
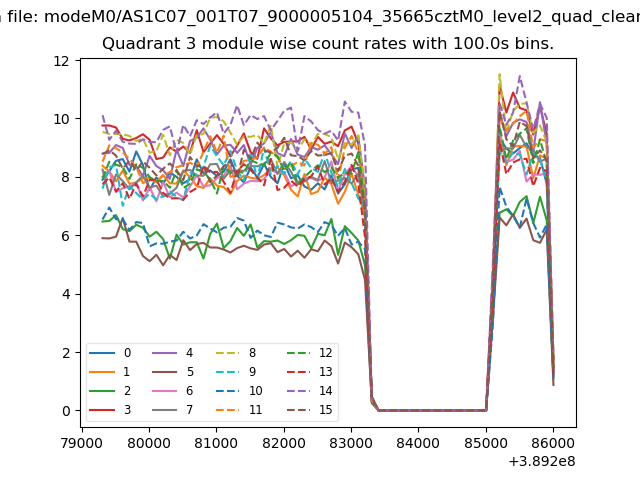
| Module-wise count rates for Quadrant A Data is divided into 100 sec bins |
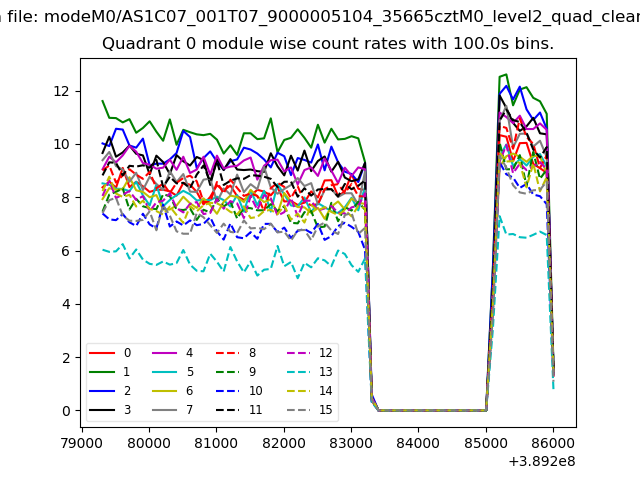 |
 |
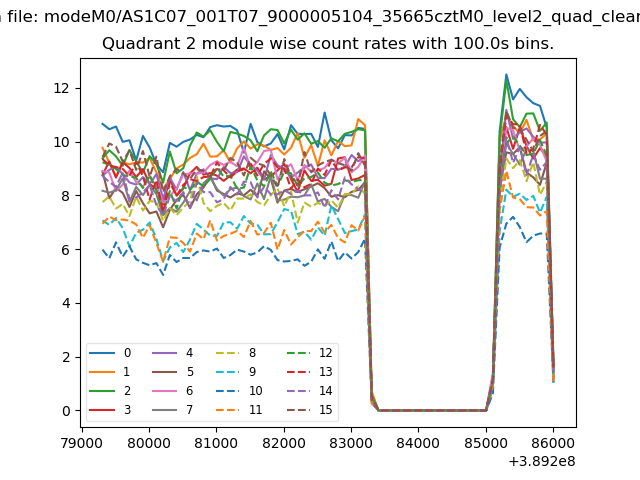
| Module-wise count rates for Quadrant B Data is divided into 100 sec bins |
 |
 |
| Module-wise count rates for Quadrant C Data is divided into 100 sec bins |
 |
 |
| Module-wise count rates for Quadrant D Data is divided into 100 sec bins |
 |
 |
| Parameter | Plot |
|---|---|
| CZT HV Monitor |  |
| D_VDD | 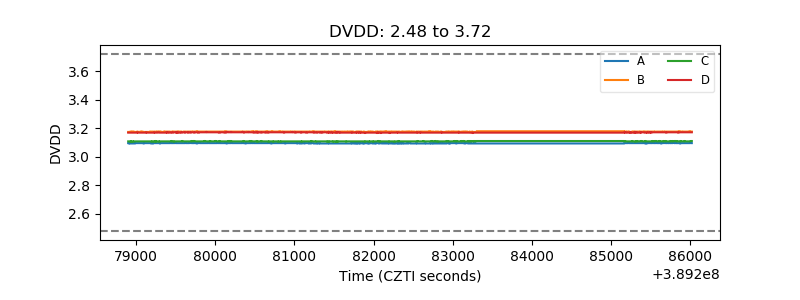 |
| Temperature 1 | 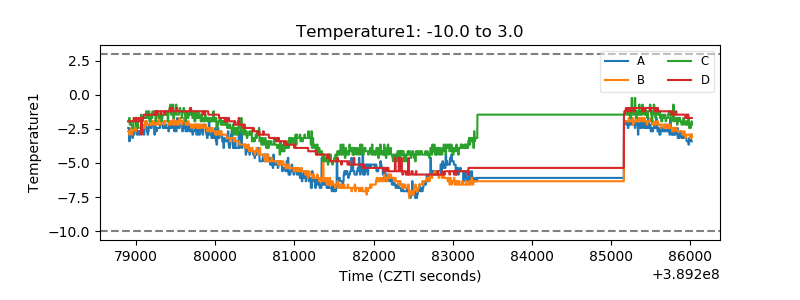 |
| Veto HV Monitor | 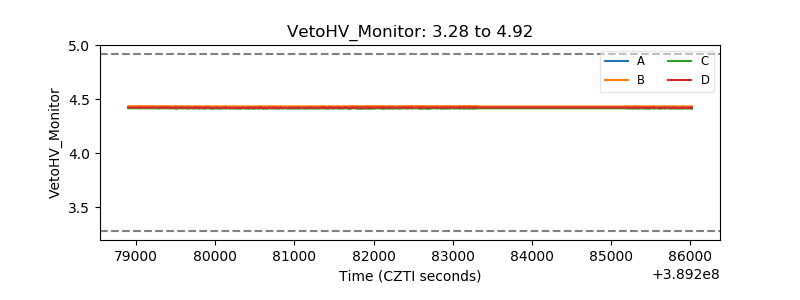 |
| Veto LLD | 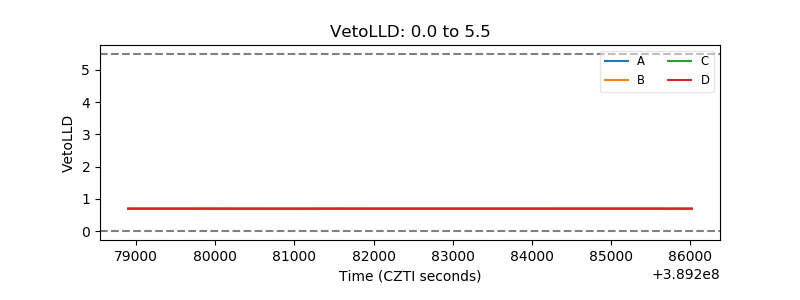 |
| Alpha Counter | 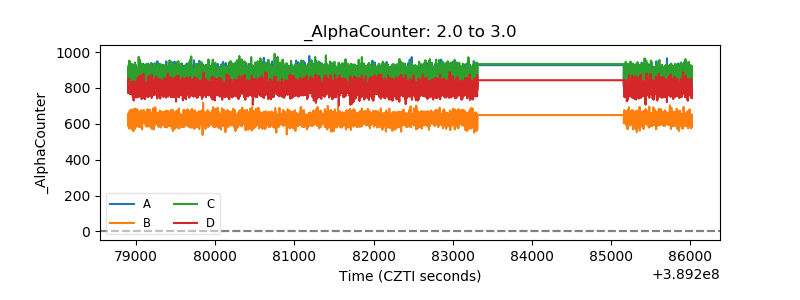 |
| _CPM_Rate | 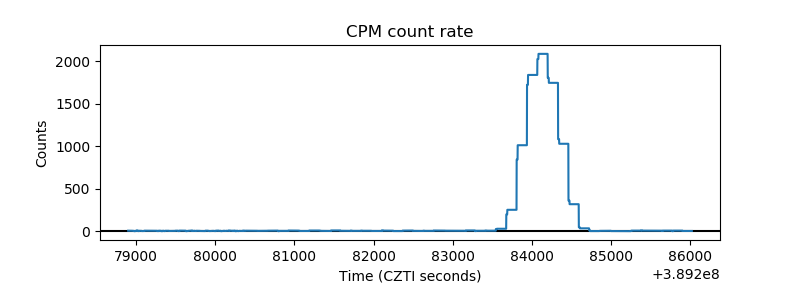 |
| CZT Counter | 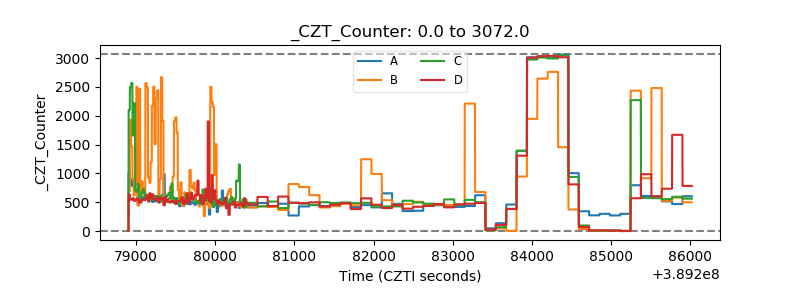 |
| +2.5 Volts monitor |  |
| +5 Volts monitor | 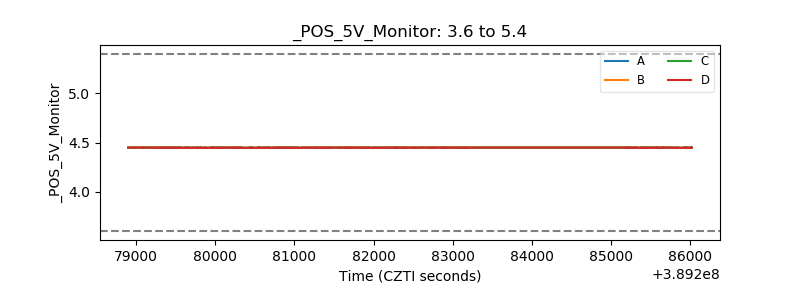 |
| _ROLL_ROT | 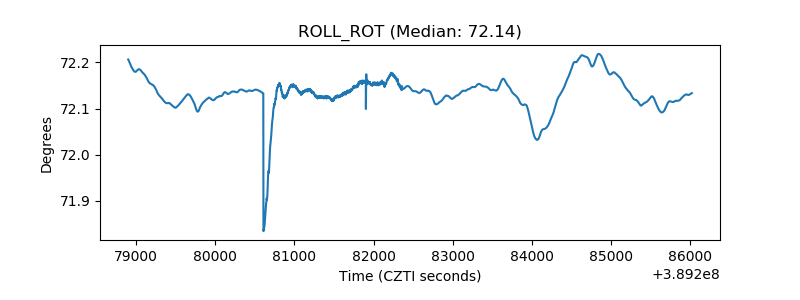 |
| _Roll_DEC |  |
| _Roll_RA | 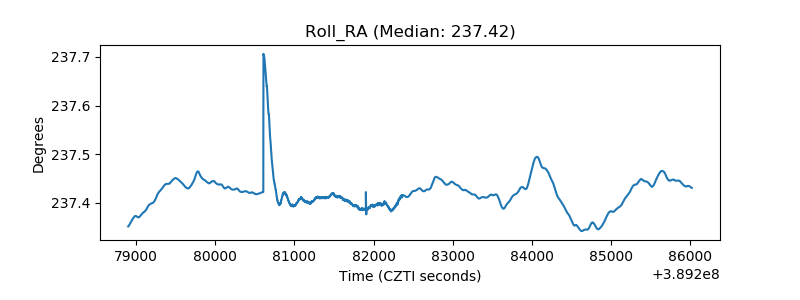 |
| Veto Counter | 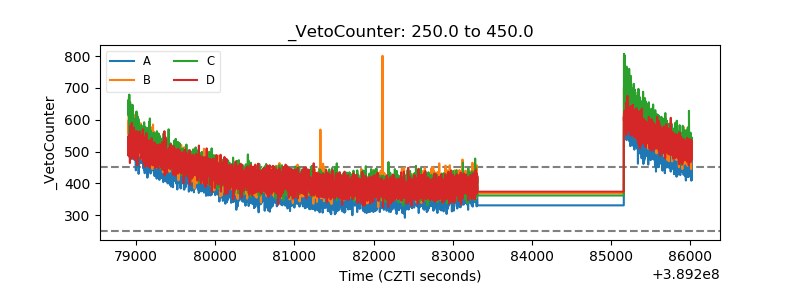 |