| Param | Original file | Final file |
|---|---|---|
| Filename | modeM0/AS1A09_029T02_9000005106cztM0_level2.fits | modeM0/AS1A09_029T02_9000005106cztM0_level2_quad_clean.evt |
| Size (bytes) | 347,149,440 | 375,200,640 |
| Size | 331.1 MB | 357.8 MB |
| Events in quadrant A | 2,108,846 | 2,339,729 |
| Events in quadrant B | 1,957,080 | 2,164,924 |
| Events in quadrant C | 2,056,394 | 2,231,411 |
| Events in quadrant D | 1,782,480 | 2,019,548 |
| Mode SS | |||
|---|---|---|---|
| Quadrant | BADHDUFLAG | Total packets | Discarded packets |
| A | 0 | 776 | 0 |
| B | 0 | 776 | 0 |
| C | 0 | 776 | 0 |
| D | 0 | 776 | 0 |
| Mode M0 | |||
|---|---|---|---|
| Quadrant | BADHDUFLAG | Total packets | Discarded packets |
| A | 0 | 78021 | 0 |
| B | 0 | 108558 | 0 |
| C | 0 | 85492 | 0 |
| D | 0 | 94356 | 0 |
| Mode M9 | |||
|---|---|---|---|
| Quadrant | BADHDUFLAG | Total packets | Discarded packets |
| A | 0 | 131 | 0 |
| B | 0 | 131 | 0 |
| C | 0 | 131 | 0 |
| D | 0 | 131 | 0 |
| Quadrant | Total seconds | Saturated seconds | Saturation percentage |
|---|---|---|---|
| A | 37959 | 56 | 0.147528% |
| B | 37959 | 2980 | 7.850576% |
| C | 37959 | 841 | 2.215548% |
| D | 37959 | 1247 | 3.285123% |
Noise dominated data is calculated using 1-second bins in cleaned event files. If a bin has >2000 counts, and if more than 50% of those come from <1% of pixels, then it is considered to be noise-dominated and hence unusable.
| Quadrant | # 1 sec bins | Bins with >0 counts | Bins with >2000 counts | High rate bins dominated by noise | Noise dominated (total time) | Noise dominated (detector-on time) | Marked lightcurve |
|---|---|---|---|---|---|---|---|
| A | 51067 | 37959 | 0 | 0 | 0.00% | 0.00% |  |
| B | 51067 | 37903 | 0 | 0 | 0.00% | 0.00% |  |
| C | 51067 | 37915 | 0 | 0 | 0.00% | 0.00% |  |
| D | 51067 | 37933 | 0 | 0 | 0.00% | 0.00% |  |
Top three noisy pixels from each quadrant. If the there are fewer than three noisy pixels in the level2.evt file, extra rows are filled as -1
| Pixel properties | Quadrant properties | ||||||
|---|---|---|---|---|---|---|---|
| Quadrant | DetID | PixID | Counts | Sigma | Mean | Median | Sigma |
| A | 7 | 110 | 1759 | 9.02 | 550 | 516 | 137.9 |
| A | 0 | 29 | 1722 | 8.75 | 550 | 516 | 137.9 |
| A | 9 | 19 | 1645 | 8.19 | 550 | 516 | 137.9 |
| B | 2 | 9 | 1671 | 11.54 | 517 | 493 | 102.1 |
| B | 3 | 17 | 1481 | 9.68 | 517 | 493 | 102.1 |
| B | 3 | 80 | 1469 | 9.56 | 517 | 493 | 102.1 |
| C | 1 | 81 | 1805 | 9.35 | 544 | 511 | 138.4 |
| C | 1 | 80 | 1730 | 8.81 | 544 | 511 | 138.4 |
| C | 1 | 65 | 1450 | 6.79 | 544 | 511 | 138.4 |
| D | 6 | 67 | 1336 | 6.38 | 510 | 465 | 136.4 |
| D | 3 | 14 | 1327 | 6.32 | 510 | 465 | 136.4 |
| D | 4 | 160 | 1292 | 6.06 | 510 | 465 | 136.4 |
Histogram calculated using DETX and DETY for each event in the final _common_clean file
| Quadrant A | 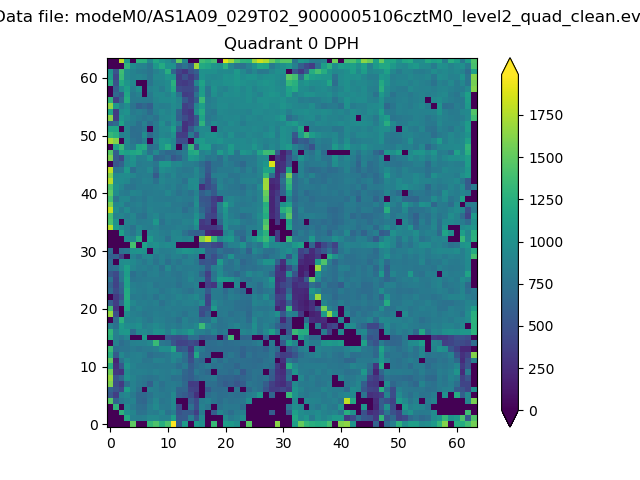 |
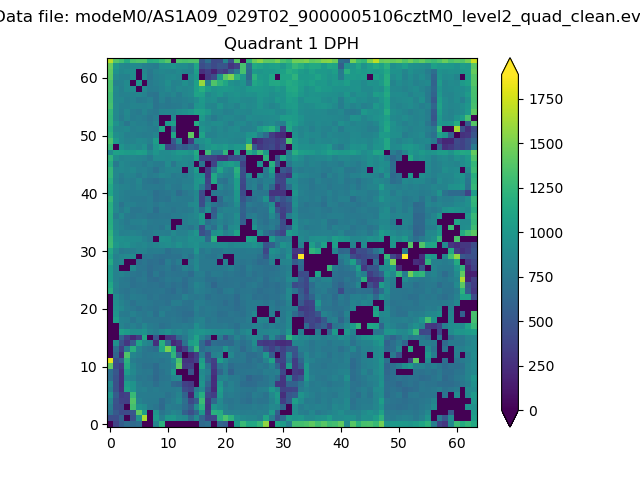 |
Quadrant B |
|---|---|---|---|
| Quadrant D | 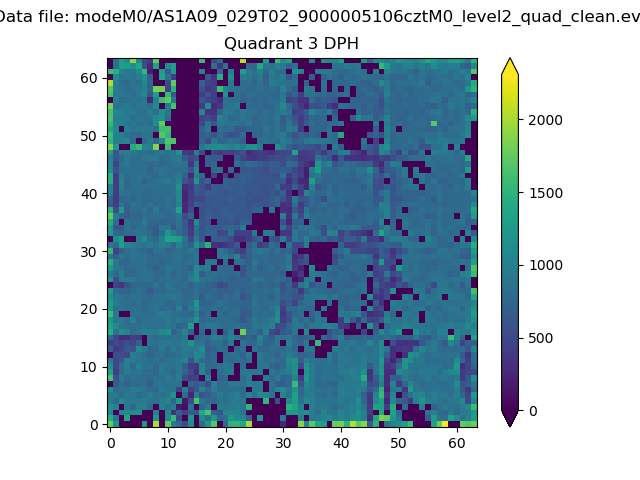 |
 |
Quadrant C |
| Plot type | Count rate plots | Images |
|---|---|---|
| Comparison with Poisson distribution Blue bars denote a histogram of data divided into 1 sec bins. Red curve is a Poisson curve with rate = median count rate of data. |
 |
 |
| Quadrant-wise count rates Data is divided into 100 sec bins |
 |
|
| Module-wise count rates for Quadrant A Data is divided into 100 sec bins |
 |
 |
| Module-wise count rates for Quadrant B Data is divided into 100 sec bins |
 |
 |
| Module-wise count rates for Quadrant C Data is divided into 100 sec bins |
 |
 |
| Module-wise count rates for Quadrant D Data is divided into 100 sec bins |
 |
 |
| Parameter | Plot |
|---|---|
| CZT HV Monitor |  |
| D_VDD |  |
| Temperature 1 |  |
| Veto HV Monitor |  |
| Veto LLD |  |
| Alpha Counter |  |
| _CPM_Rate |  |
| CZT Counter |  |
| +2.5 Volts monitor |  |
| +5 Volts monitor |  |
| _ROLL_ROT |  |
| _Roll_DEC |  |
| _Roll_RA |  |
| Veto Counter |  |