| Param | Original file | Final file |
|---|---|---|
| Filename | modeM0/AS1A09_029T02_9000005106_35669cztM0_level2.evt | modeM0/AS1A09_029T02_9000005106_35669cztM0_level2_quad_clean.evt |
| Size (bytes) | 395,593,920 | 62,579,520 |
| Size | 377.3 MB | 59.7 MB |
| Events in quadrant A | 2,473,921 | 395,679 |
| Events in quadrant B | 2,887,116 | 401,079 |
| Events in quadrant C | 3,232,794 | 376,496 |
| Events in quadrant D | 3,047,332 | 371,534 |
| Mode SS | |||
|---|---|---|---|
| Quadrant | BADHDUFLAG | Total packets | Discarded packets |
| A | 0 | 102 | 0 |
| B | 0 | 102 | 0 |
| C | 0 | 102 | 0 |
| D | 0 | 102 | 0 |
| Mode M0 | |||
|---|---|---|---|
| Quadrant | BADHDUFLAG | Total packets | Discarded packets |
| A | 0 | 10553 | 3 |
| B | 0 | 11677 | 2 |
| C | 0 | 12710 | 2 |
| D | 0 | 12400 | 2 |
| Mode M9 | |||
|---|---|---|---|
| Quadrant | BADHDUFLAG | Total packets | Discarded packets |
| A | 0 | 31 | 0 |
| B | 0 | 31 | 0 |
| C | 0 | 31 | 0 |
| D | 0 | 32 | 0 |
| Quadrant | Total seconds | Saturated seconds | Saturation percentage |
|---|---|---|---|
| A | 4987 | 9 | 0.180469% |
| B | 4987 | 118 | 2.366152% |
| C | 4987 | 266 | 5.333868% |
| D | 4987 | 153 | 3.067977% |
Noise dominated data is calculated using 1-second bins in cleaned event files. If a bin has >2000 counts, and if more than 50% of those come from <1% of pixels, then it is considered to be noise-dominated and hence unusable.
| Quadrant | # 1 sec bins | Bins with >0 counts | Bins with >2000 counts | High rate bins dominated by noise | Noise dominated (total time) | Noise dominated (detector-on time) | Marked lightcurve |
|---|---|---|---|---|---|---|---|
| A | 7079 | 4988 | 2 | 2 | 0.03% | 0.04% | 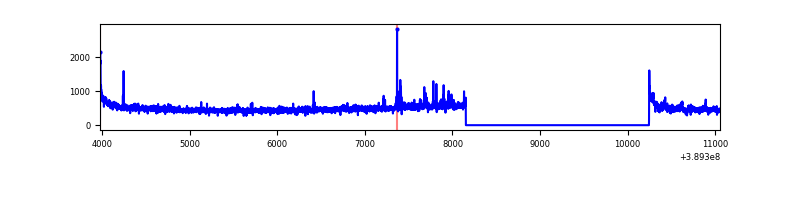 |
| B | 7079 | 4988 | 88 | 88 | 1.24% | 1.76% | 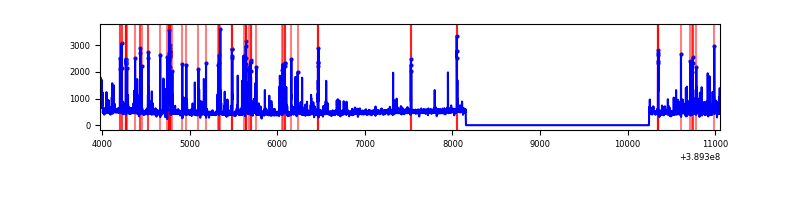 |
| C | 7079 | 4988 | 217 | 217 | 3.07% | 4.35% | 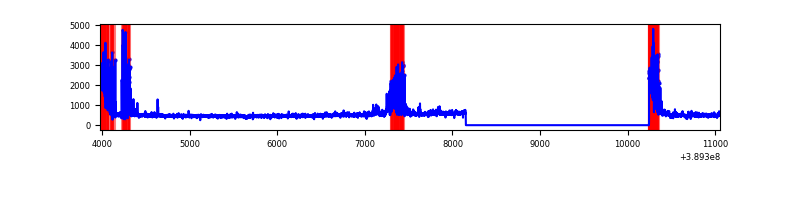 |
| D | 7079 | 4988 | 123 | 123 | 1.74% | 2.47% | 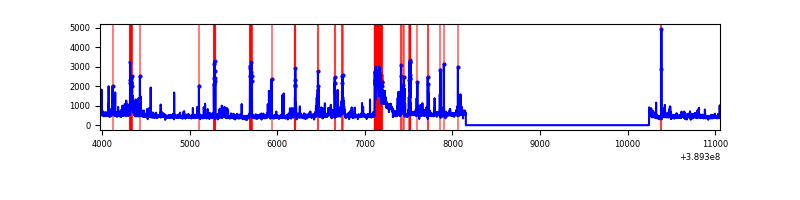 |
Top three noisy pixels from each quadrant. If the there are fewer than three noisy pixels in the level2.evt file, extra rows are filled as -1
| Pixel properties | Quadrant properties | ||||||
|---|---|---|---|---|---|---|---|
| Quadrant | DetID | PixID | Counts | Sigma | Mean | Median | Sigma |
| A | 10 | 83 | 137208 | 1160.74 | 582 | 572 | 117.7 |
| A | 7 | 16 | 49795 | 418.16 | 582 | 572 | 117.7 |
| A | 15 | 169 | 20721 | 171.17 | 582 | 572 | 117.7 |
| B | 5 | 172 | 469263 | 4250.74 | 579 | 566 | 110.3 |
| B | 5 | 255 | 74592 | 671.36 | 579 | 566 | 110.3 |
| B | 5 | 200 | 29259 | 260.22 | 579 | 566 | 110.3 |
| C | 0 | 10 | 436616 | 3365.68 | 555 | 559 | 129.6 |
| C | 9 | 187 | 288191 | 2220.07 | 555 | 559 | 129.6 |
| C | 15 | 214 | 203881 | 1569.33 | 555 | 559 | 129.6 |
| D | 13 | 249 | 473506 | 3494.15 | 557 | 542 | 135.4 |
| D | 8 | 195 | 84733 | 621.98 | 557 | 542 | 135.4 |
| D | 2 | 249 | 83488 | 612.79 | 557 | 542 | 135.4 |
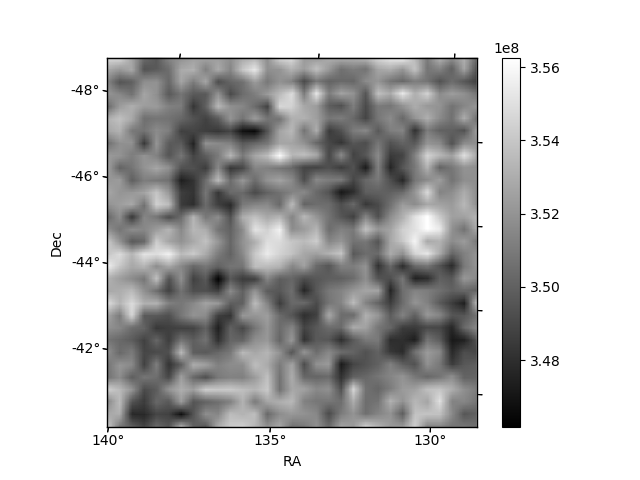
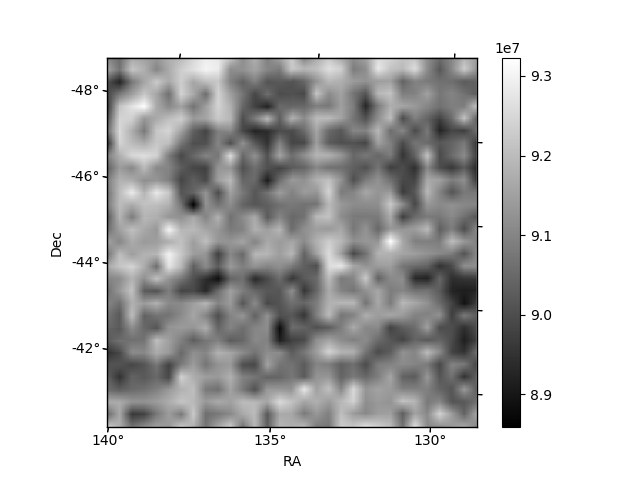
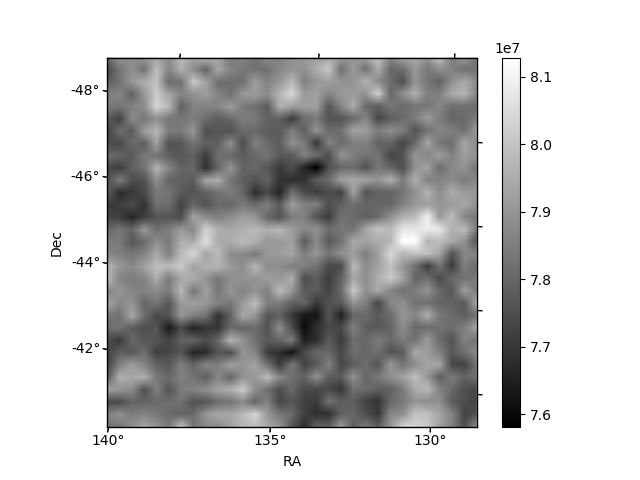
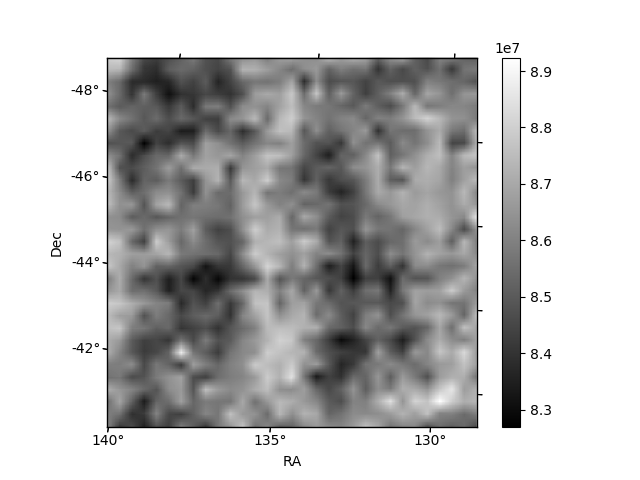
Histogram calculated using DETX and DETY for each event in the final _common_clean file
| Quadrant A | 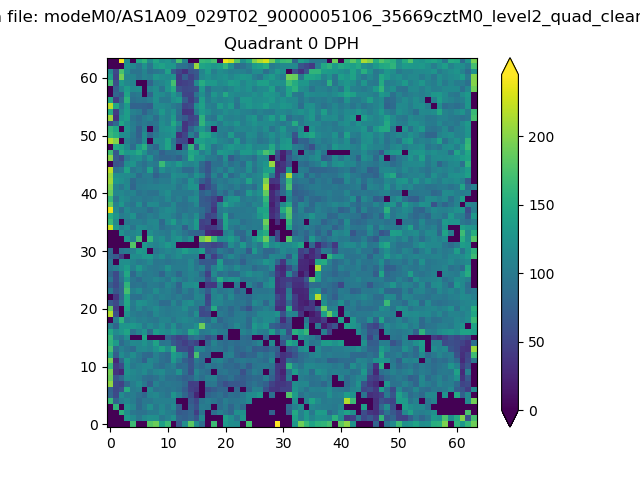 |
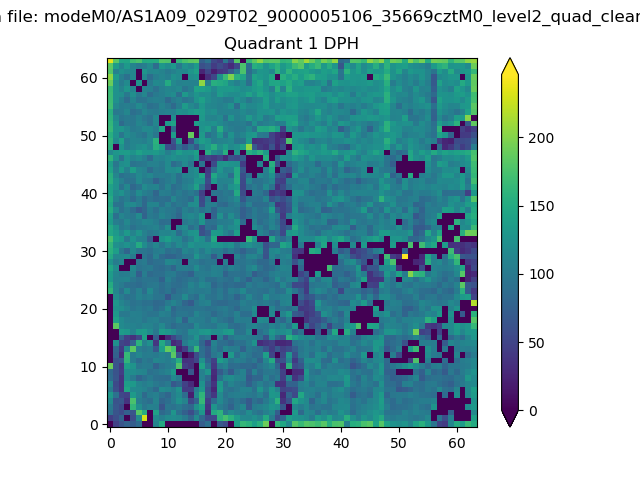 |
Quadrant B |
|---|---|---|---|
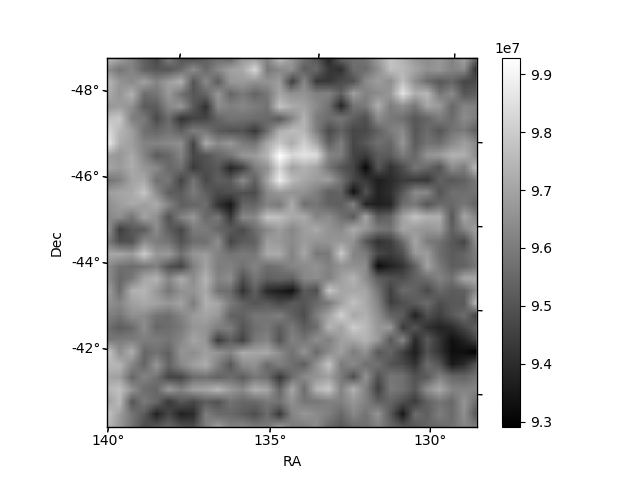
| Quadrant D | 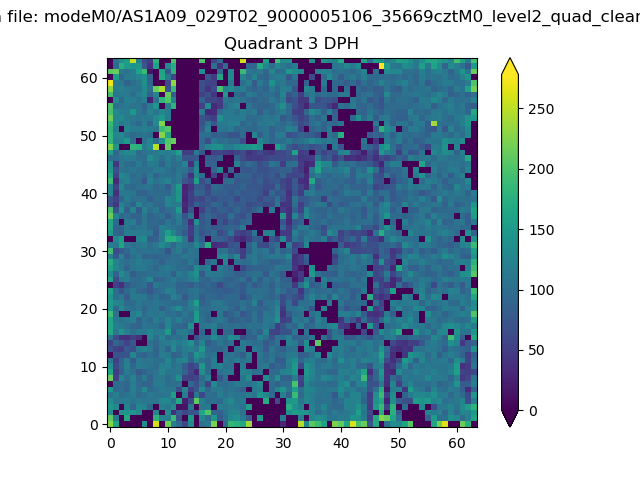 |
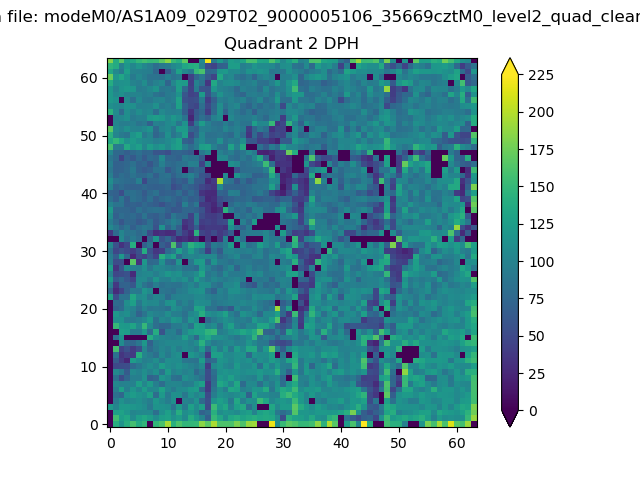 |
Quadrant C |
| Plot type | Count rate plots | Images |
|---|---|---|
| Comparison with Poisson distribution Blue bars denote a histogram of data divided into 1 sec bins. Red curve is a Poisson curve with rate = median count rate of data. |
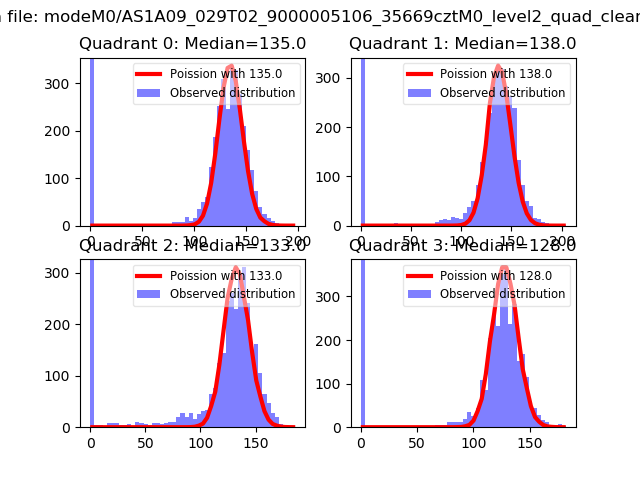 |
 |
| Quadrant-wise count rates Data is divided into 100 sec bins |
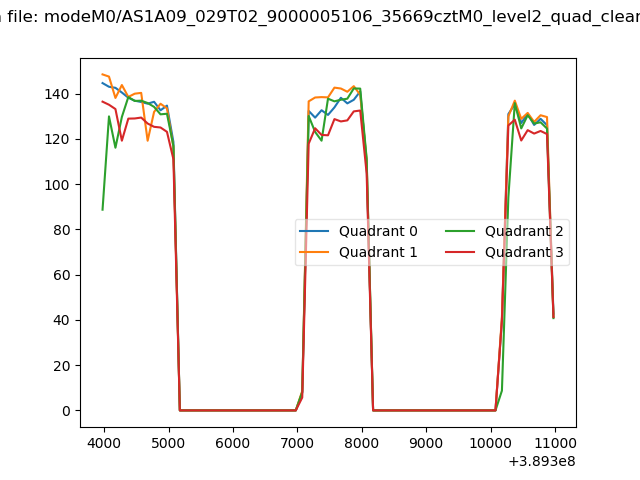 |
|
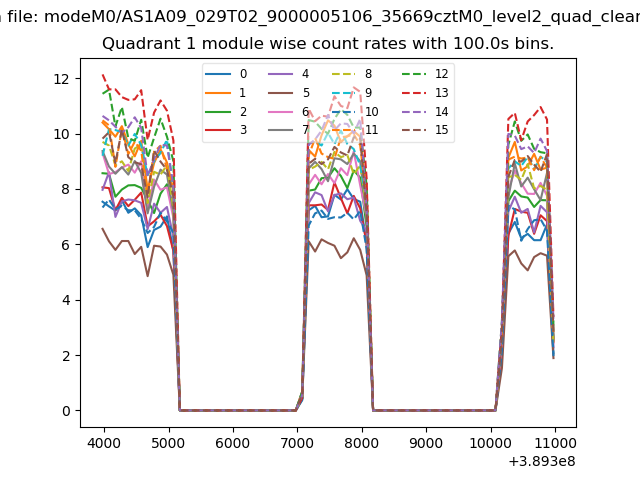
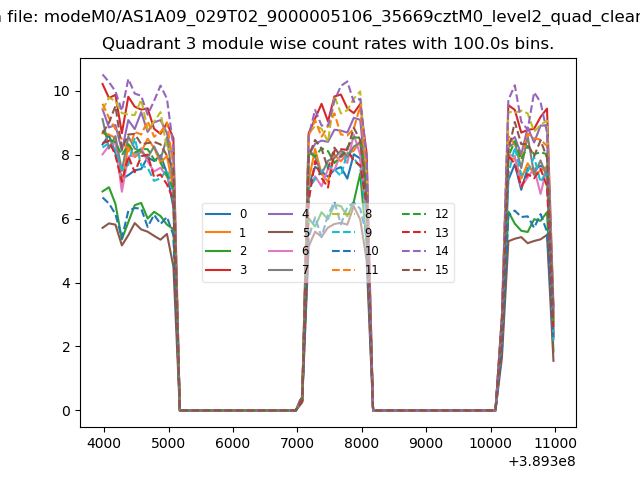
| Module-wise count rates for Quadrant A Data is divided into 100 sec bins |
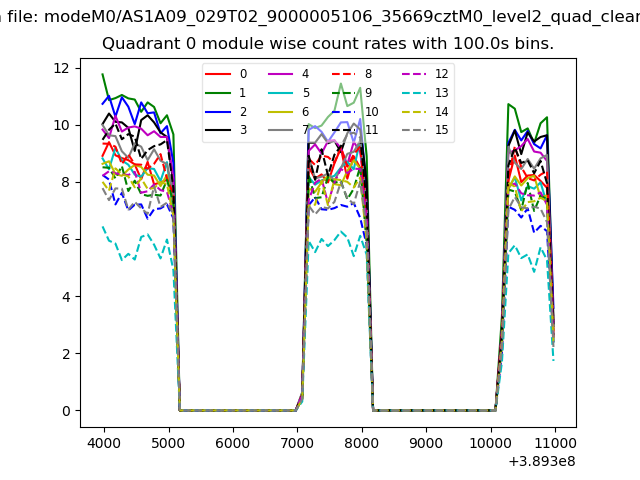 |
 |
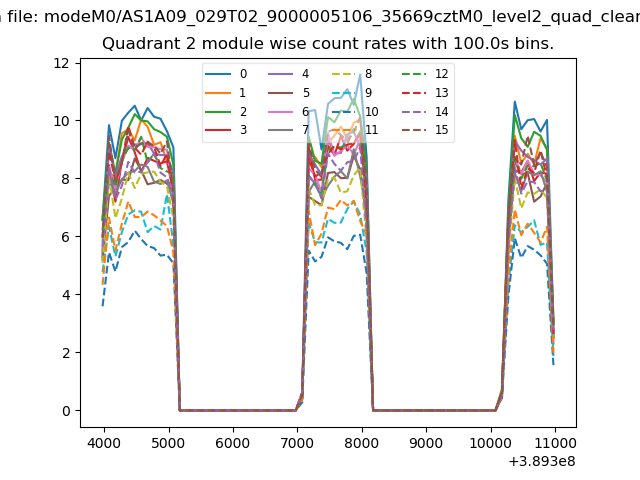
| Module-wise count rates for Quadrant B Data is divided into 100 sec bins |
 |
 |
| Module-wise count rates for Quadrant C Data is divided into 100 sec bins |
 |
 |
| Module-wise count rates for Quadrant D Data is divided into 100 sec bins |
 |
 |
| Parameter | Plot |
|---|---|
| CZT HV Monitor | 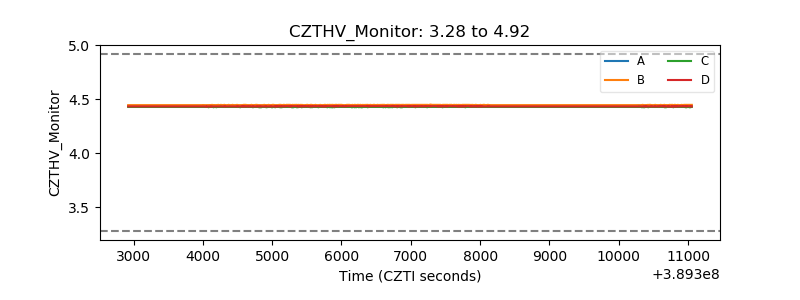 |
| D_VDD | 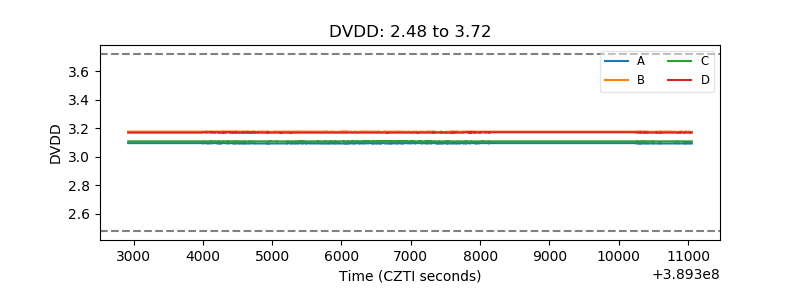 |
| Temperature 1 | 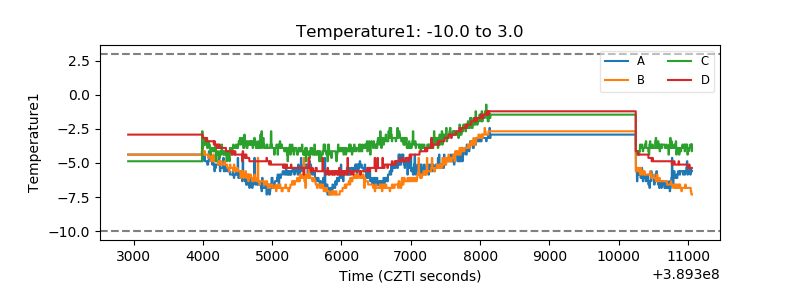 |
| Veto HV Monitor |  |
| Veto LLD | 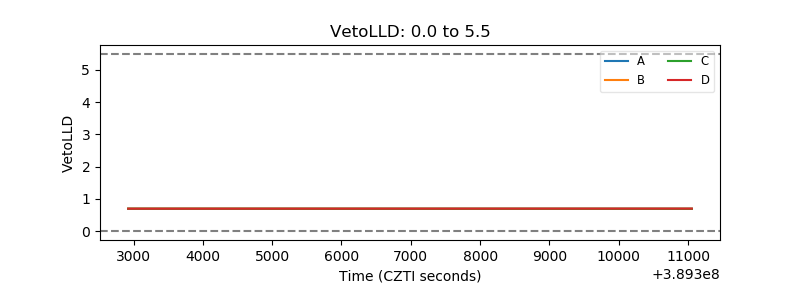 |
| Alpha Counter | 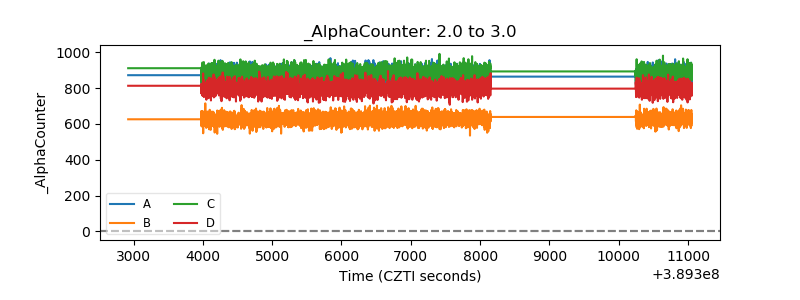 |
| _CPM_Rate | 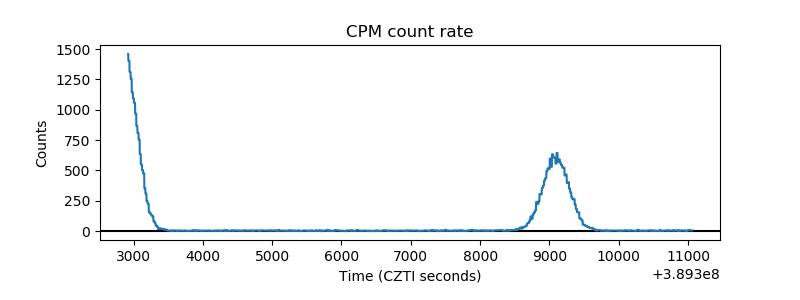 |
| CZT Counter | 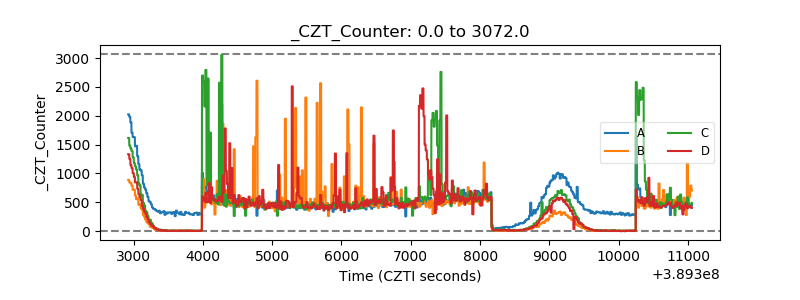 |
| +2.5 Volts monitor |  |
| +5 Volts monitor |  |
| _ROLL_ROT | 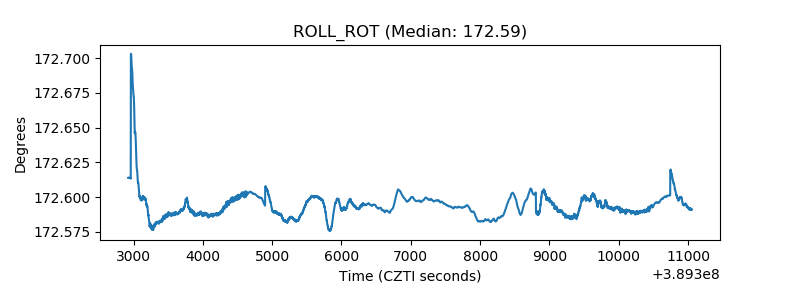 |
| _Roll_DEC | 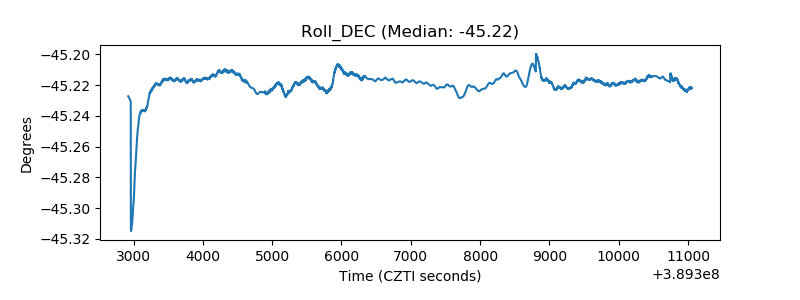 |
| _Roll_RA | 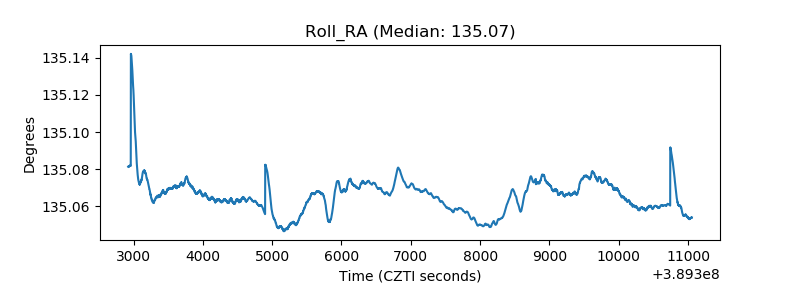 |
| Veto Counter | 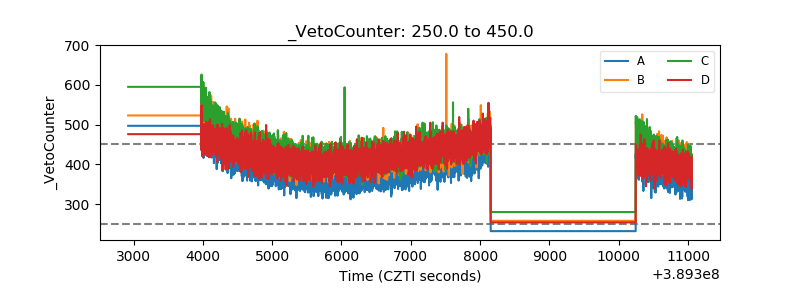 |