| Param | Original file | Final file |
|---|---|---|
| Filename | modeM0/AS1A09_029T03_9000005108cztM0_level2.fits | modeM0/AS1A09_029T03_9000005108cztM0_level2_quad_clean.evt |
| Size (bytes) | 224,331,840 | 179,375,040 |
| Size | 213.9 MB | 171.1 MB |
| Events in quadrant A | 1,402,890 | 1,020,691 |
| Events in quadrant B | 1,275,364 | 975,269 |
| Events in quadrant C | 1,326,746 | 951,767 |
| Events in quadrant D | 1,170,948 | 866,058 |
| Mode SS | |||
|---|---|---|---|
| Quadrant | BADHDUFLAG | Total packets | Discarded packets |
| A | 0 | 484 | 0 |
| B | 0 | 484 | 0 |
| C | 0 | 484 | 0 |
| D | 0 | 482 | 0 |
| Mode M9 | |||
|---|---|---|---|
| Quadrant | BADHDUFLAG | Total packets | Discarded packets |
| A | 0 | 111 | 0 |
| B | 0 | 111 | 0 |
| C | 0 | 111 | 0 |
| D | 0 | 111 | 0 |
| Mode M0 | |||
|---|---|---|---|
| Quadrant | BADHDUFLAG | Total packets | Discarded packets |
| A | 0 | 49503 | 0 |
| B | 0 | 69947 | 0 |
| C | 0 | 53038 | 0 |
| D | 0 | 55826 | 0 |
| Quadrant | Total seconds | Saturated seconds | Saturation percentage |
|---|---|---|---|
| A | 23496 | 33 | 0.140449% |
| B | 23496 | 1938 | 8.248212% |
| C | 23497 | 449 | 1.910882% |
| D | 23496 | 562 | 2.391896% |
Noise dominated data is calculated using 1-second bins in cleaned event files. If a bin has >2000 counts, and if more than 50% of those come from <1% of pixels, then it is considered to be noise-dominated and hence unusable.
| Quadrant | # 1 sec bins | Bins with >0 counts | Bins with >2000 counts | High rate bins dominated by noise | Noise dominated (total time) | Noise dominated (detector-on time) | Marked lightcurve |
|---|---|---|---|---|---|---|---|
| A | 34674 | 23497 | 0 | 0 | 0.00% | 0.00% | 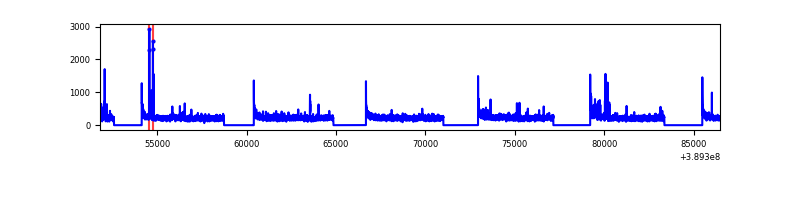 |
| B | 34674 | 23465 | 0 | 0 | 0.00% | 0.00% |  |
| C | 34674 | 23486 | 0 | 0 | 0.00% | 0.00% | 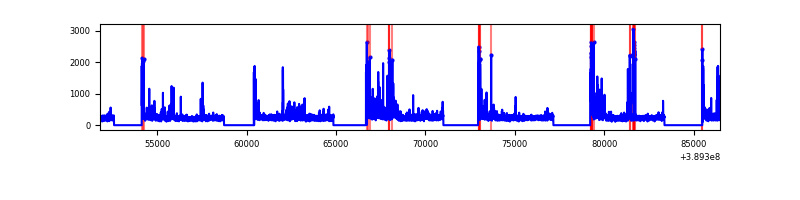 |
| D | 34674 | 23488 | 0 | 0 | 0.00% | 0.00% | 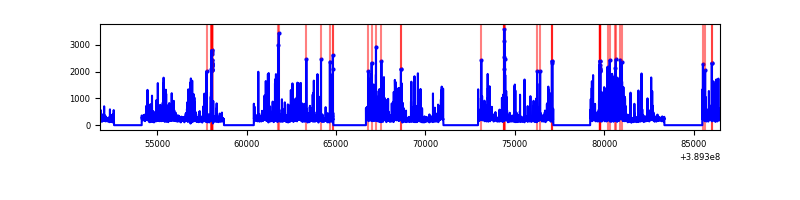 |
Top three noisy pixels from each quadrant. If the there are fewer than three noisy pixels in the level2.evt file, extra rows are filled as -1
| Pixel properties | Quadrant properties | ||||||
|---|---|---|---|---|---|---|---|
| Quadrant | DetID | PixID | Counts | Sigma | Mean | Median | Sigma |
| A | 9 | 19 | 1168 | 9.08 | 366 | 347 | 90.4 |
| A | 0 | 29 | 1159 | 8.98 | 366 | 347 | 90.4 |
| A | 7 | 110 | 1147 | 8.85 | 366 | 347 | 90.4 |
| B | 2 | 9 | 1121 | 11.83 | 337 | 323 | 67.4 |
| B | 3 | 80 | 967 | 9.55 | 337 | 323 | 67.4 |
| B | 2 | 8 | 922 | 8.88 | 337 | 323 | 67.4 |
| C | 1 | 81 | 1064 | 8.0 | 350 | 329 | 91.9 |
| C | 1 | 80 | 1063 | 7.99 | 350 | 329 | 91.9 |
| C | 3 | 203 | 1034 | 7.68 | 350 | 329 | 91.9 |
| D | 3 | 14 | 878 | 6.38 | 334 | 305 | 89.8 |
| D | 6 | 62 | 862 | 6.2 | 334 | 305 | 89.8 |
| D | 4 | 160 | 849 | 6.06 | 334 | 305 | 89.8 |
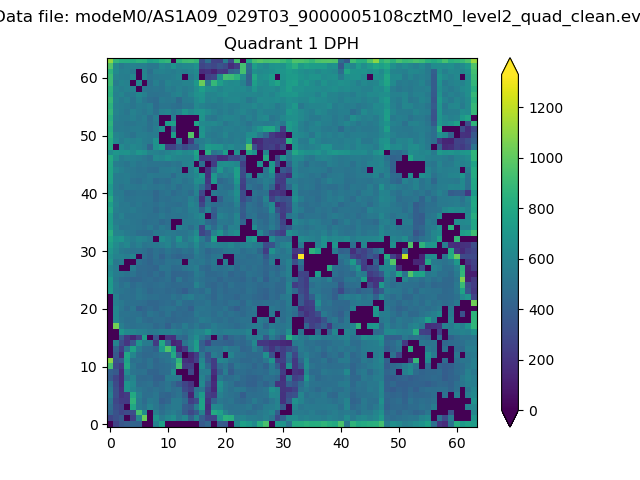
Histogram calculated using DETX and DETY for each event in the final _common_clean file
| Quadrant A |  |
 |
Quadrant B |
|---|---|---|---|
| Quadrant D | 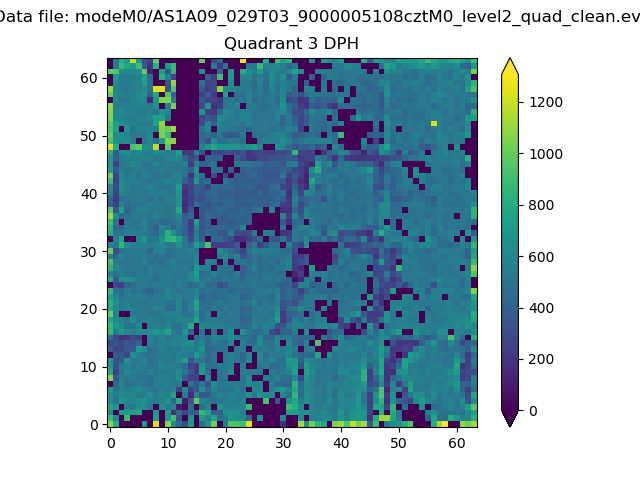 |
 |
Quadrant C |
| Plot type | Count rate plots | Images |
|---|---|---|
| Comparison with Poisson distribution Blue bars denote a histogram of data divided into 1 sec bins. Red curve is a Poisson curve with rate = median count rate of data. |
 |
 |
| Quadrant-wise count rates Data is divided into 100 sec bins |
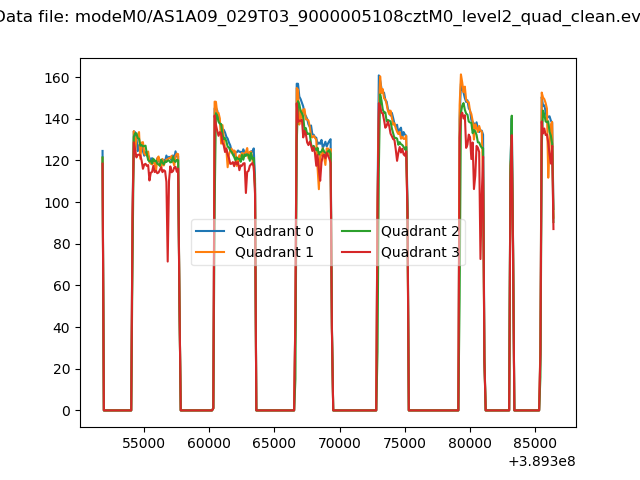 |
|
| Module-wise count rates for Quadrant A Data is divided into 100 sec bins |
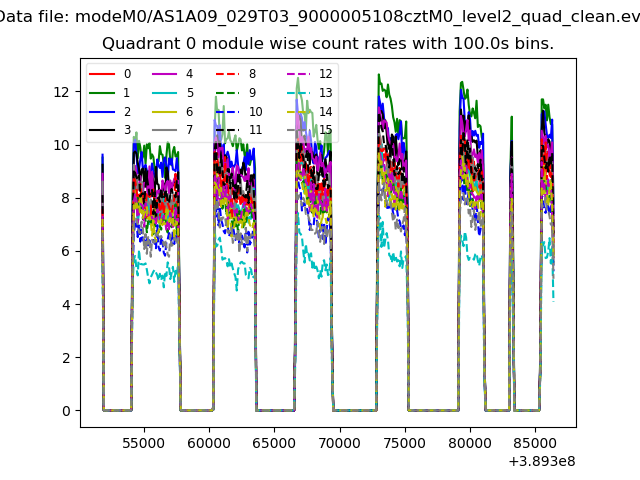 |
 |
| Module-wise count rates for Quadrant B Data is divided into 100 sec bins |
 |
 |
| Module-wise count rates for Quadrant C Data is divided into 100 sec bins |
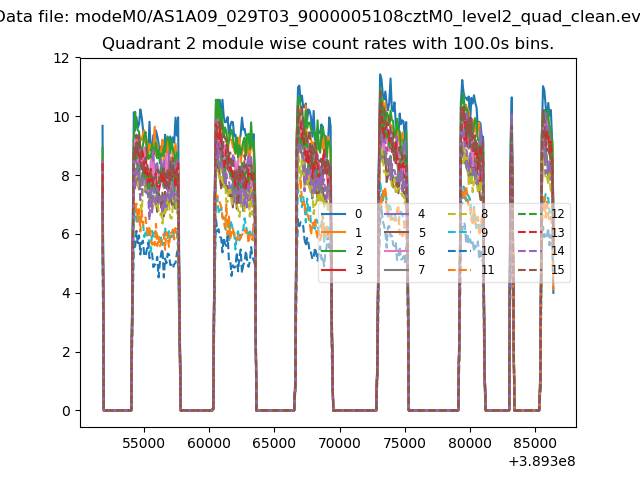 |
 |
| Module-wise count rates for Quadrant D Data is divided into 100 sec bins |
 |
 |
| Parameter | Plot |
|---|---|
| CZT HV Monitor |  |
| D_VDD | 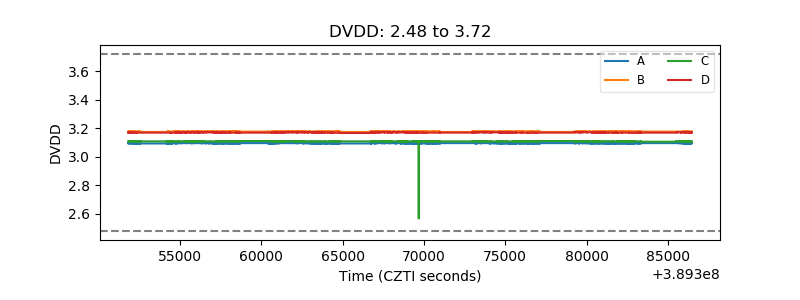 |
| Temperature 1 | 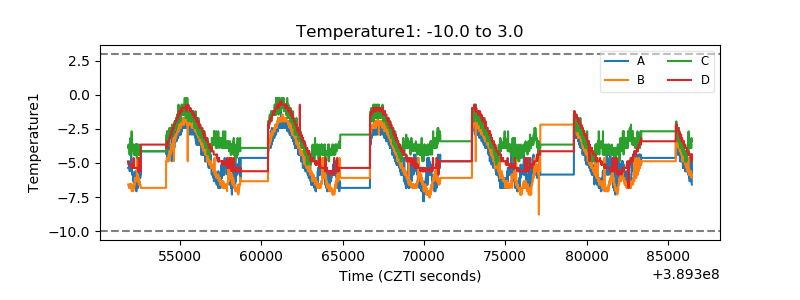 |
| Veto HV Monitor |  |
| Veto LLD | 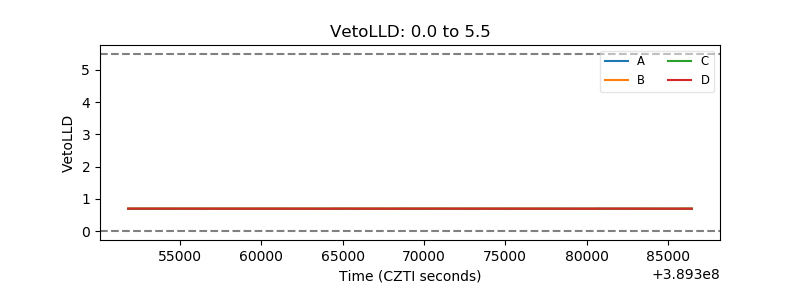 |
| Alpha Counter | 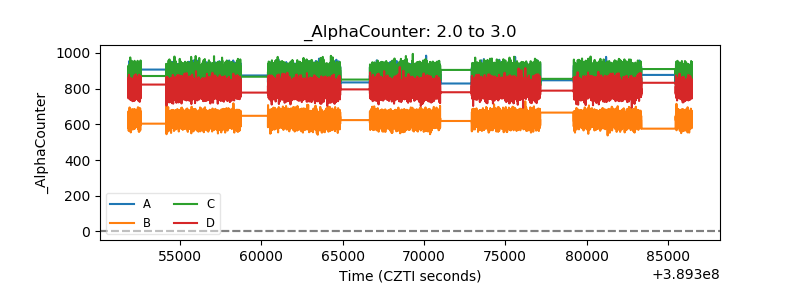 |
| _CPM_Rate | 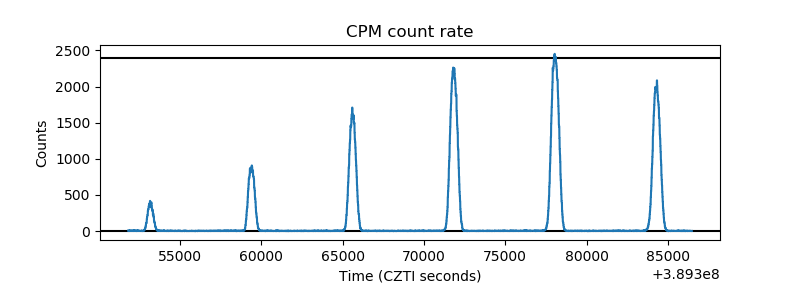 |
| CZT Counter |  |
| +2.5 Volts monitor |  |
| +5 Volts monitor | 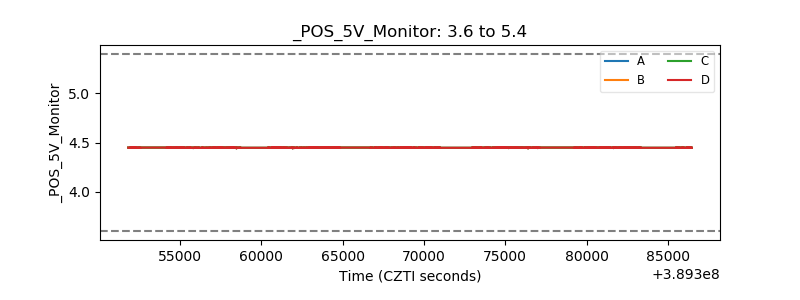 |
| _ROLL_ROT |  |
| _Roll_DEC |  |
| _Roll_RA |  |
| Veto Counter |  |