| Param | Original file | Final file |
|---|---|---|
| Filename | modeM0/AS1A09_029T04_9000005110_35695cztM0_level2.evt | modeM0/AS1A09_029T04_9000005110_35695cztM0_level2_quad_clean.evt |
| Size (bytes) | 159,716,160 | 41,578,560 |
| Size | 152.3 MB | 39.7 MB |
| Events in quadrant A | 1,127,077 | 278,336 |
| Events in quadrant B | 1,152,862 | 279,680 |
| Events in quadrant C | 1,045,785 | 277,411 |
| Events in quadrant D | 1,358,232 | 263,137 |
| Mode SS | |||
|---|---|---|---|
| Quadrant | BADHDUFLAG | Total packets | Discarded packets |
| A | 0 | 44 | 0 |
| B | 0 | 44 | 0 |
| C | 0 | 44 | 0 |
| D | 0 | 44 | 0 |
| Mode M0 | |||
|---|---|---|---|
| Quadrant | BADHDUFLAG | Total packets | Discarded packets |
| A | 0 | 4697 | 0 |
| B | 0 | 4912 | 0 |
| C | 0 | 4512 | 0 |
| D | 0 | 5543 | 0 |
| Quadrant | Total seconds | Saturated seconds | Saturation percentage |
|---|---|---|---|
| A | 2218 | 2 | 0.090171% |
| B | 2218 | 35 | 1.577998% |
| C | 2218 | 0 | 0.000000% |
| D | 2218 | 63 | 2.840397% |
Noise dominated data is calculated using 1-second bins in cleaned event files. If a bin has >2000 counts, and if more than 50% of those come from <1% of pixels, then it is considered to be noise-dominated and hence unusable.
| Quadrant | # 1 sec bins | Bins with >0 counts | Bins with >2000 counts | High rate bins dominated by noise | Noise dominated (total time) | Noise dominated (detector-on time) | Marked lightcurve |
|---|---|---|---|---|---|---|---|
| A | 2218 | 2218 | 0 | 0 | 0.00% | 0.00% | 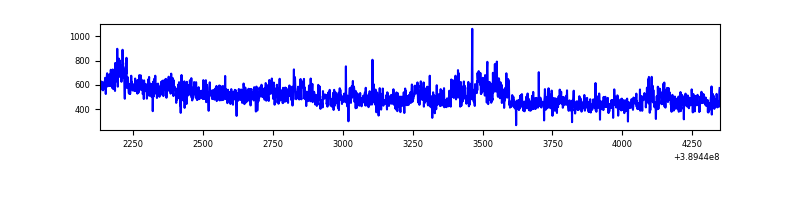 |
| B | 2218 | 2218 | 30 | 30 | 1.35% | 1.35% | 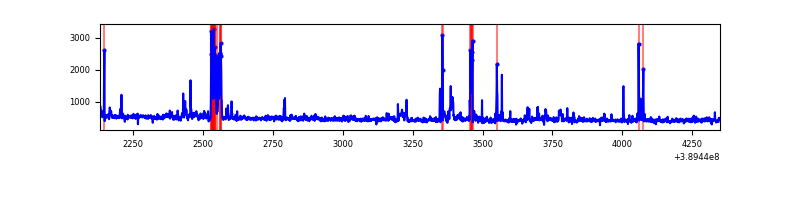 |
| C | 2218 | 2218 | 0 | 0 | 0.00% | 0.00% |  |
| D | 2218 | 2218 | 55 | 55 | 2.48% | 2.48% | 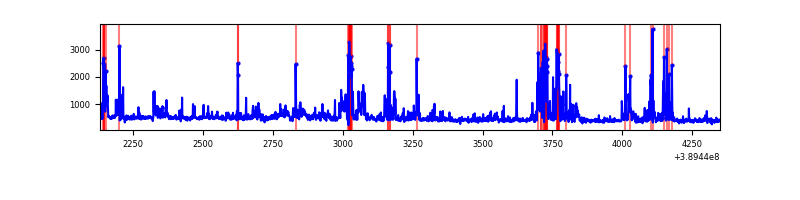 |
Top three noisy pixels from each quadrant. If the there are fewer than three noisy pixels in the level2.evt file, extra rows are filled as -1
| Pixel properties | Quadrant properties | ||||||
|---|---|---|---|---|---|---|---|
| Quadrant | DetID | PixID | Counts | Sigma | Mean | Median | Sigma |
| A | 15 | 169 | 88588 | 1627.49 | 256 | 251 | 54.3 |
| A | 10 | 83 | 36778 | 672.96 | 256 | 251 | 54.3 |
| A | 13 | 6 | 8627 | 154.32 | 256 | 251 | 54.3 |
| B | 5 | 172 | 96811 | 1949.09 | 249 | 243 | 49.5 |
| B | 5 | 255 | 41682 | 836.39 | 249 | 243 | 49.5 |
| B | 15 | 85 | 15928 | 316.58 | 249 | 243 | 49.5 |
| C | 15 | 214 | 91968 | 1590.45 | 243 | 244 | 57.7 |
| C | 4 | 254 | 4488 | 73.58 | 243 | 244 | 57.7 |
| C | 13 | 61 | 1643 | 24.25 | 243 | 244 | 57.7 |
| D | 2 | 250 | 239393 | 3871.12 | 246 | 238 | 61.8 |
| D | 10 | 118 | 93025 | 1501.91 | 246 | 238 | 61.8 |
| D | 13 | 249 | 44844 | 722.02 | 246 | 238 | 61.8 |
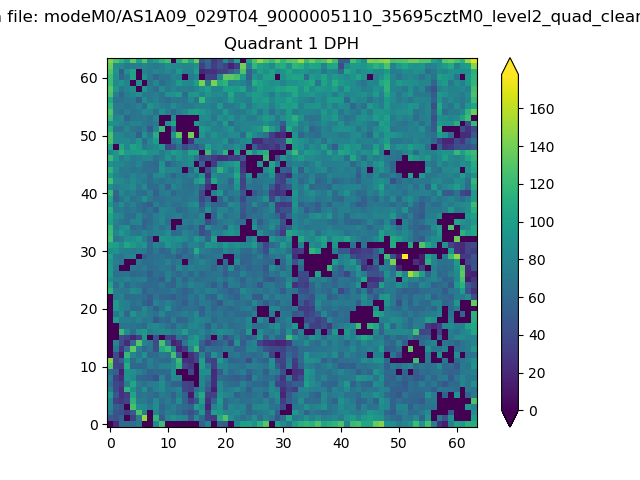
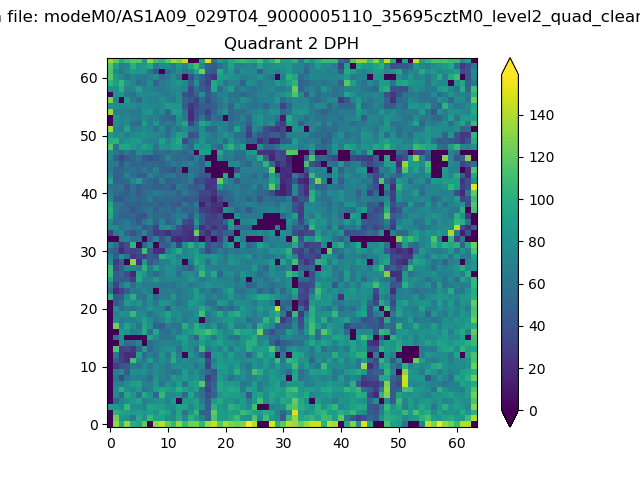
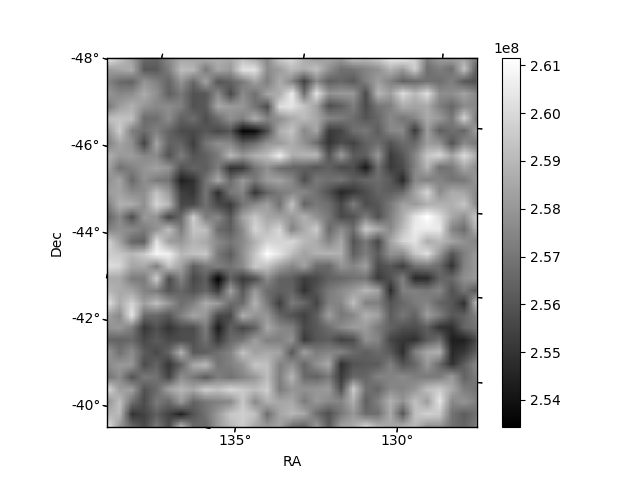
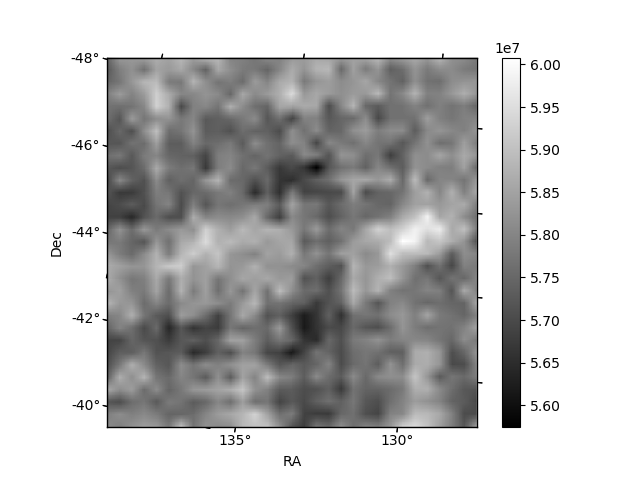
Histogram calculated using DETX and DETY for each event in the final _common_clean file
| Quadrant A | 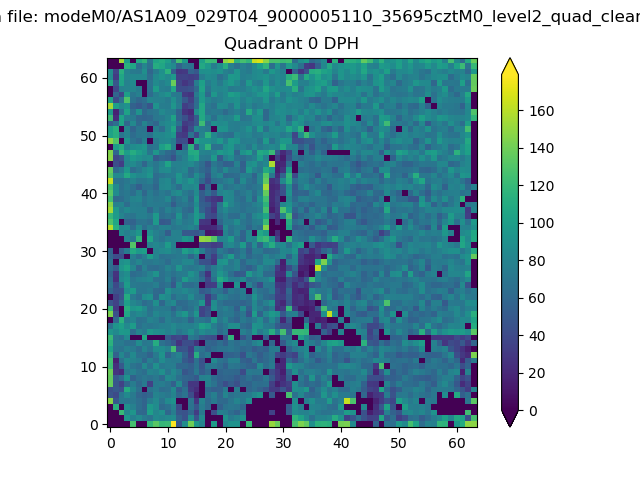 |
 |
Quadrant B |
|---|---|---|---|
| Quadrant D | 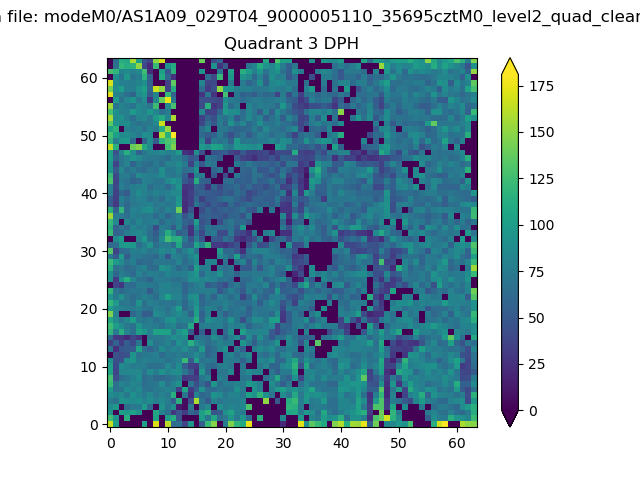 |
 |
Quadrant C |
| Plot type | Count rate plots | Images |
|---|---|---|
| Comparison with Poisson distribution Blue bars denote a histogram of data divided into 1 sec bins. Red curve is a Poisson curve with rate = median count rate of data. |
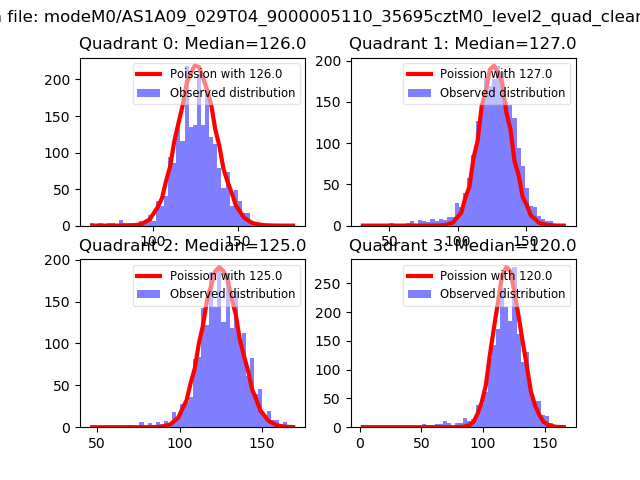 |
 |
| Quadrant-wise count rates Data is divided into 100 sec bins |
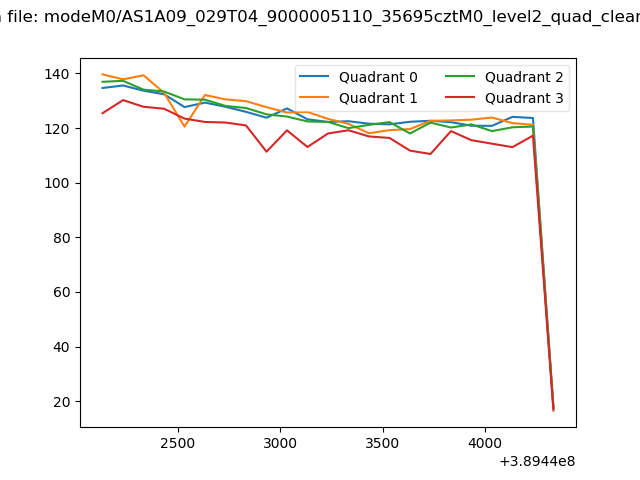 |
|
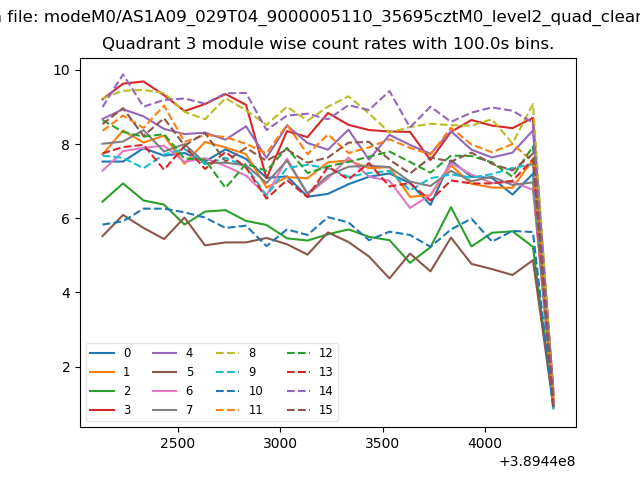
| Module-wise count rates for Quadrant A Data is divided into 100 sec bins |
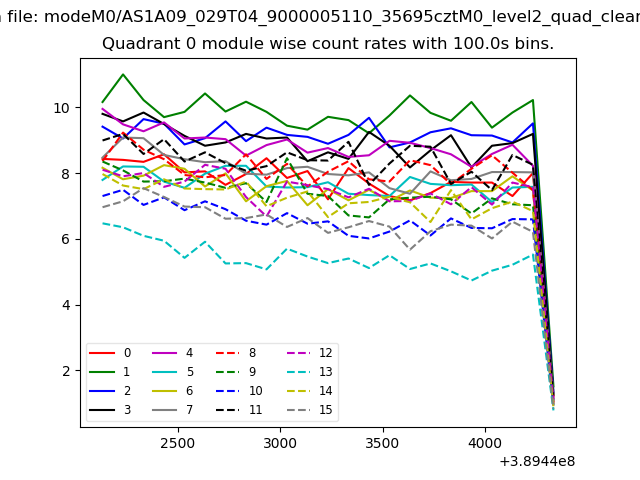 |
 |
| Module-wise count rates for Quadrant B Data is divided into 100 sec bins |
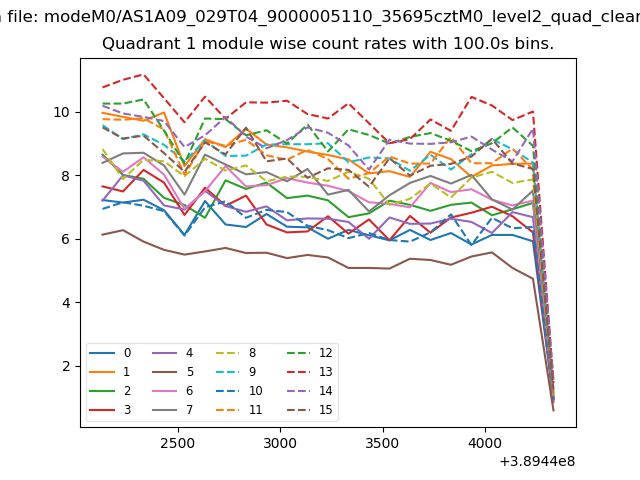 |
 |
| Module-wise count rates for Quadrant C Data is divided into 100 sec bins |
 |
 |
| Module-wise count rates for Quadrant D Data is divided into 100 sec bins |
 |
 |
| Parameter | Plot |
|---|---|
| CZT HV Monitor |  |
| D_VDD | 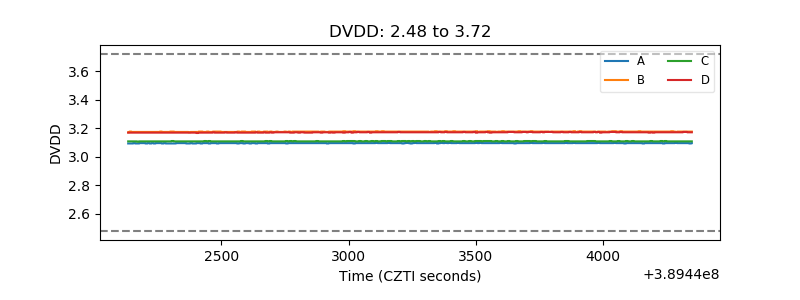 |
| Temperature 1 | 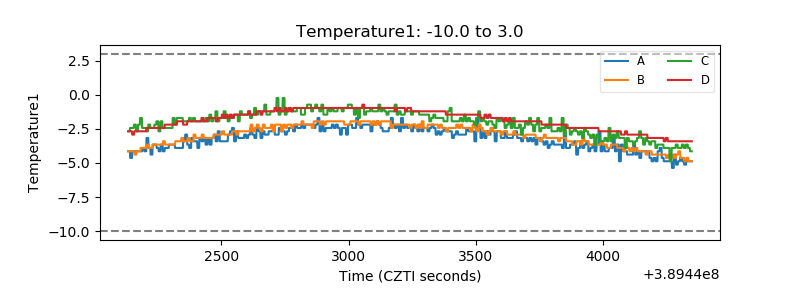 |
| Veto HV Monitor | 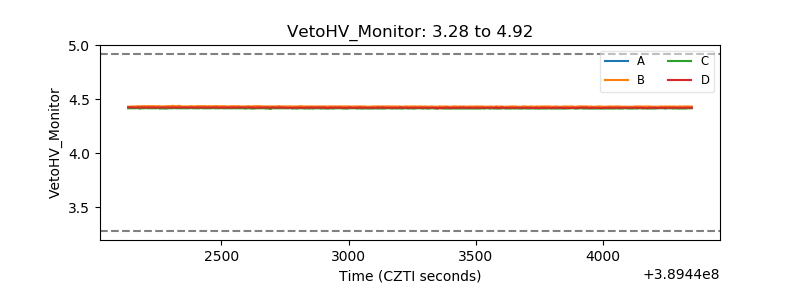 |
| Veto LLD | 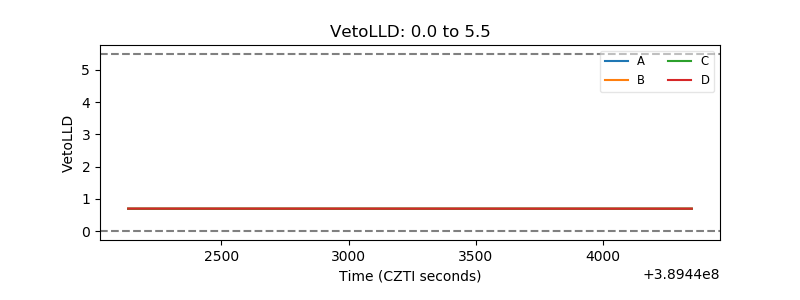 |
| Alpha Counter | 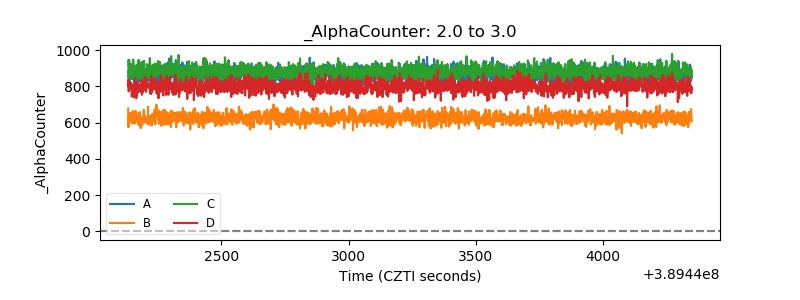 |
| _CPM_Rate | 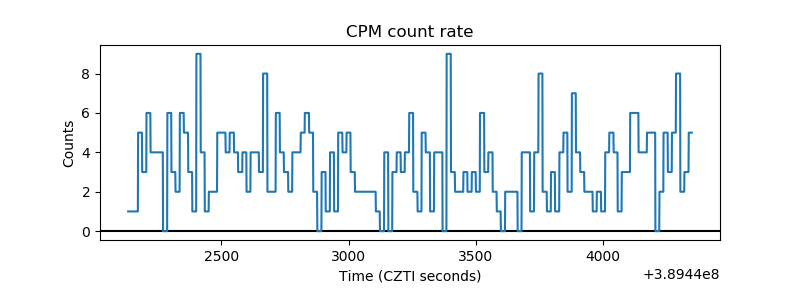 |
| CZT Counter | 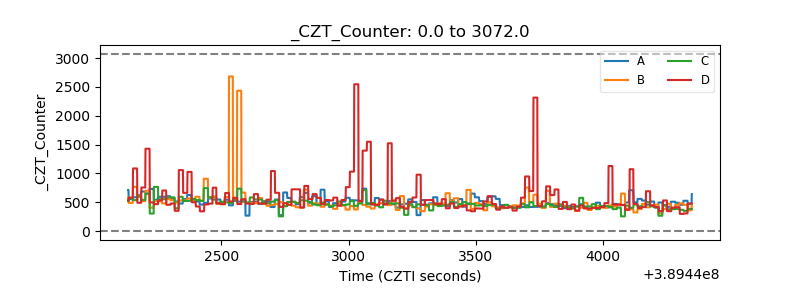 |
| +2.5 Volts monitor |  |
| +5 Volts monitor | 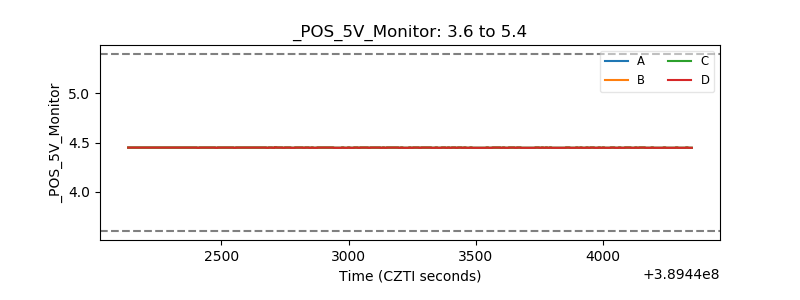 |
| _ROLL_ROT | 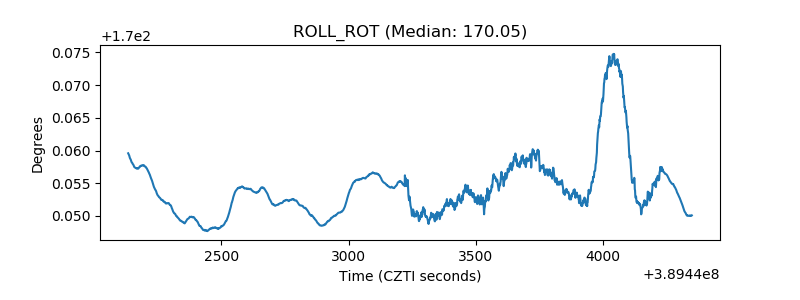 |
| _Roll_DEC | 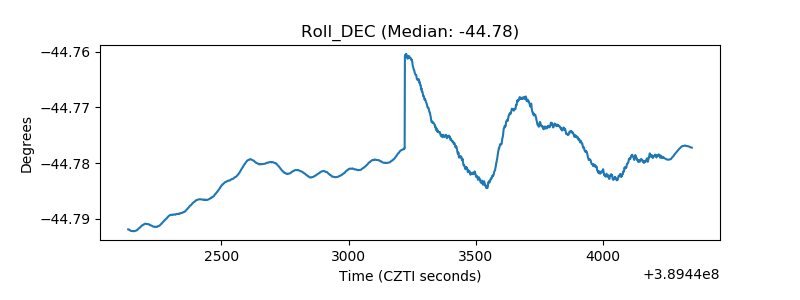 |
| _Roll_RA | 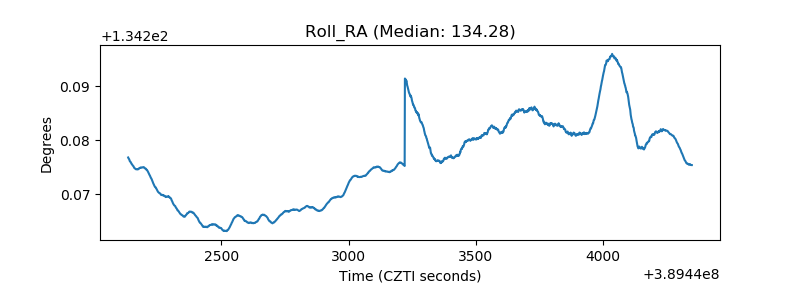 |
| Veto Counter | 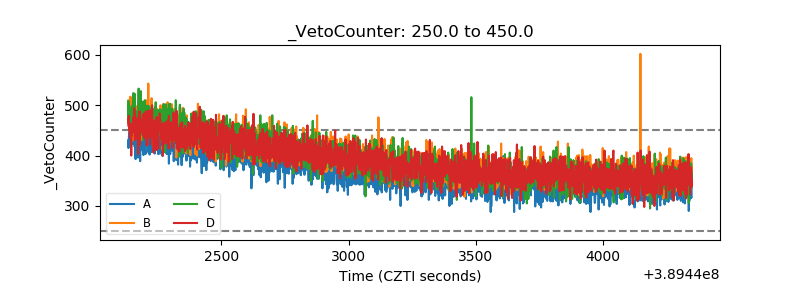 |