| Param | Original file | Final file |
|---|---|---|
| Filename | modeM0/AS1A09_142T02_9000005112cztM0_level2.fits | modeM0/AS1A09_142T02_9000005112cztM0_level2_quad_clean.evt |
| Size (bytes) | 195,050,880 | 129,862,080 |
| Size | 186.0 MB | 123.8 MB |
| Events in quadrant A | 1,217,684 | 692,915 |
| Events in quadrant B | 1,134,636 | 647,917 |
| Events in quadrant C | 1,188,930 | 662,327 |
| Events in quadrant D | 1,026,890 | 588,857 |
| Mode SS | |||
|---|---|---|---|
| Quadrant | BADHDUFLAG | Total packets | Discarded packets |
| A | 0 | 398 | 0 |
| B | 0 | 398 | 0 |
| C | 0 | 398 | 0 |
| D | 0 | 398 | 0 |
| Mode M0 | |||
|---|---|---|---|
| Quadrant | BADHDUFLAG | Total packets | Discarded packets |
| A | 0 | 40527 | 0 |
| B | 0 | 47847 | 0 |
| C | 0 | 41616 | 0 |
| D | 0 | 46366 | 0 |
| Mode M9 | |||
|---|---|---|---|
| Quadrant | BADHDUFLAG | Total packets | Discarded packets |
| A | 0 | 98 | 0 |
| B | 0 | 98 | 0 |
| C | 0 | 98 | 0 |
| D | 0 | 98 | 0 |
| Quadrant | Total seconds | Saturated seconds | Saturation percentage |
|---|---|---|---|
| A | 19441 | 23 | 0.118307% |
| B | 19442 | 671 | 3.451291% |
| C | 19442 | 171 | 0.879539% |
| D | 19442 | 510 | 2.623187% |
Noise dominated data is calculated using 1-second bins in cleaned event files. If a bin has >2000 counts, and if more than 50% of those come from <1% of pixels, then it is considered to be noise-dominated and hence unusable.
| Quadrant | # 1 sec bins | Bins with >0 counts | Bins with >2000 counts | High rate bins dominated by noise | Noise dominated (total time) | Noise dominated (detector-on time) | Marked lightcurve |
|---|---|---|---|---|---|---|---|
| A | 29212 | 19442 | 0 | 0 | 0.00% | 0.00% | 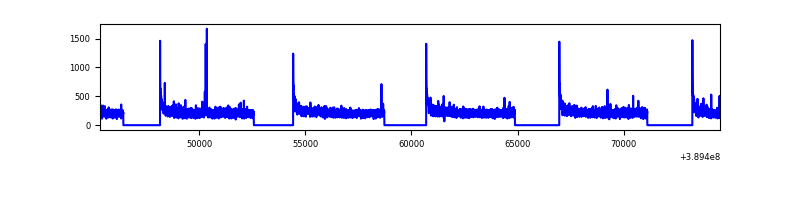 |
| B | 29212 | 19441 | 0 | 0 | 0.00% | 0.00% | 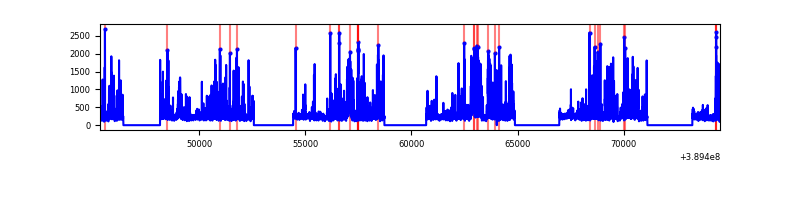 |
| C | 29212 | 19441 | 0 | 0 | 0.00% | 0.00% | 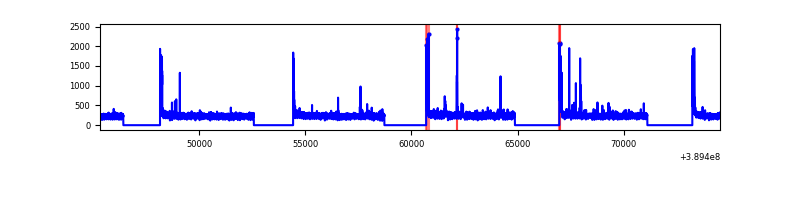 |
| D | 29212 | 19437 | 0 | 0 | 0.00% | 0.00% |  |
Top three noisy pixels from each quadrant. If the there are fewer than three noisy pixels in the level2.evt file, extra rows are filled as -1
| Pixel properties | Quadrant properties | ||||||
|---|---|---|---|---|---|---|---|
| Quadrant | DetID | PixID | Counts | Sigma | Mean | Median | Sigma |
| A | 9 | 19 | 1029 | 9.15 | 318 | 301 | 79.6 |
| A | 0 | 29 | 1002 | 8.81 | 318 | 301 | 79.6 |
| A | 7 | 110 | 941 | 8.04 | 318 | 301 | 79.6 |
| B | 2 | 9 | 994 | 11.66 | 300 | 288 | 60.5 |
| B | 3 | 80 | 885 | 9.86 | 300 | 288 | 60.5 |
| B | 5 | 128 | 812 | 8.65 | 300 | 288 | 60.5 |
| C | 1 | 81 | 1012 | 8.73 | 314 | 296 | 82.0 |
| C | 1 | 80 | 936 | 7.8 | 314 | 296 | 82.0 |
| C | 3 | 202 | 932 | 7.75 | 314 | 296 | 82.0 |
| D | 10 | 189 | 788 | 6.67 | 293 | 270 | 77.7 |
| D | 6 | 38 | 766 | 6.38 | 293 | 270 | 77.7 |
| D | 6 | 62 | 755 | 6.24 | 293 | 270 | 77.7 |
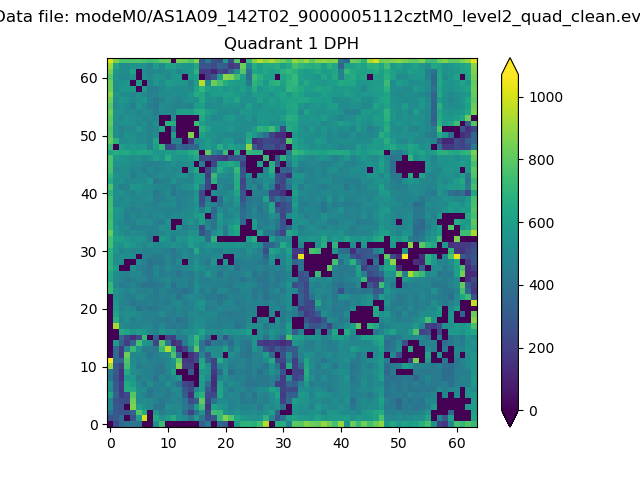
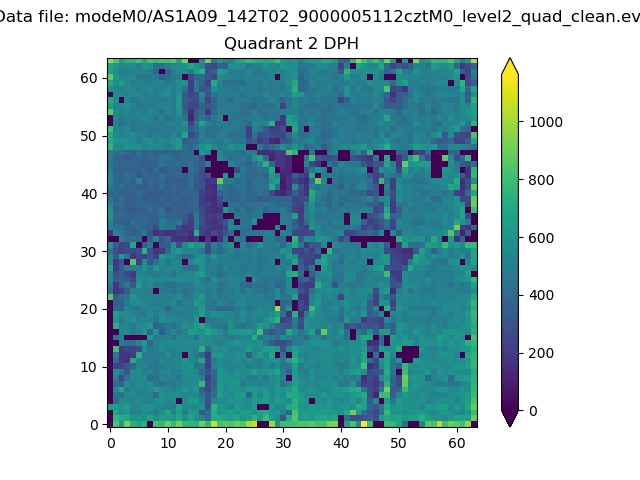
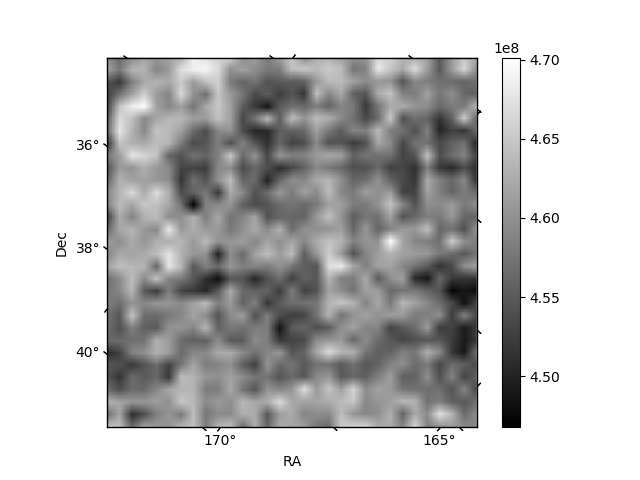
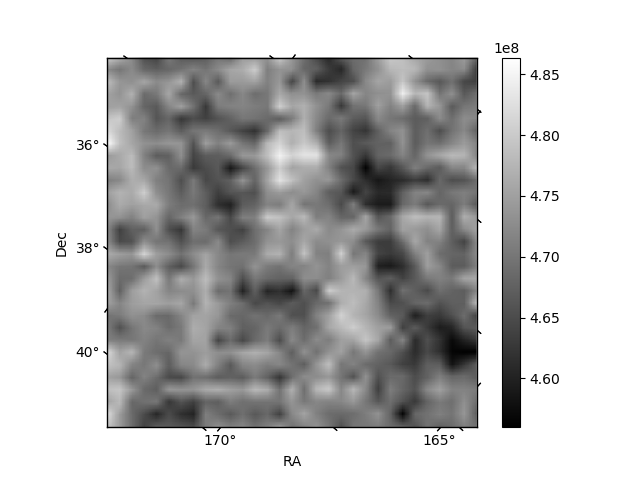
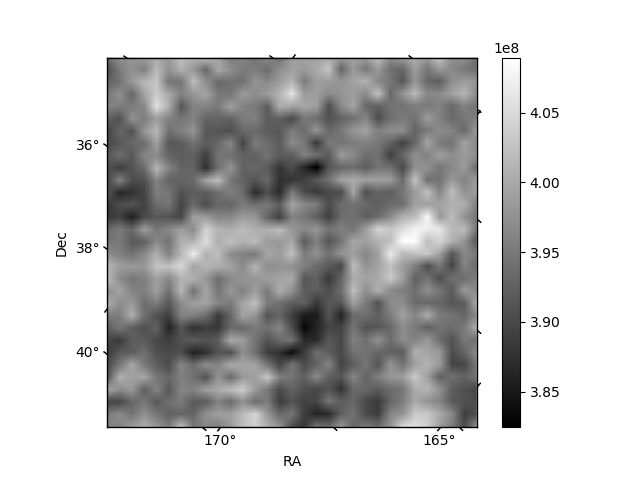
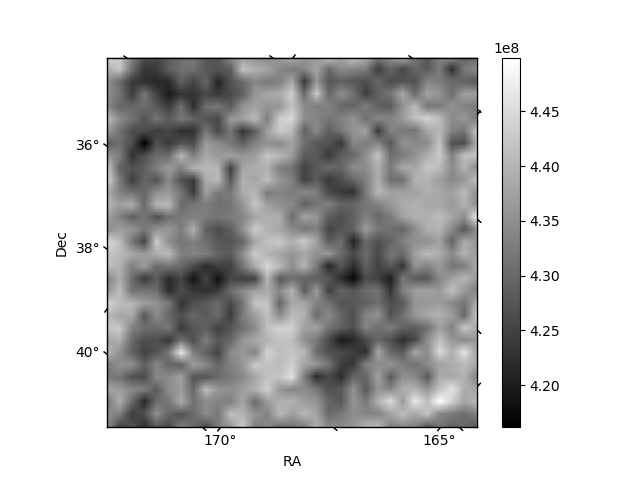
Histogram calculated using DETX and DETY for each event in the final _common_clean file
| Quadrant A | 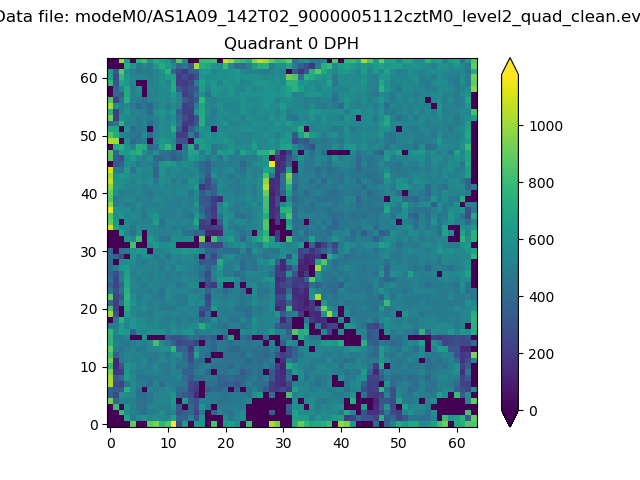 |
 |
Quadrant B |
|---|---|---|---|
| Quadrant D | 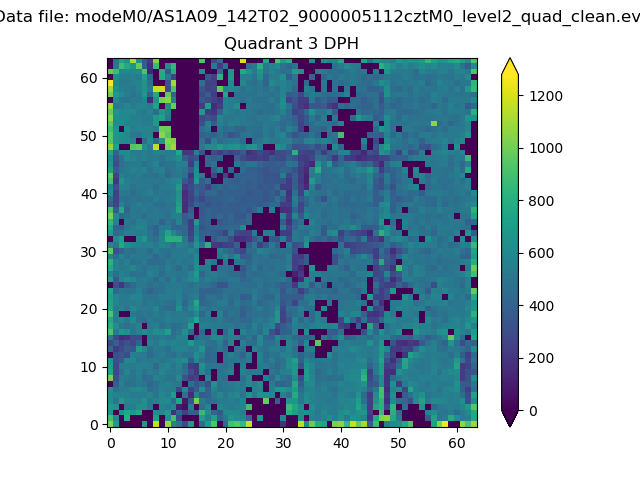 |
 |
Quadrant C |
| Plot type | Count rate plots | Images |
|---|---|---|
| Comparison with Poisson distribution Blue bars denote a histogram of data divided into 1 sec bins. Red curve is a Poisson curve with rate = median count rate of data. |
 |
 |
| Quadrant-wise count rates Data is divided into 100 sec bins |
 |
|
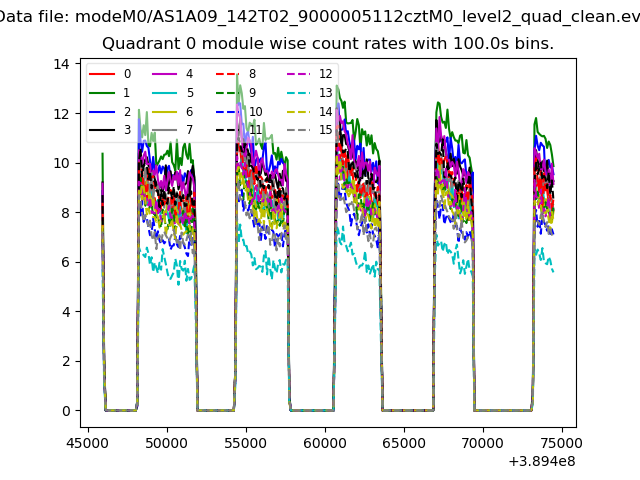
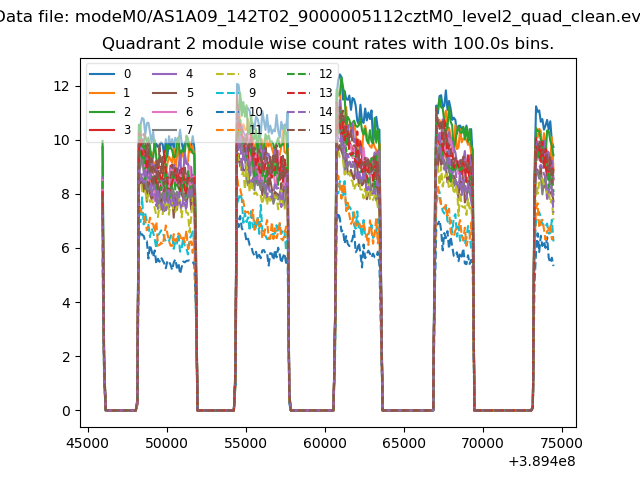
| Module-wise count rates for Quadrant A Data is divided into 100 sec bins |
 |
 |
| Module-wise count rates for Quadrant B Data is divided into 100 sec bins |
 |
 |
| Module-wise count rates for Quadrant C Data is divided into 100 sec bins |
 |
 |
| Module-wise count rates for Quadrant D Data is divided into 100 sec bins |
 |
 |
| Parameter | Plot |
|---|---|
| CZT HV Monitor | 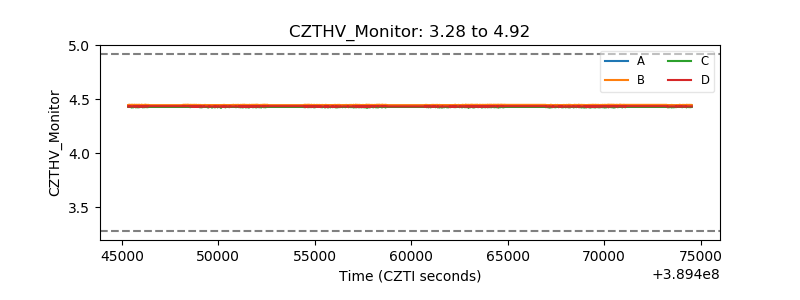 |
| D_VDD | 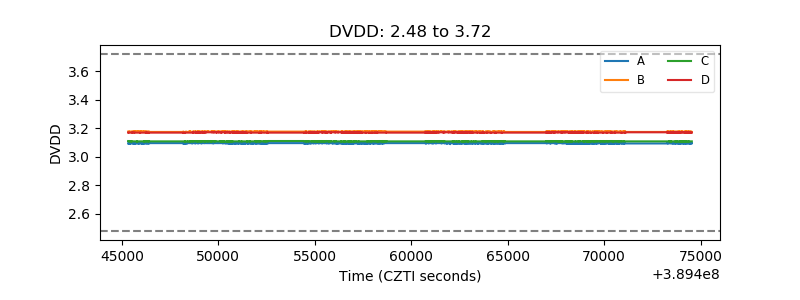 |
| Temperature 1 | 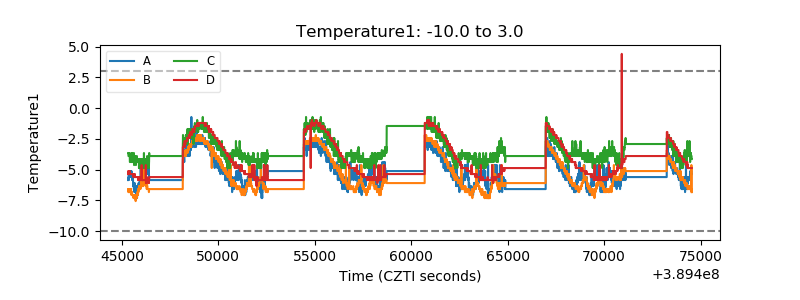 |
| Veto HV Monitor | 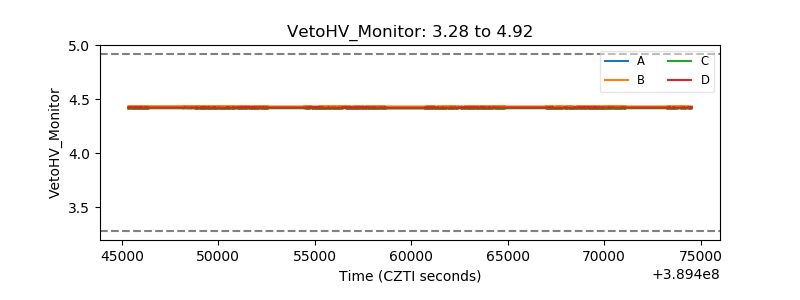 |
| Veto LLD | 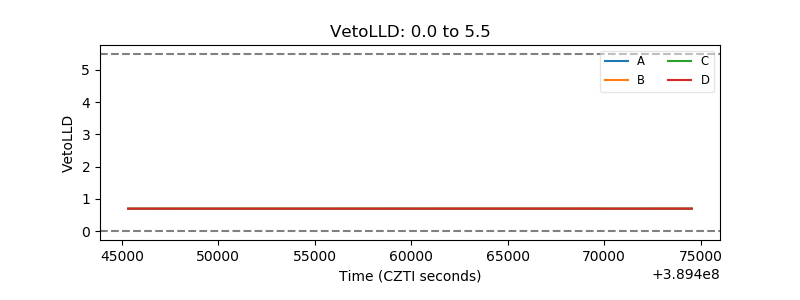 |
| Alpha Counter | 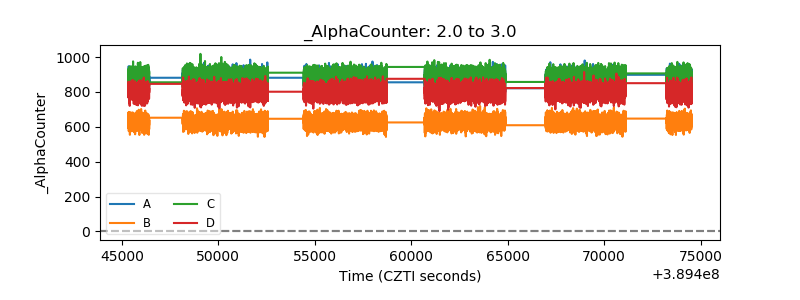 |
| _CPM_Rate |  |
| CZT Counter | 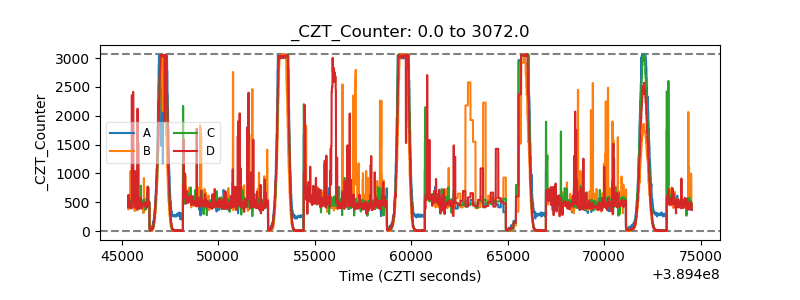 |
| +2.5 Volts monitor |  |
| +5 Volts monitor | 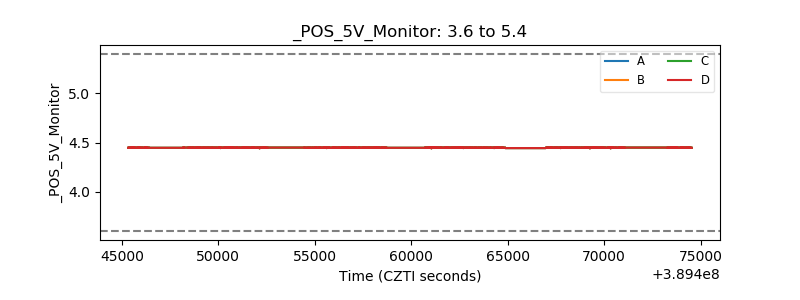 |
| _ROLL_ROT | 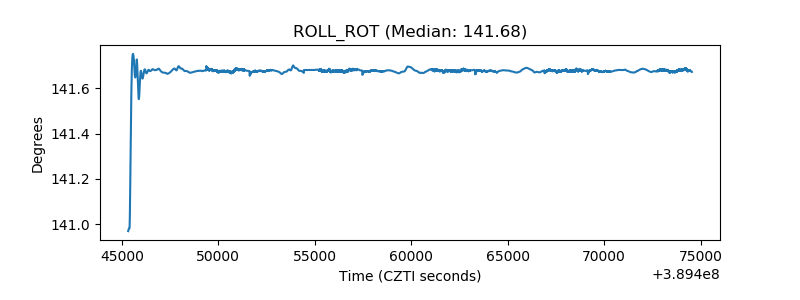 |
| _Roll_DEC | 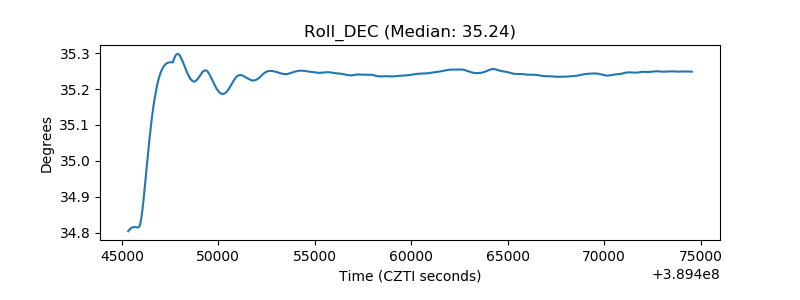 |
| _Roll_RA | 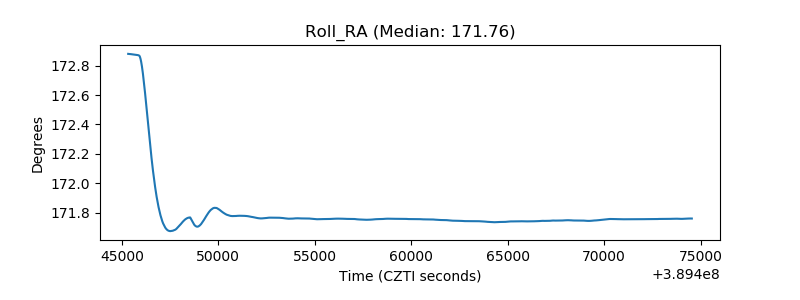 |
| Veto Counter | 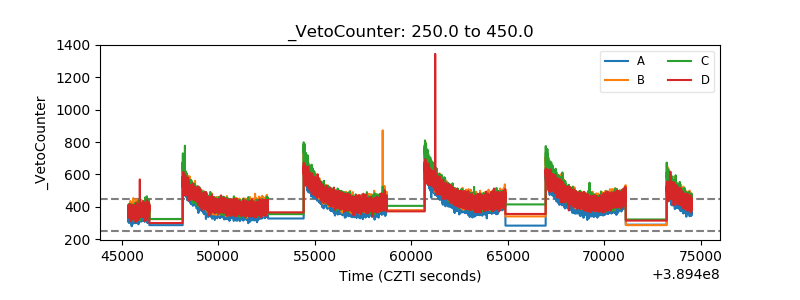 |