| Param | Original file | Final file |
|---|---|---|
| Filename | modeM0/AS1A09_142T03_9000005114_35702cztM0_level2.evt | modeM0/AS1A09_142T03_9000005114_35702cztM0_level2_quad_clean.evt |
| Size (bytes) | 429,710,400 | 77,604,480 |
| Size | 409.8 MB | 74.0 MB |
| Events in quadrant A | 2,848,173 | 476,417 |
| Events in quadrant B | 3,117,905 | 486,860 |
| Events in quadrant C | 3,301,107 | 491,131 |
| Events in quadrant D | 3,333,769 | 471,444 |
| Mode SS | |||
|---|---|---|---|
| Quadrant | BADHDUFLAG | Total packets | Discarded packets |
| A | 0 | 126 | 0 |
| B | 0 | 126 | 0 |
| C | 0 | 126 | 0 |
| D | 0 | 126 | 0 |
| Mode M0 | |||
|---|---|---|---|
| Quadrant | BADHDUFLAG | Total packets | Discarded packets |
| A | 0 | 12388 | 3 |
| B | 0 | 13215 | 2 |
| C | 0 | 13516 | 2 |
| D | 0 | 14159 | 2 |
| Mode M9 | |||
|---|---|---|---|
| Quadrant | BADHDUFLAG | Total packets | Discarded packets |
| A | 0 | 26 | 0 |
| B | 0 | 26 | 0 |
| C | 0 | 26 | 0 |
| D | 0 | 26 | 0 |
| Quadrant | Total seconds | Saturated seconds | Saturation percentage |
|---|---|---|---|
| A | 6072 | 6 | 0.098814% |
| B | 6072 | 54 | 0.889328% |
| C | 6072 | 70 | 1.152833% |
| D | 6072 | 91 | 1.498682% |
Noise dominated data is calculated using 1-second bins in cleaned event files. If a bin has >2000 counts, and if more than 50% of those come from <1% of pixels, then it is considered to be noise-dominated and hence unusable.
| Quadrant | # 1 sec bins | Bins with >0 counts | Bins with >2000 counts | High rate bins dominated by noise | Noise dominated (total time) | Noise dominated (detector-on time) | Marked lightcurve |
|---|---|---|---|---|---|---|---|
| A | 8727 | 6074 | 0 | 0 | 0.00% | 0.00% | 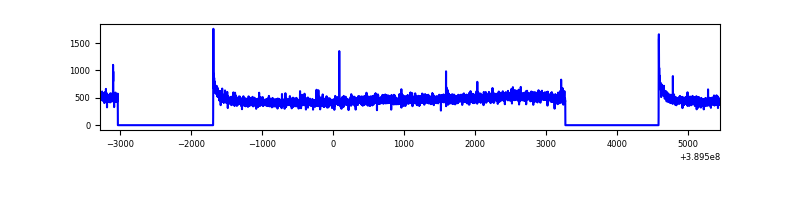 |
| B | 8727 | 6074 | 30 | 30 | 0.34% | 0.49% | 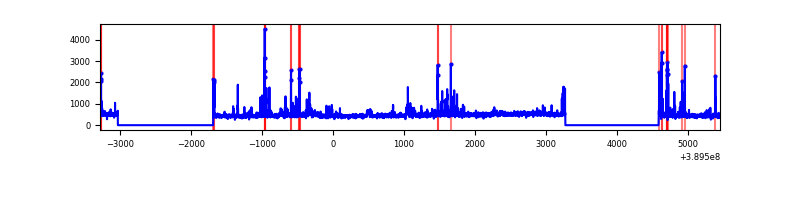 |
| C | 8727 | 6074 | 62 | 62 | 0.71% | 1.02% | 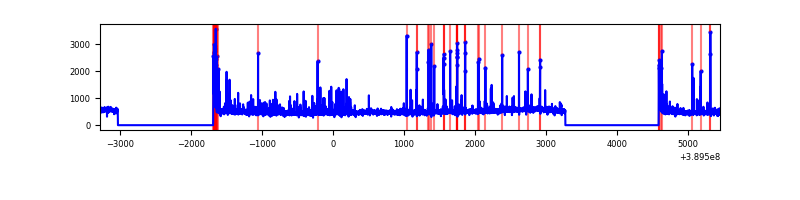 |
| D | 8727 | 6074 | 73 | 73 | 0.84% | 1.20% | 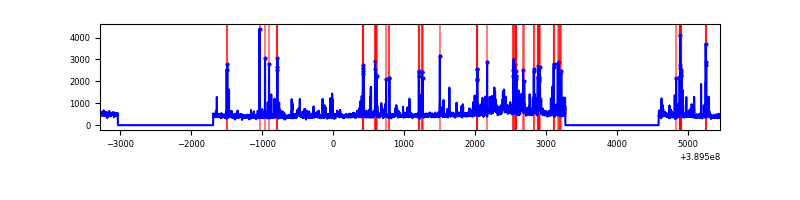 |
Top three noisy pixels from each quadrant. If the there are fewer than three noisy pixels in the level2.evt file, extra rows are filled as -1
| Pixel properties | Quadrant properties | ||||||
|---|---|---|---|---|---|---|---|
| Quadrant | DetID | PixID | Counts | Sigma | Mean | Median | Sigma |
| A | 10 | 83 | 152378 | 1071.81 | 692 | 678 | 141.5 |
| A | 13 | 6 | 8760 | 57.1 | 692 | 678 | 141.5 |
| A | 3 | 137 | 7370 | 47.28 | 692 | 678 | 141.5 |
| B | 5 | 172 | 250808 | 1875.29 | 688 | 669 | 133.4 |
| B | 5 | 255 | 80795 | 600.7 | 688 | 669 | 133.4 |
| B | 10 | 244 | 61366 | 455.05 | 688 | 669 | 133.4 |
| C | 0 | 10 | 366894 | 2284.43 | 682 | 686 | 160.3 |
| C | 15 | 214 | 256957 | 1598.64 | 682 | 686 | 160.3 |
| C | 0 | 207 | 8958 | 51.6 | 682 | 686 | 160.3 |
| D | 13 | 249 | 319556 | 1928.79 | 679 | 659 | 165.3 |
| D | 10 | 118 | 160027 | 963.91 | 679 | 659 | 165.3 |
| D | 12 | 6 | 90014 | 540.45 | 679 | 659 | 165.3 |
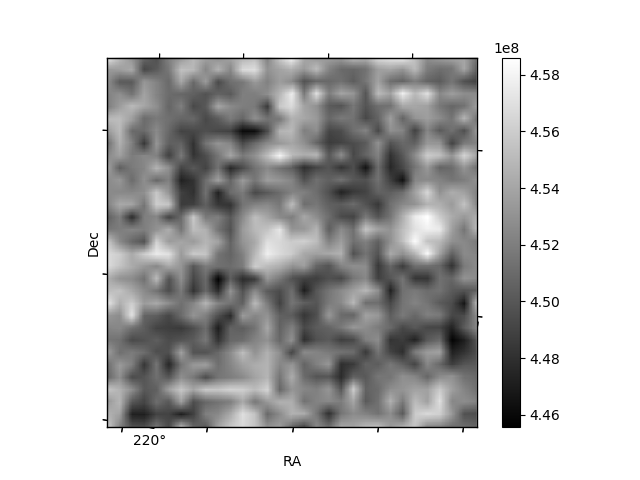
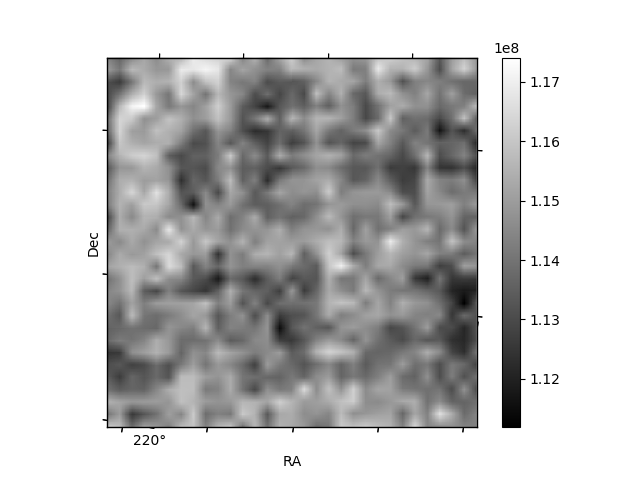
Histogram calculated using DETX and DETY for each event in the final _common_clean file
| Quadrant A | 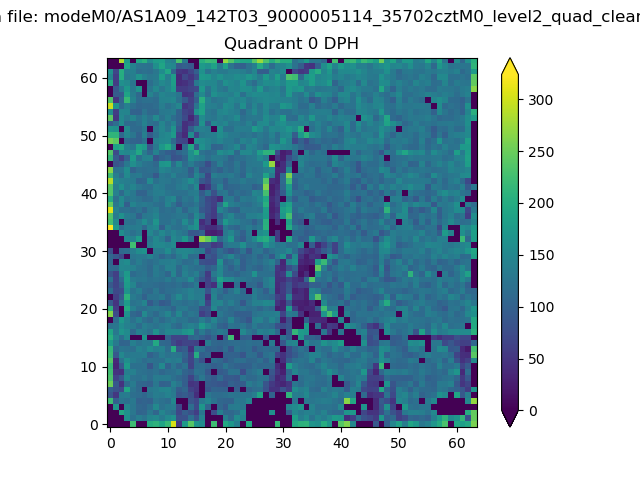 |
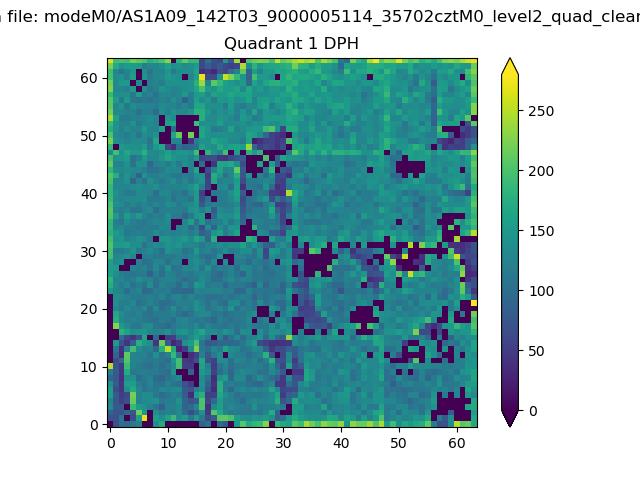 |
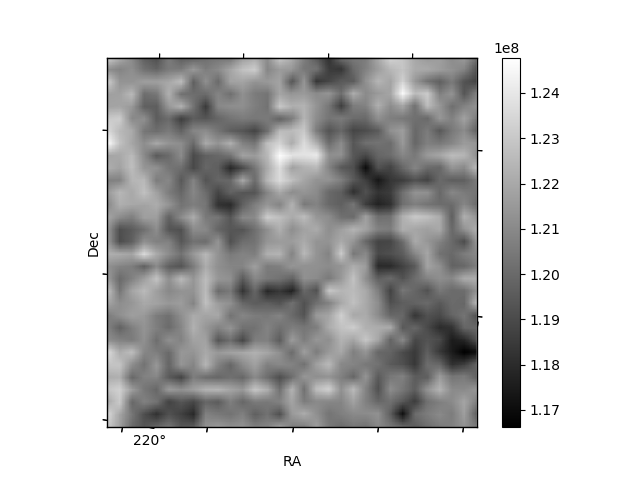
Quadrant B |
|---|---|---|---|
| Quadrant D | 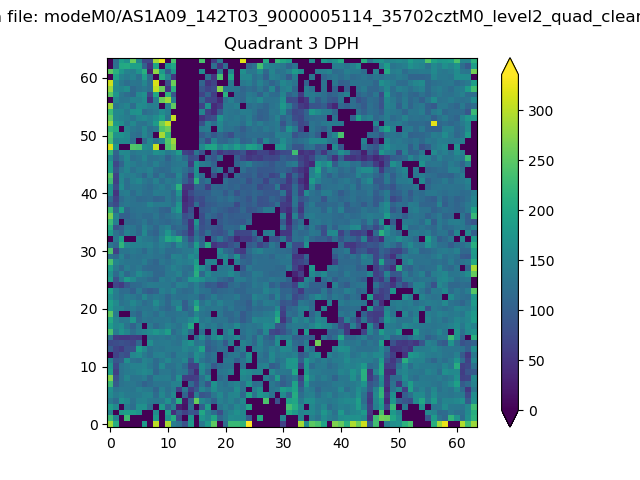 |
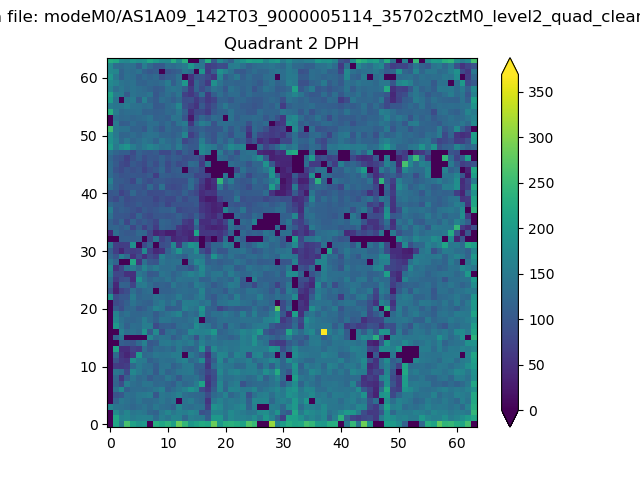 |
Quadrant C |
| Plot type | Count rate plots | Images |
|---|---|---|
| Comparison with Poisson distribution Blue bars denote a histogram of data divided into 1 sec bins. Red curve is a Poisson curve with rate = median count rate of data. |
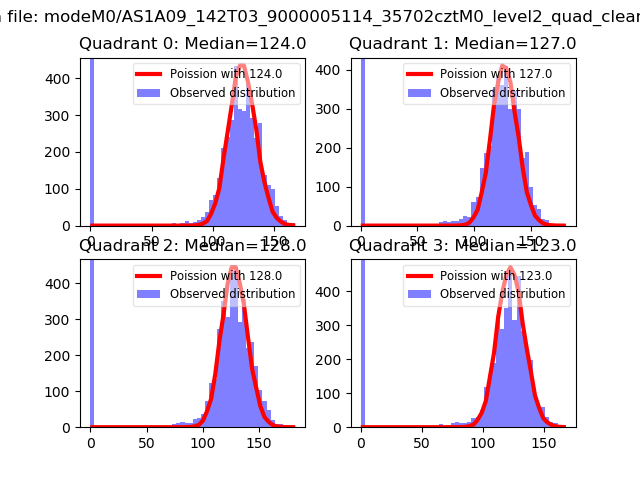 |
 |
| Quadrant-wise count rates Data is divided into 100 sec bins |
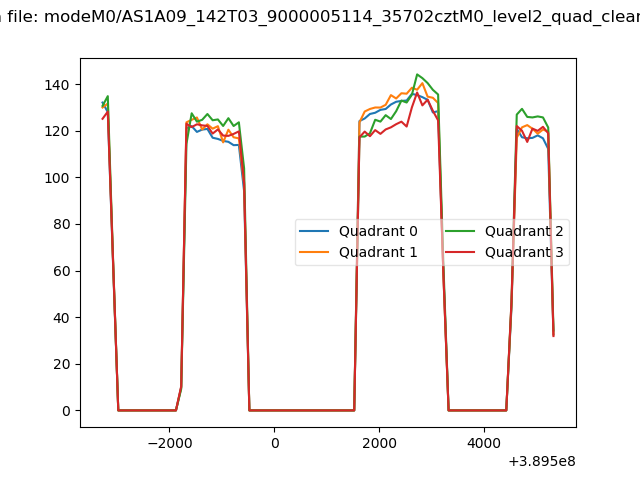 |
|
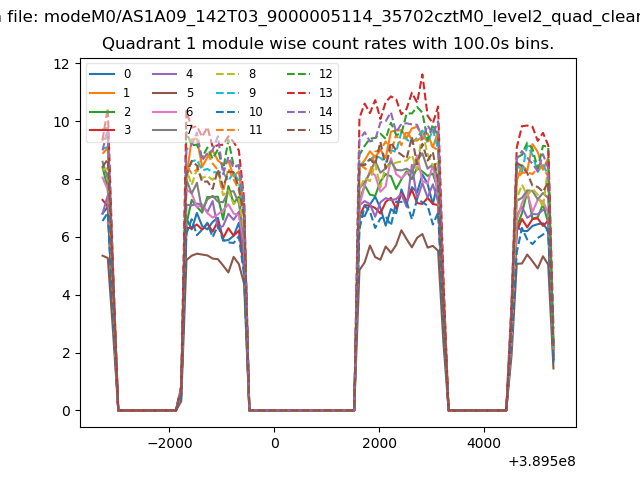
| Module-wise count rates for Quadrant A Data is divided into 100 sec bins |
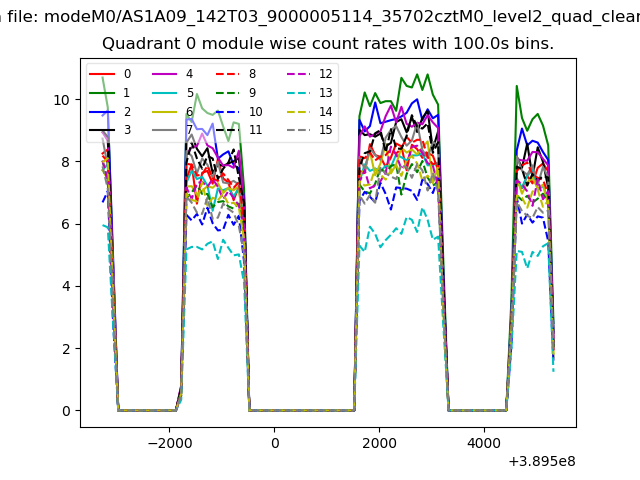 |
 |
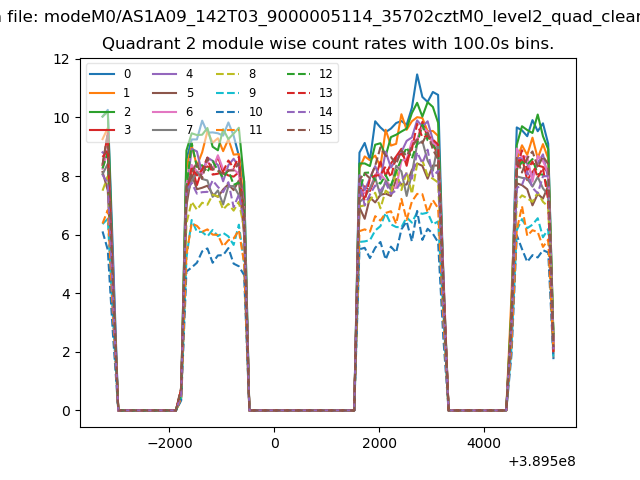
| Module-wise count rates for Quadrant B Data is divided into 100 sec bins |
 |
 |
| Module-wise count rates for Quadrant C Data is divided into 100 sec bins |
 |
 |
| Module-wise count rates for Quadrant D Data is divided into 100 sec bins |
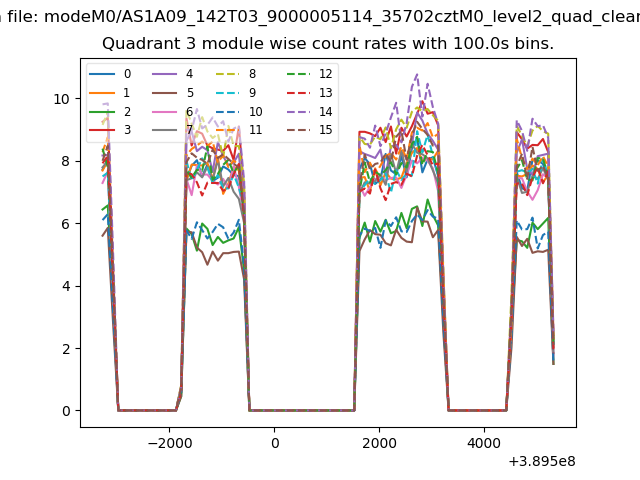 |
 |
| Parameter | Plot |
|---|---|
| CZT HV Monitor |  |
| D_VDD | 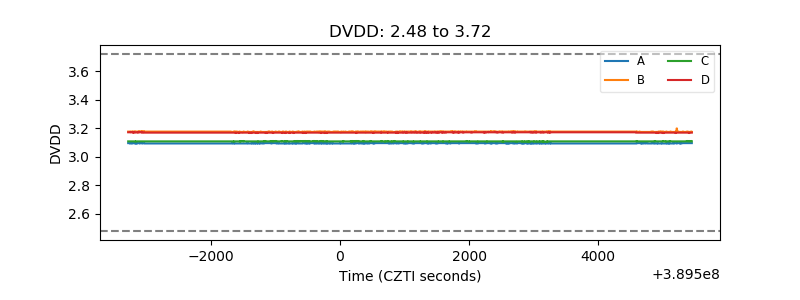 |
| Temperature 1 | 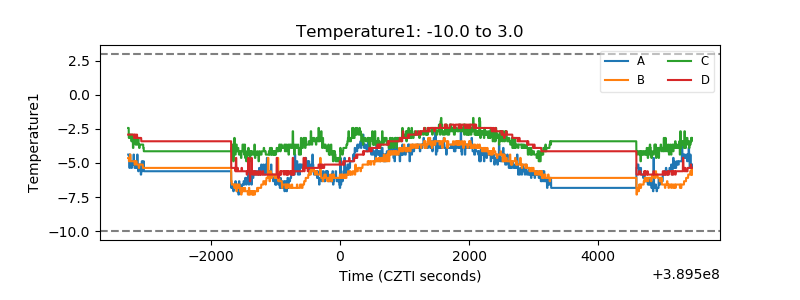 |
| Veto HV Monitor | 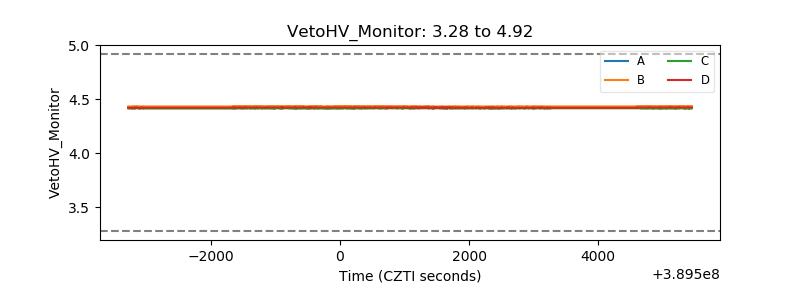 |
| Veto LLD | 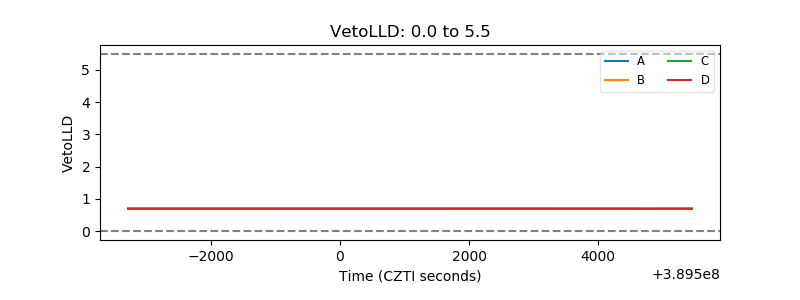 |
| Alpha Counter | 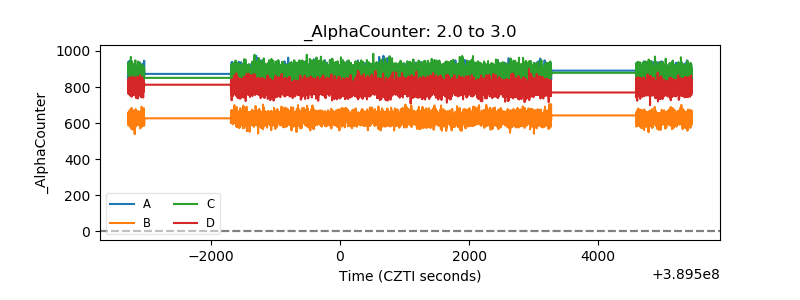 |
| _CPM_Rate | 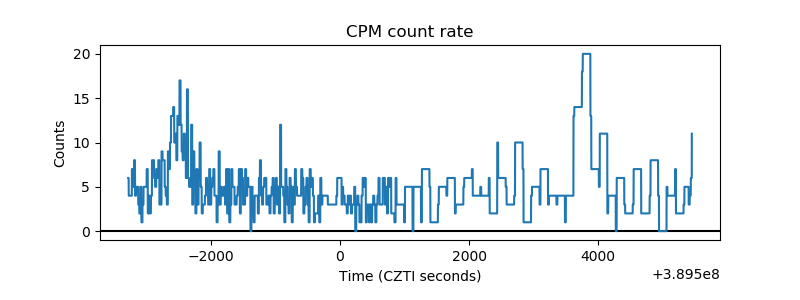 |
| CZT Counter | 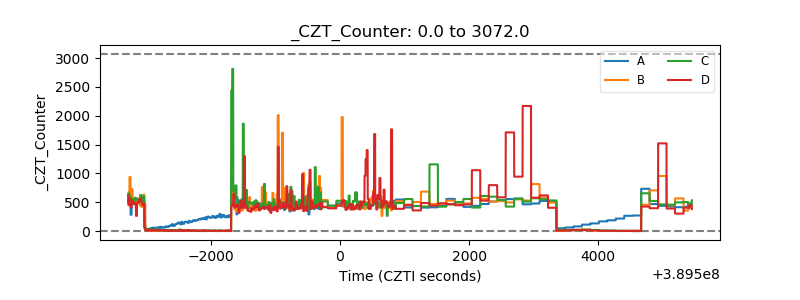 |
| +2.5 Volts monitor | 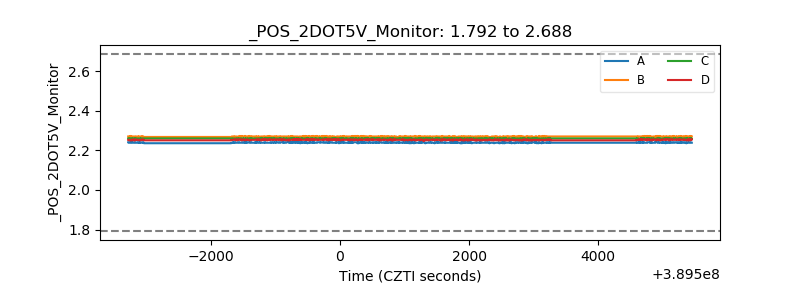 |
| +5 Volts monitor | 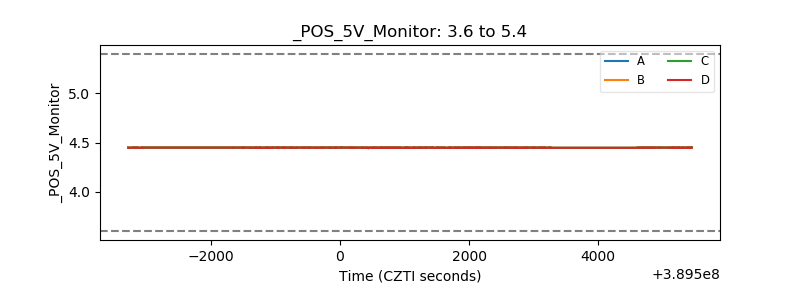 |
| _ROLL_ROT | 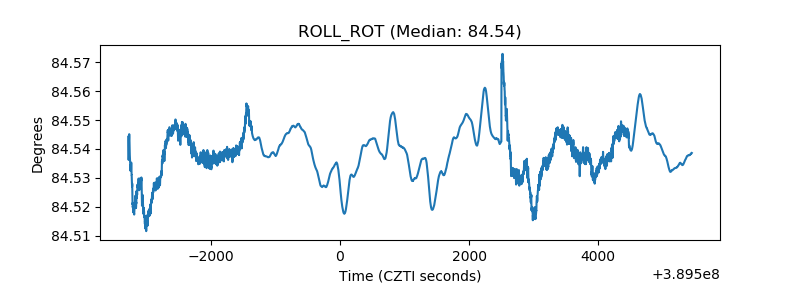 |
| _Roll_DEC | 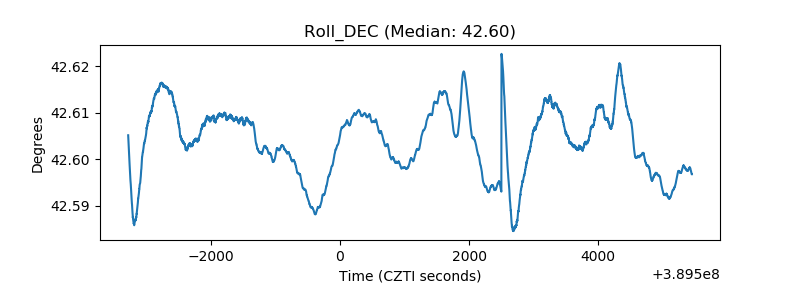 |
| _Roll_RA | 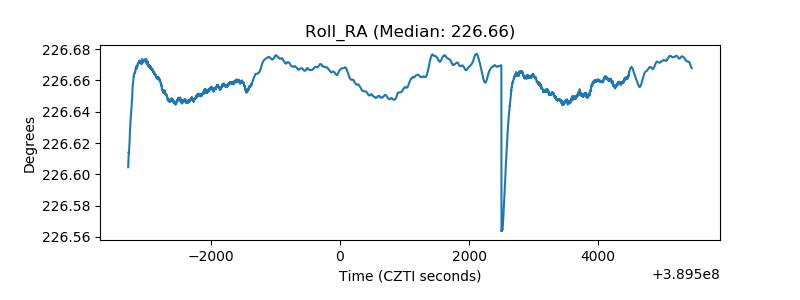 |
| Veto Counter | 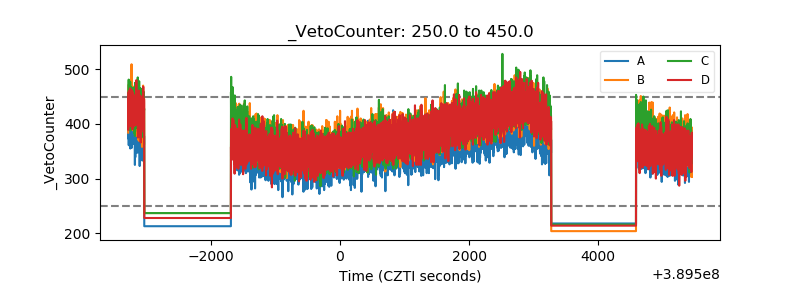 |