| Param | Original file | Final file |
|---|---|---|
| Filename | modeM0/AS1A09_029T01_9000005116cztM0_level2.fits | modeM0/AS1A09_029T01_9000005116cztM0_level2_quad_clean.evt |
| Size (bytes) | 223,133,760 | 179,948,160 |
| Size | 212.8 MB | 171.6 MB |
| Events in quadrant A | 1,396,320 | 1,024,055 |
| Events in quadrant B | 1,295,150 | 996,515 |
| Events in quadrant C | 1,310,524 | 949,530 |
| Events in quadrant D | 1,168,200 | 891,113 |
| Mode M9 | |||
|---|---|---|---|
| Quadrant | BADHDUFLAG | Total packets | Discarded packets |
| A | 0 | 105 | 0 |
| B | 0 | 105 | 0 |
| C | 0 | 105 | 0 |
| D | 0 | 105 | 0 |
| Mode SS | |||
|---|---|---|---|
| Quadrant | BADHDUFLAG | Total packets | Discarded packets |
| A | 0 | 470 | 0 |
| B | 0 | 470 | 0 |
| C | 0 | 470 | 0 |
| D | 0 | 470 | 0 |
| Mode M0 | |||
|---|---|---|---|
| Quadrant | BADHDUFLAG | Total packets | Discarded packets |
| A | 0 | 48047 | 0 |
| B | 0 | 56632 | 0 |
| C | 0 | 52814 | 0 |
| D | 0 | 53987 | 0 |
| Quadrant | Total seconds | Saturated seconds | Saturation percentage |
|---|---|---|---|
| A | 23070 | 37 | 0.160381% |
| B | 23070 | 933 | 4.044213% |
| C | 23070 | 474 | 2.054616% |
| D | 23070 | 375 | 1.625488% |
Noise dominated data is calculated using 1-second bins in cleaned event files. If a bin has >2000 counts, and if more than 50% of those come from <1% of pixels, then it is considered to be noise-dominated and hence unusable.
| Quadrant | # 1 sec bins | Bins with >0 counts | Bins with >2000 counts | High rate bins dominated by noise | Noise dominated (total time) | Noise dominated (detector-on time) | Marked lightcurve |
|---|---|---|---|---|---|---|---|
| A | 32690 | 23069 | 0 | 0 | 0.00% | 0.00% | 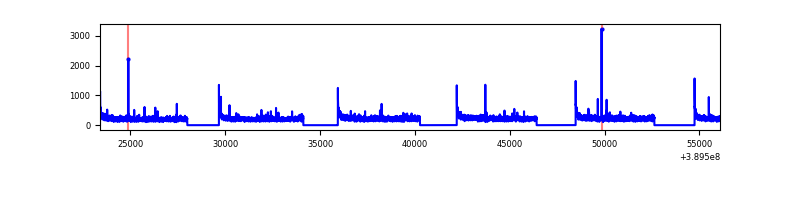 |
| B | 32690 | 23060 | 0 | 0 | 0.00% | 0.00% | 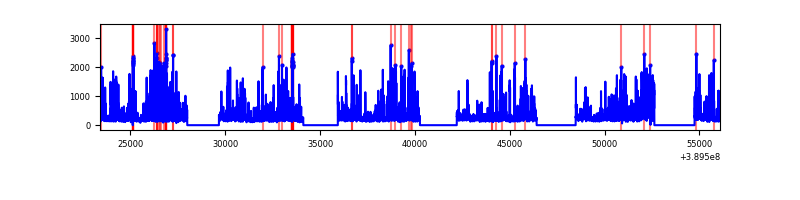 |
| C | 32690 | 23064 | 0 | 0 | 0.00% | 0.00% | 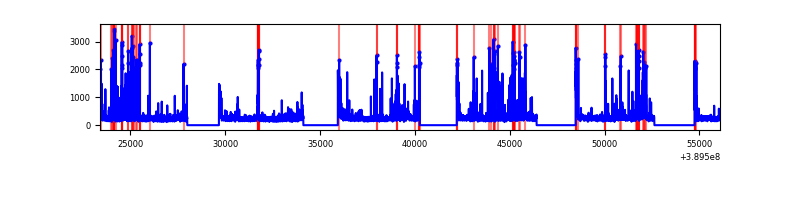 |
| D | 32690 | 23065 | 0 | 0 | 0.00% | 0.00% | 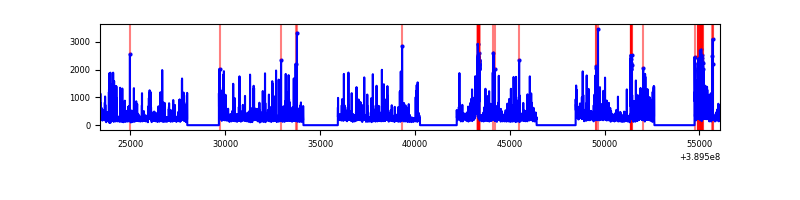 |
Top three noisy pixels from each quadrant. If the there are fewer than three noisy pixels in the level2.evt file, extra rows are filled as -1
| Pixel properties | Quadrant properties | ||||||
|---|---|---|---|---|---|---|---|
| Quadrant | DetID | PixID | Counts | Sigma | Mean | Median | Sigma |
| A | 9 | 19 | 1172 | 9.21 | 364 | 344 | 89.9 |
| A | 0 | 29 | 1165 | 9.14 | 364 | 344 | 89.9 |
| A | 7 | 110 | 1115 | 8.58 | 364 | 344 | 89.9 |
| B | 2 | 9 | 1058 | 10.55 | 343 | 329 | 69.1 |
| B | 3 | 80 | 1003 | 9.76 | 343 | 329 | 69.1 |
| B | 5 | 128 | 943 | 8.89 | 343 | 329 | 69.1 |
| C | 1 | 81 | 1148 | 8.99 | 346 | 326 | 91.5 |
| C | 1 | 80 | 1087 | 8.32 | 346 | 326 | 91.5 |
| C | 3 | 202 | 1043 | 7.84 | 346 | 326 | 91.5 |
| D | 7 | 3 | 908 | 6.65 | 333 | 305 | 90.7 |
| D | 4 | 160 | 866 | 6.18 | 333 | 305 | 90.7 |
| D | 10 | 113 | 858 | 6.09 | 333 | 305 | 90.7 |
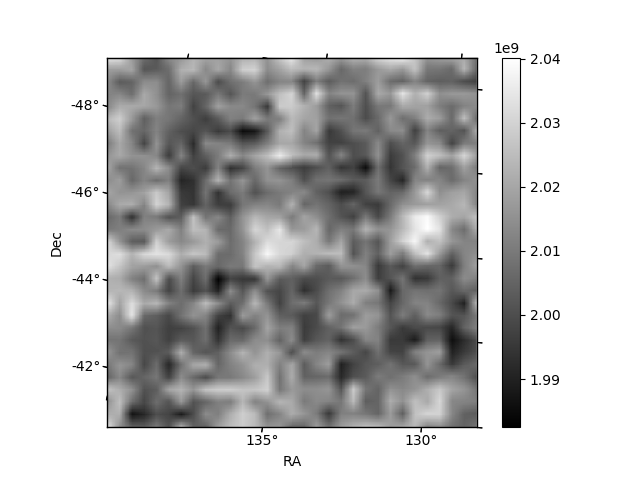
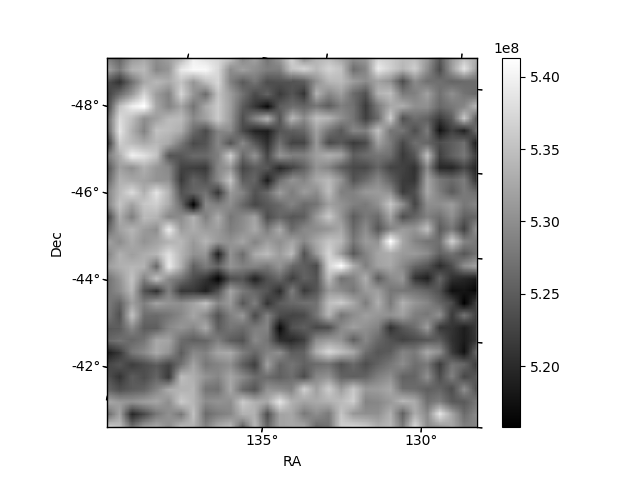
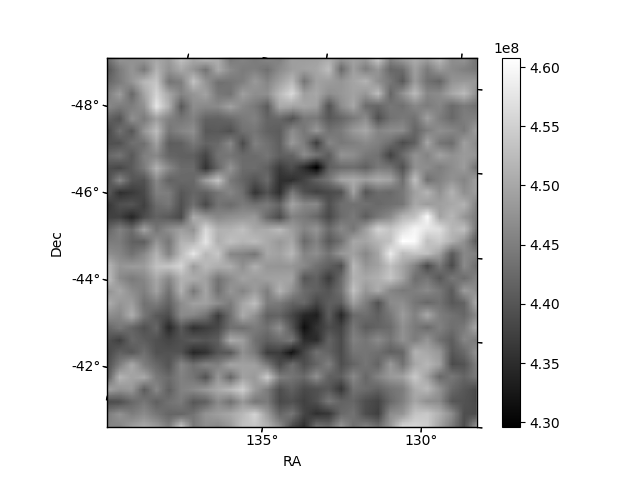
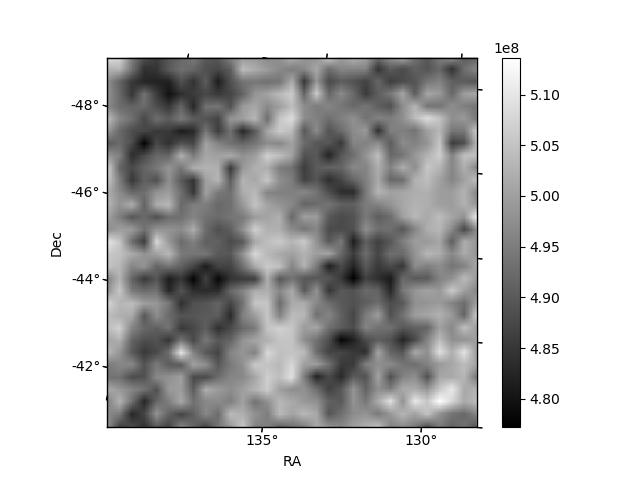
Histogram calculated using DETX and DETY for each event in the final _common_clean file
| Quadrant A | 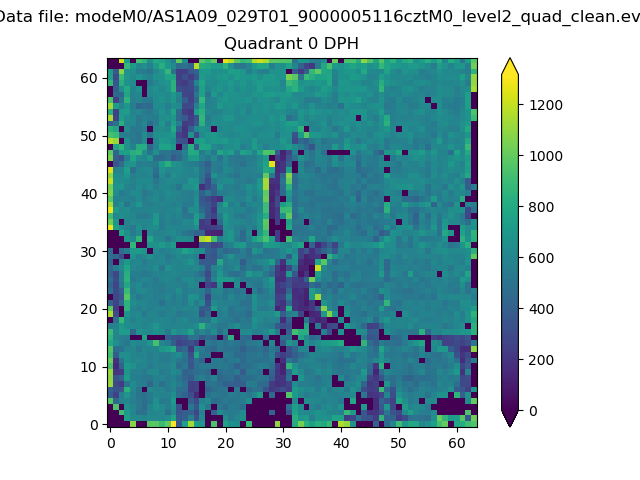 |
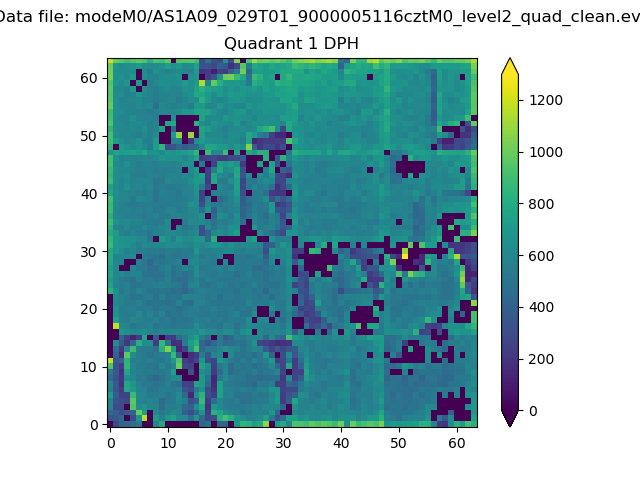 |
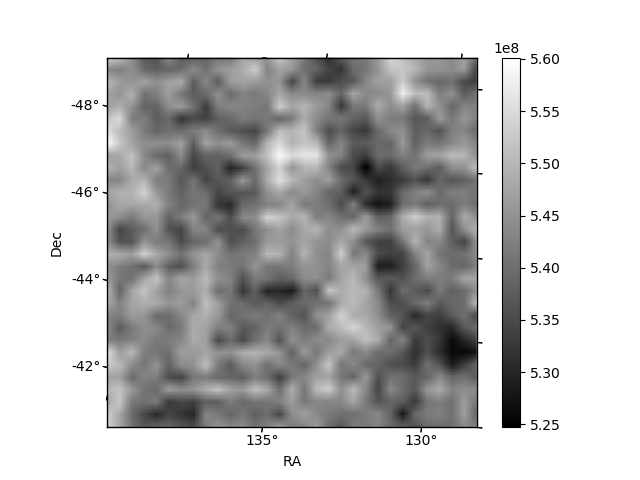
Quadrant B |
|---|---|---|---|
| Quadrant D | 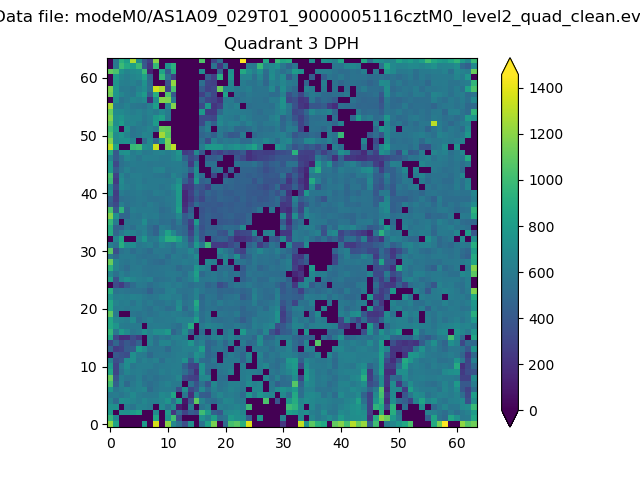 |
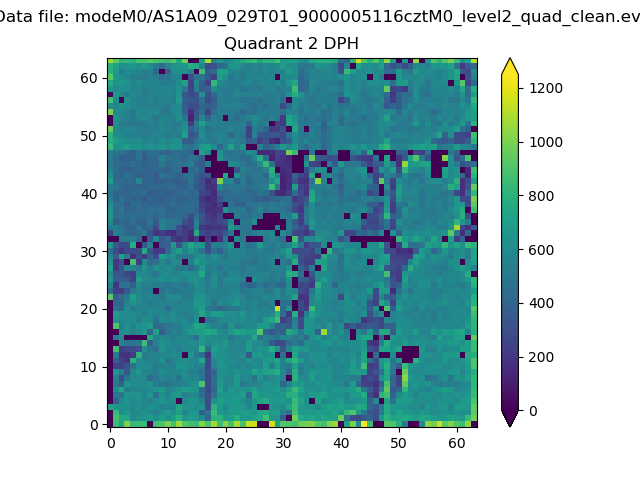 |
Quadrant C |
| Plot type | Count rate plots | Images |
|---|---|---|
| Comparison with Poisson distribution Blue bars denote a histogram of data divided into 1 sec bins. Red curve is a Poisson curve with rate = median count rate of data. |
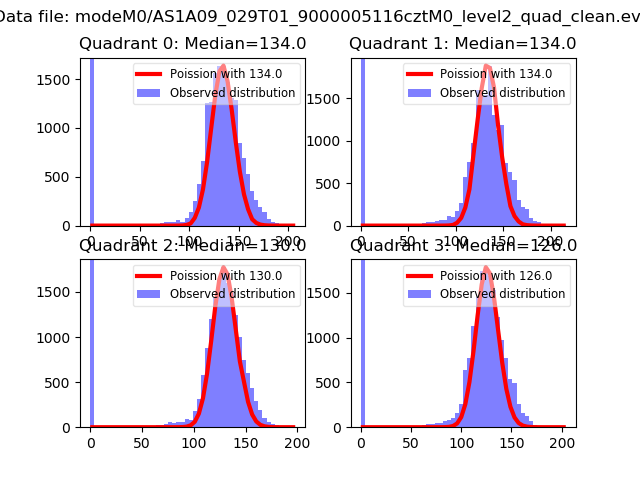 |
 |
| Quadrant-wise count rates Data is divided into 100 sec bins |
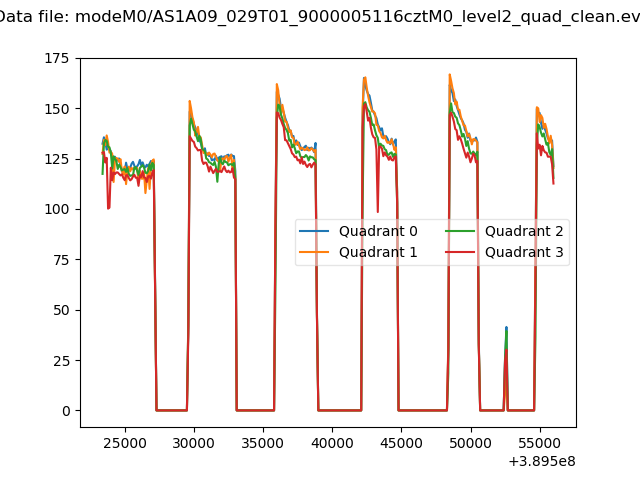 |
|
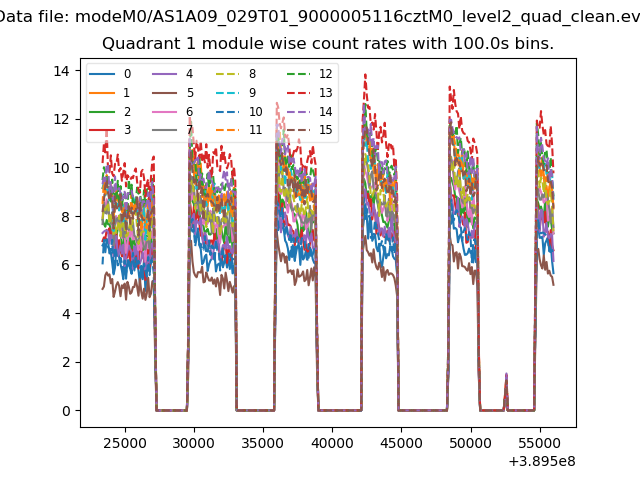
| Module-wise count rates for Quadrant A Data is divided into 100 sec bins |
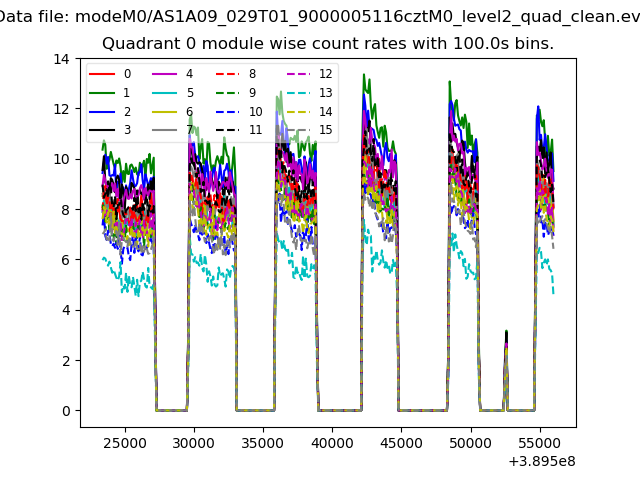 |
 |
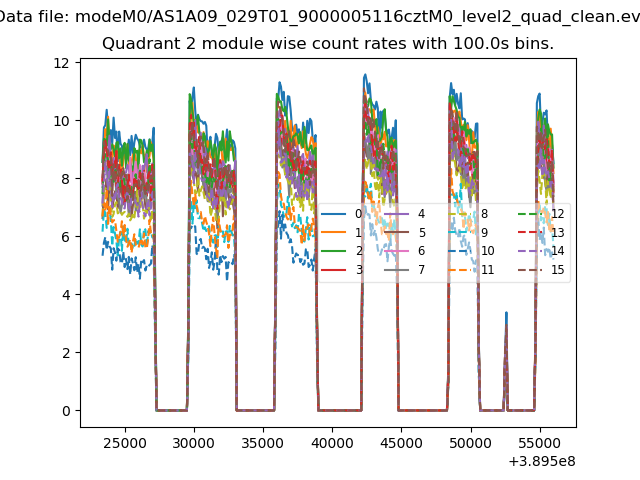
| Module-wise count rates for Quadrant B Data is divided into 100 sec bins |
 |
 |
| Module-wise count rates for Quadrant C Data is divided into 100 sec bins |
 |
 |
| Module-wise count rates for Quadrant D Data is divided into 100 sec bins |
 |
 |
| Parameter | Plot |
|---|---|
| CZT HV Monitor | 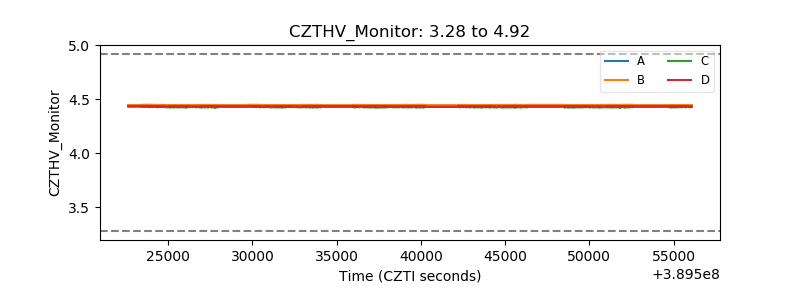 |
| D_VDD | 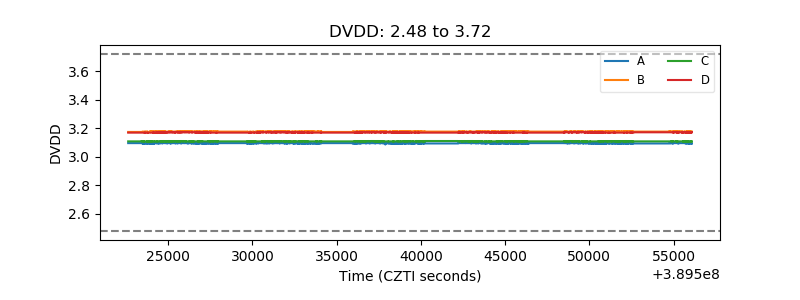 |
| Temperature 1 | 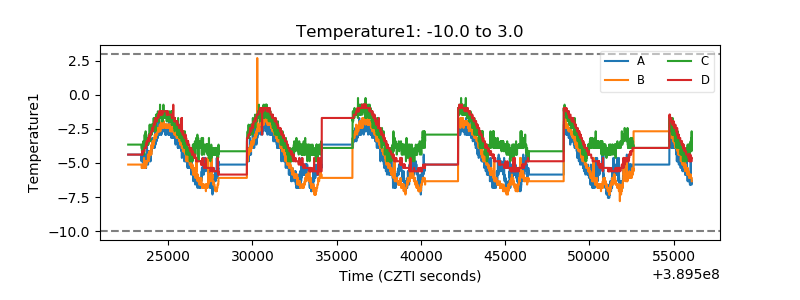 |
| Veto HV Monitor | 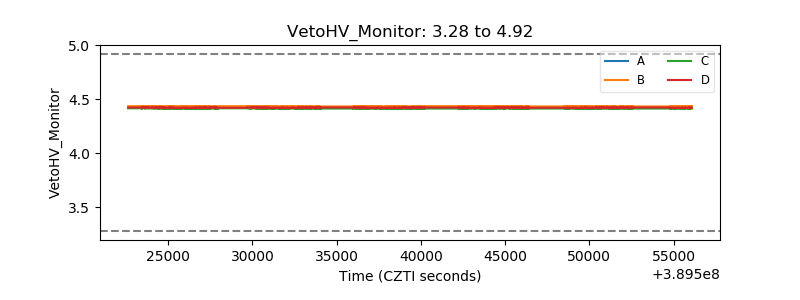 |
| Veto LLD | 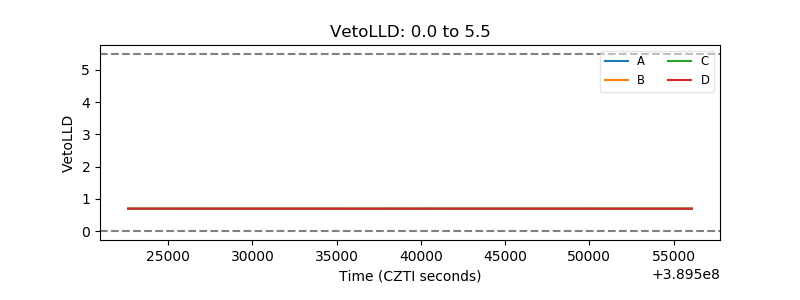 |
| Alpha Counter | 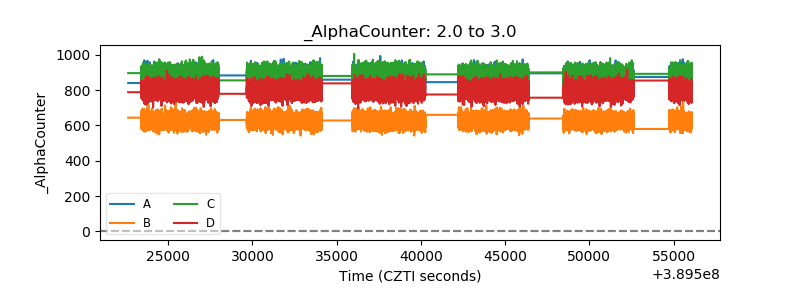 |
| _CPM_Rate | 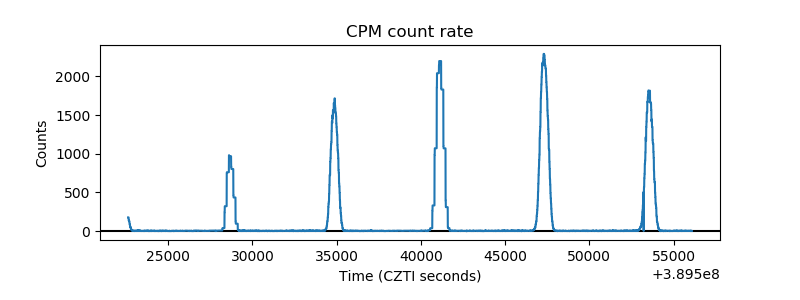 |
| CZT Counter | 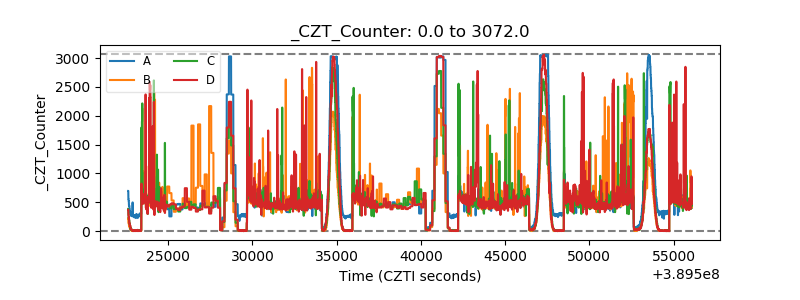 |
| +2.5 Volts monitor | 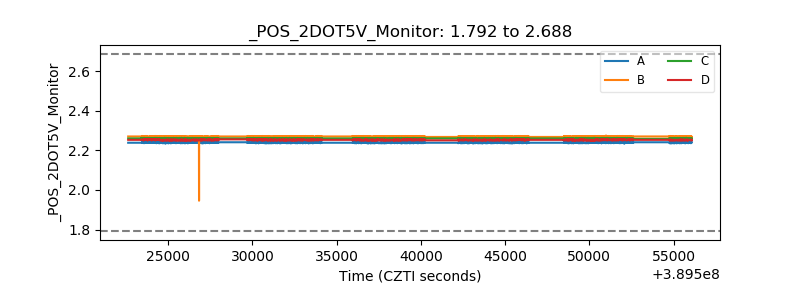 |
| +5 Volts monitor | 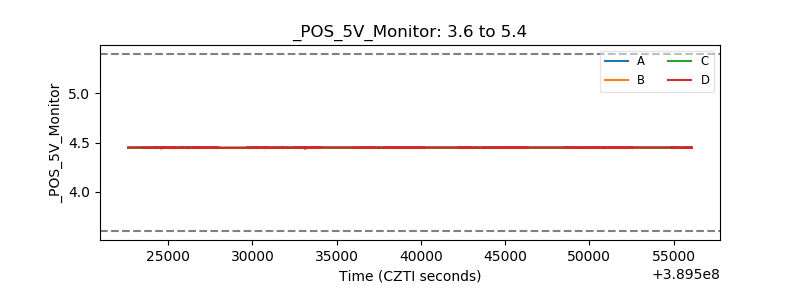 |
| _ROLL_ROT | 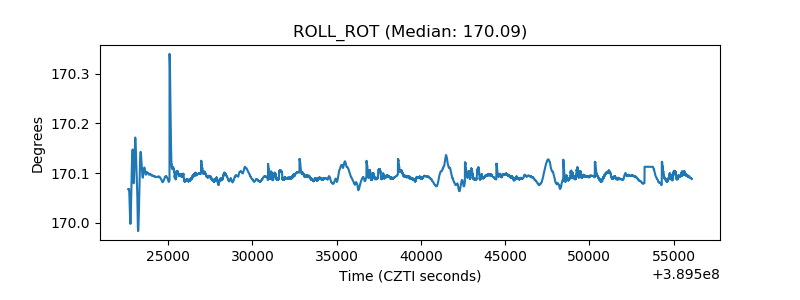 |
| _Roll_DEC | 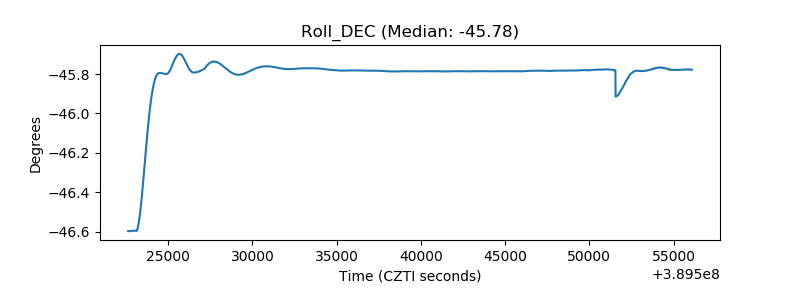 |
| _Roll_RA | 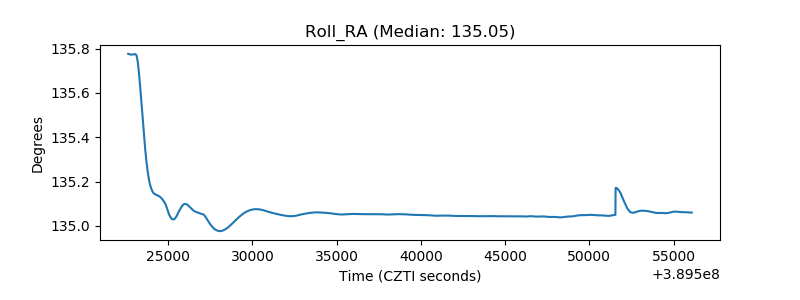 |
| Veto Counter | 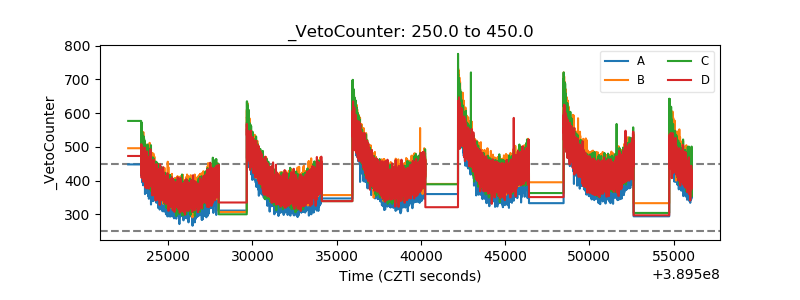 |