| Param | Original file | Final file |
|---|---|---|
| Filename | modeM0/AS1A09_142T05_9000005118cztM0_level2.fits | modeM0/AS1A09_142T05_9000005118cztM0_level2_quad_clean.evt |
| Size (bytes) | 314,337,600 | 289,716,480 |
| Size | 299.8 MB | 276.3 MB |
| Events in quadrant A | 1,918,304 | 1,699,767 |
| Events in quadrant B | 1,807,478 | 1,675,435 |
| Events in quadrant C | 1,824,994 | 1,573,557 |
| Events in quadrant D | 1,613,902 | 1,470,181 |
| Mode M0 | |||
|---|---|---|---|
| Quadrant | BADHDUFLAG | Total packets | Discarded packets |
| A | 0 | 69636 | 0 |
| B | 0 | 80110 | 0 |
| C | 0 | 85875 | 0 |
| D | 0 | 78904 | 0 |
| Mode SS | |||
|---|---|---|---|
| Quadrant | BADHDUFLAG | Total packets | Discarded packets |
| A | 0 | 702 | 0 |
| B | 0 | 702 | 0 |
| C | 0 | 702 | 0 |
| D | 0 | 702 | 0 |
| Mode M9 | |||
|---|---|---|---|
| Quadrant | BADHDUFLAG | Total packets | Discarded packets |
| A | 0 | 111 | 0 |
| B | 0 | 111 | 0 |
| C | 0 | 111 | 0 |
| D | 0 | 111 | 0 |
| Quadrant | Total seconds | Saturated seconds | Saturation percentage |
|---|---|---|---|
| A | 34262 | 42 | 0.122585% |
| B | 34262 | 963 | 2.810694% |
| C | 34262 | 1216 | 3.549121% |
| D | 34262 | 594 | 1.733699% |
Noise dominated data is calculated using 1-second bins in cleaned event files. If a bin has >2000 counts, and if more than 50% of those come from <1% of pixels, then it is considered to be noise-dominated and hence unusable.
| Quadrant | # 1 sec bins | Bins with >0 counts | Bins with >2000 counts | High rate bins dominated by noise | Noise dominated (total time) | Noise dominated (detector-on time) | Marked lightcurve |
|---|---|---|---|---|---|---|---|
| A | 45523 | 34262 | 0 | 0 | 0.00% | 0.00% | 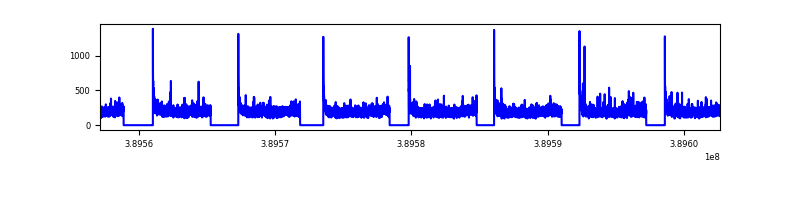 |
| B | 45523 | 34256 | 0 | 0 | 0.00% | 0.00% |  |
| C | 45523 | 34253 | 0 | 0 | 0.00% | 0.00% |  |
| D | 45523 | 34249 | 0 | 0 | 0.00% | 0.00% |  |
Top three noisy pixels from each quadrant. If the there are fewer than three noisy pixels in the level2.evt file, extra rows are filled as -1
| Pixel properties | Quadrant properties | ||||||
|---|---|---|---|---|---|---|---|
| Quadrant | DetID | PixID | Counts | Sigma | Mean | Median | Sigma |
| A | 9 | 19 | 1582 | 8.74 | 499 | 467 | 127.5 |
| A | 7 | 110 | 1568 | 8.63 | 499 | 467 | 127.5 |
| A | 0 | 29 | 1505 | 8.14 | 499 | 467 | 127.5 |
| B | 2 | 9 | 1604 | 11.97 | 477 | 453 | 96.1 |
| B | 3 | 80 | 1435 | 10.22 | 477 | 453 | 96.1 |
| B | 2 | 8 | 1297 | 8.78 | 477 | 453 | 96.1 |
| C | 3 | 202 | 1399 | 7.47 | 483 | 450 | 127.1 |
| C | 3 | 203 | 1394 | 7.43 | 483 | 450 | 127.1 |
| C | 3 | 187 | 1237 | 6.19 | 483 | 450 | 127.1 |
| D | 4 | 160 | 1267 | 6.77 | 460 | 419 | 125.3 |
| D | 6 | 38 | 1195 | 6.19 | 460 | 419 | 125.3 |
| D | 1 | 3 | 1183 | 6.1 | 460 | 419 | 125.3 |
Histogram calculated using DETX and DETY for each event in the final _common_clean file
| Quadrant A | 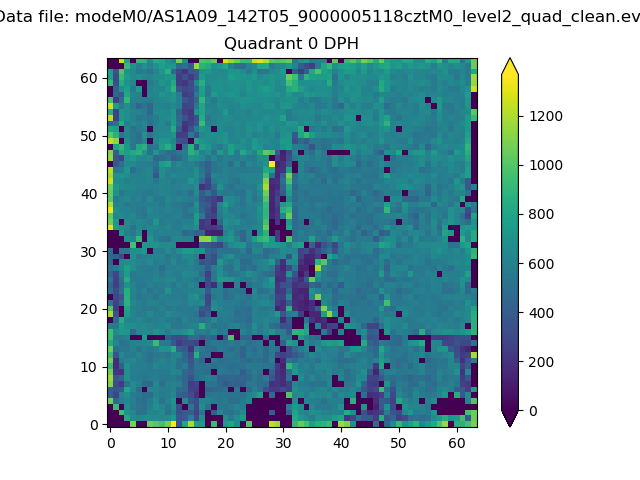 |
 |
Quadrant B |
|---|---|---|---|
| Quadrant D |  |
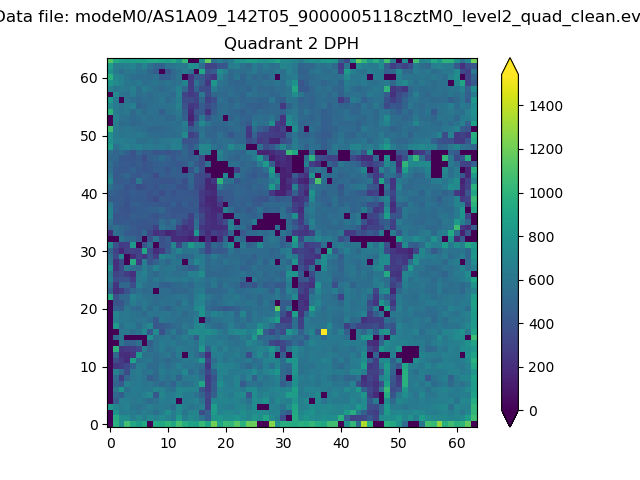 |
Quadrant C |
| Plot type | Count rate plots | Images |
|---|---|---|
| Comparison with Poisson distribution Blue bars denote a histogram of data divided into 1 sec bins. Red curve is a Poisson curve with rate = median count rate of data. |
 |
 |
| Quadrant-wise count rates Data is divided into 100 sec bins |
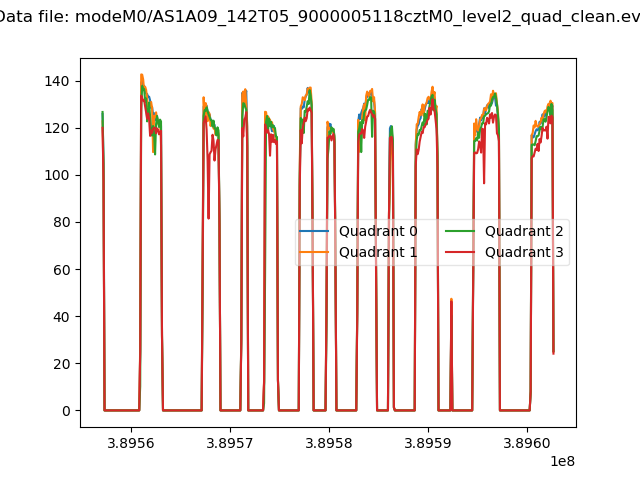 |
|
| Module-wise count rates for Quadrant A Data is divided into 100 sec bins |
 |
 |
| Module-wise count rates for Quadrant B Data is divided into 100 sec bins |
 |
 |
| Module-wise count rates for Quadrant C Data is divided into 100 sec bins |
 |
 |
| Module-wise count rates for Quadrant D Data is divided into 100 sec bins |
 |
 |
| Parameter | Plot |
|---|---|
| CZT HV Monitor |  |
| D_VDD | 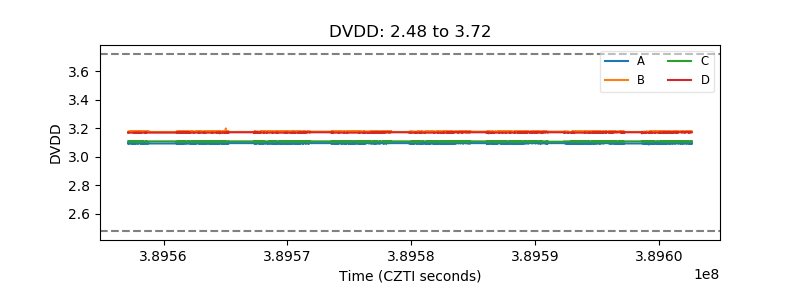 |
| Temperature 1 |  |
| Veto HV Monitor | 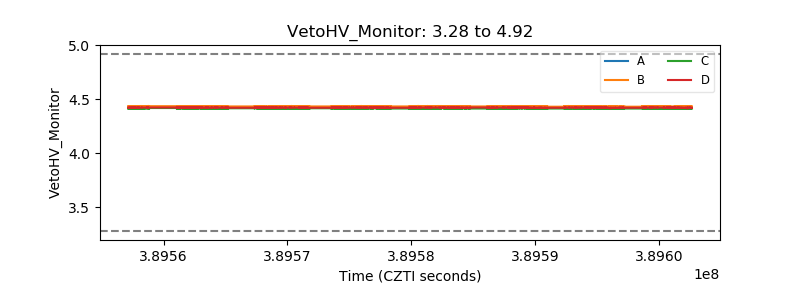 |
| Veto LLD | 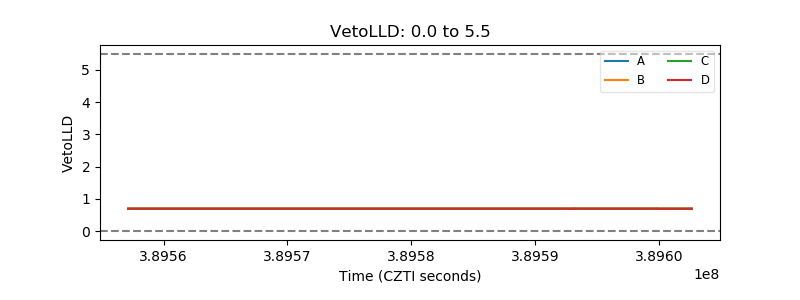 |
| Alpha Counter |  |
| _CPM_Rate | 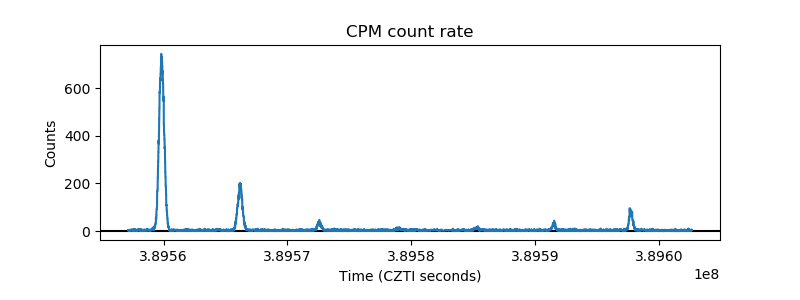 |
| CZT Counter |  |
| +2.5 Volts monitor |  |
| +5 Volts monitor |  |
| _ROLL_ROT | 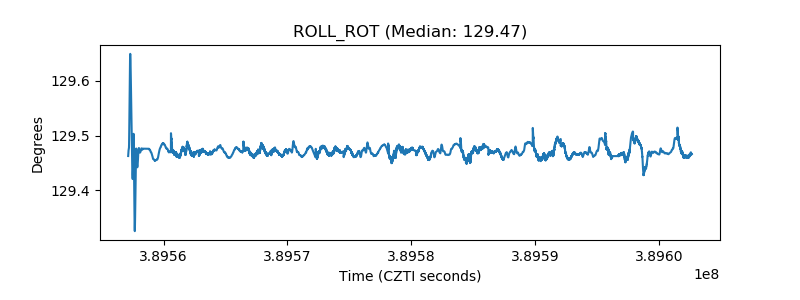 |
| _Roll_DEC |  |
| _Roll_RA | 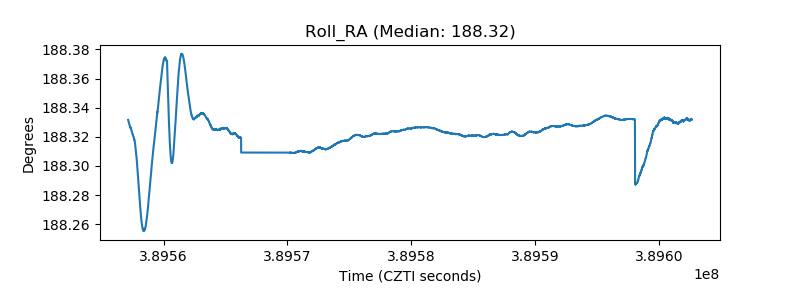 |
| Veto Counter |  |