| Param | Original file | Final file |
|---|---|---|
| Filename | modeM0/AS1A09_029T05_9000005124cztM0_level2.fits | modeM0/AS1A09_029T05_9000005124cztM0_level2_quad_clean.evt |
| Size (bytes) | 292,495,680 | 267,186,240 |
| Size | 278.9 MB | 254.8 MB |
| Events in quadrant A | 1,792,102 | 1,558,608 |
| Events in quadrant B | 1,700,552 | 1,552,256 |
| Events in quadrant C | 1,713,876 | 1,473,453 |
| Events in quadrant D | 1,502,140 | 1,356,994 |
| Mode SS | |||
|---|---|---|---|
| Quadrant | BADHDUFLAG | Total packets | Discarded packets |
| A | 0 | 638 | 0 |
| B | 0 | 638 | 0 |
| C | 0 | 638 | 0 |
| D | 0 | 638 | 0 |
| Mode M0 | |||
|---|---|---|---|
| Quadrant | BADHDUFLAG | Total packets | Discarded packets |
| A | 0 | 65789 | 0 |
| B | 0 | 67930 | 0 |
| C | 0 | 71077 | 0 |
| D | 0 | 71382 | 0 |
| Mode M9 | |||
|---|---|---|---|
| Quadrant | BADHDUFLAG | Total packets | Discarded packets |
| A | 0 | 105 | 0 |
| B | 0 | 105 | 0 |
| C | 0 | 105 | 0 |
| D | 0 | 105 | 0 |
| Quadrant | Total seconds | Saturated seconds | Saturation percentage |
|---|---|---|---|
| A | 31271 | 160 | 0.511656% |
| B | 31271 | 318 | 1.016917% |
| C | 31270 | 438 | 1.400704% |
| D | 31271 | 527 | 1.685268% |
Noise dominated data is calculated using 1-second bins in cleaned event files. If a bin has >2000 counts, and if more than 50% of those come from <1% of pixels, then it is considered to be noise-dominated and hence unusable.
| Quadrant | # 1 sec bins | Bins with >0 counts | Bins with >2000 counts | High rate bins dominated by noise | Noise dominated (total time) | Noise dominated (detector-on time) | Marked lightcurve |
|---|---|---|---|---|---|---|---|
| A | 54118 | 31269 | 0 | 0 | 0.00% | 0.00% | 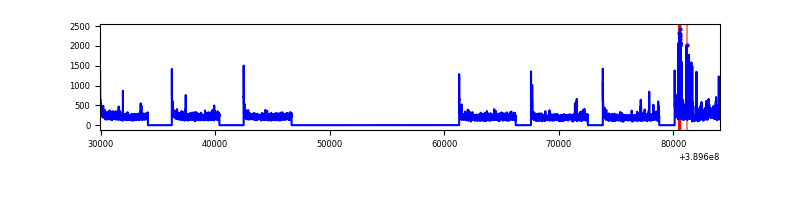 |
| B | 54118 | 31268 | 0 | 0 | 0.00% | 0.00% |  |
| C | 54118 | 31262 | 0 | 0 | 0.00% | 0.00% |  |
| D | 54118 | 31263 | 0 | 0 | 0.00% | 0.00% |  |
Top three noisy pixels from each quadrant. If the there are fewer than three noisy pixels in the level2.evt file, extra rows are filled as -1
| Pixel properties | Quadrant properties | ||||||
|---|---|---|---|---|---|---|---|
| Quadrant | DetID | PixID | Counts | Sigma | Mean | Median | Sigma |
| A | 7 | 110 | 1501 | 9.04 | 467 | 439 | 117.5 |
| A | 9 | 19 | 1494 | 8.98 | 467 | 439 | 117.5 |
| A | 0 | 29 | 1437 | 8.5 | 467 | 439 | 117.5 |
| B | 2 | 9 | 1452 | 11.38 | 450 | 431 | 89.7 |
| B | 3 | 80 | 1306 | 9.75 | 450 | 431 | 89.7 |
| B | 3 | 17 | 1214 | 8.72 | 450 | 431 | 89.7 |
| C | 3 | 202 | 1404 | 8.35 | 452 | 424 | 117.4 |
| C | 1 | 80 | 1389 | 8.22 | 452 | 424 | 117.4 |
| C | 1 | 81 | 1367 | 8.03 | 452 | 424 | 117.4 |
| D | 7 | 3 | 1112 | 6.19 | 430 | 393 | 116.2 |
| D | 6 | 67 | 1111 | 6.18 | 430 | 393 | 116.2 |
| D | 4 | 160 | 1102 | 6.1 | 430 | 393 | 116.2 |
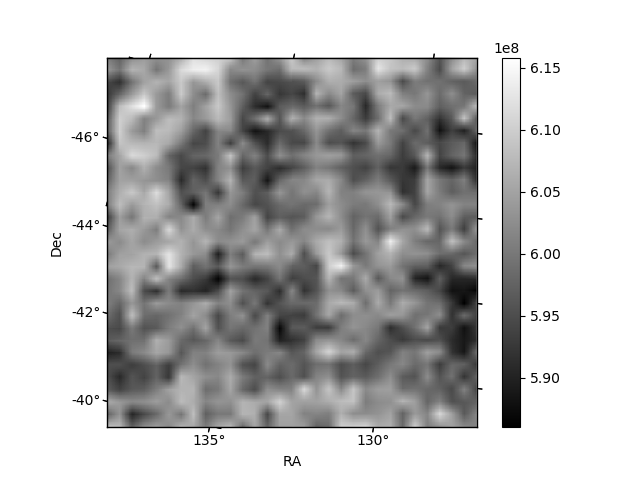
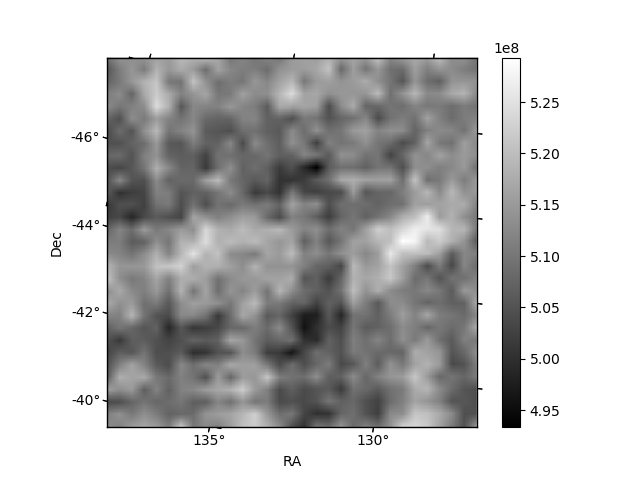
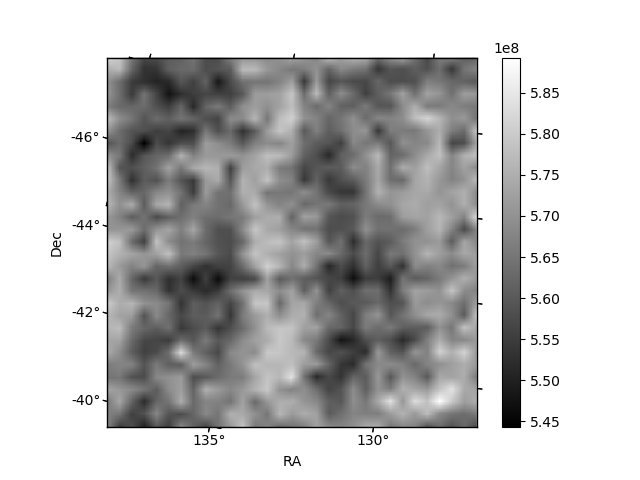
Histogram calculated using DETX and DETY for each event in the final _common_clean file
| Quadrant A |  |
 |
Quadrant B |
|---|---|---|---|
| Quadrant D |  |
 |
Quadrant C |
| Plot type | Count rate plots | Images |
|---|---|---|
| Comparison with Poisson distribution Blue bars denote a histogram of data divided into 1 sec bins. Red curve is a Poisson curve with rate = median count rate of data. |
 |
 |
| Quadrant-wise count rates Data is divided into 100 sec bins |
 |
|
| Module-wise count rates for Quadrant A Data is divided into 100 sec bins |
 |
 |
| Module-wise count rates for Quadrant B Data is divided into 100 sec bins |
 |
 |
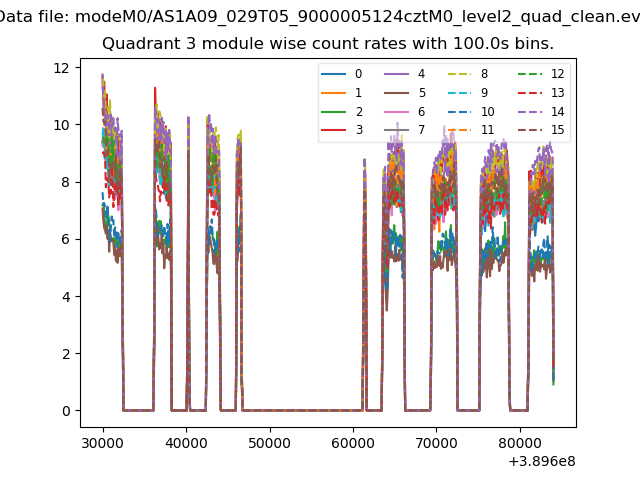
| Module-wise count rates for Quadrant C Data is divided into 100 sec bins |
 |
 |
| Module-wise count rates for Quadrant D Data is divided into 100 sec bins |
 |
 |
| Parameter | Plot |
|---|---|
| CZT HV Monitor |  |
| D_VDD |  |
| Temperature 1 | 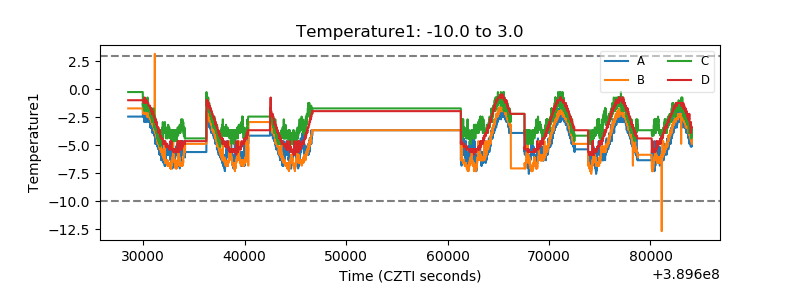 |
| Veto HV Monitor |  |
| Veto LLD | 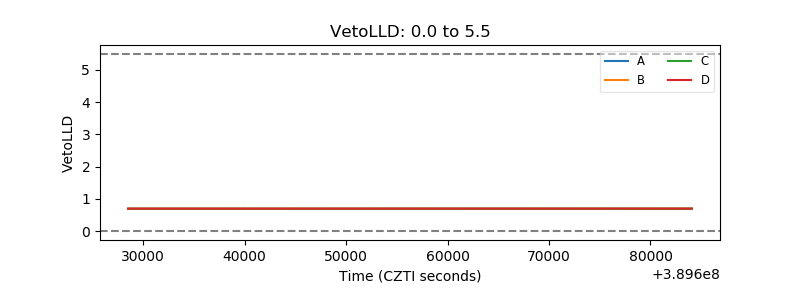 |
| Alpha Counter | 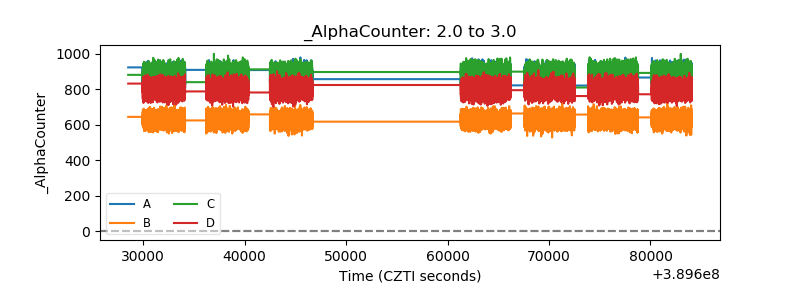 |
| _CPM_Rate |  |
| CZT Counter |  |
| +2.5 Volts monitor |  |
| +5 Volts monitor | 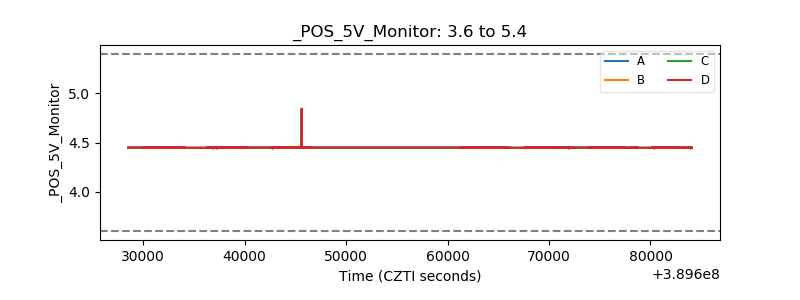 |
| _ROLL_ROT | 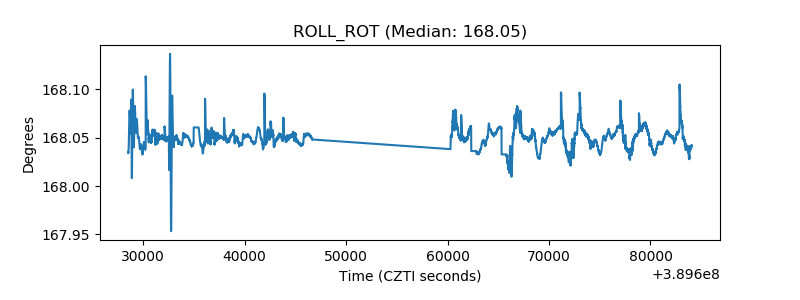 |
| _Roll_DEC |  |
| _Roll_RA | 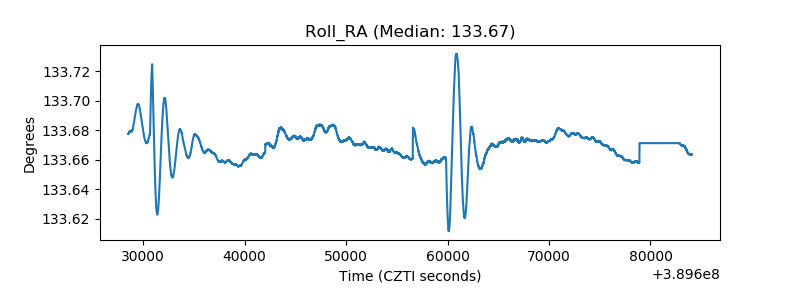 |
| Veto Counter | 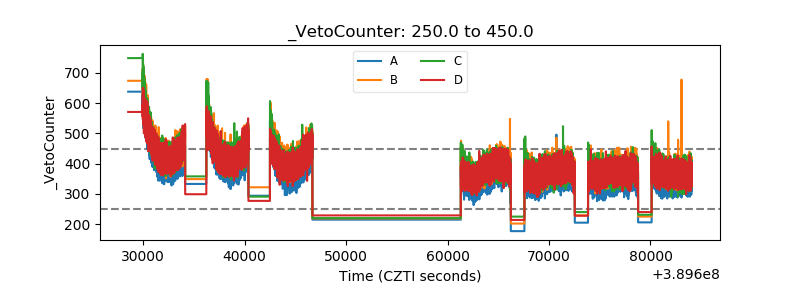 |