| Param | Original file | Final file |
|---|---|---|
| Filename | modeM0/AS1A09_029T05_9000005124_35729cztM0_level2.evt | modeM0/AS1A09_029T05_9000005124_35729cztM0_level2_quad_clean.evt |
| Size (bytes) | 403,024,320 | 63,282,240 |
| Size | 384.4 MB | 60.4 MB |
| Events in quadrant A | 2,620,365 | 389,988 |
| Events in quadrant B | 2,957,492 | 392,700 |
| Events in quadrant C | 3,118,540 | 374,630 |
| Events in quadrant D | 3,129,432 | 368,043 |
| Mode SS | |||
|---|---|---|---|
| Quadrant | BADHDUFLAG | Total packets | Discarded packets |
| A | 0 | 114 | 0 |
| B | 0 | 114 | 0 |
| C | 0 | 114 | 0 |
| D | 0 | 114 | 0 |
| Mode M0 | |||
|---|---|---|---|
| Quadrant | BADHDUFLAG | Total packets | Discarded packets |
| A | 0 | 11412 | 3 |
| B | 0 | 12433 | 2 |
| C | 0 | 12771 | 2 |
| D | 0 | 13204 | 2 |
| Mode M9 | |||
|---|---|---|---|
| Quadrant | BADHDUFLAG | Total packets | Discarded packets |
| A | 0 | 29 | 0 |
| B | 0 | 29 | 0 |
| C | 0 | 29 | 0 |
| D | 0 | 30 | 0 |
| Quadrant | Total seconds | Saturated seconds | Saturation percentage |
|---|---|---|---|
| A | 5583 | 5 | 0.089558% |
| B | 5583 | 72 | 1.289629% |
| C | 5583 | 114 | 2.041913% |
| D | 5583 | 76 | 1.361275% |
Noise dominated data is calculated using 1-second bins in cleaned event files. If a bin has >2000 counts, and if more than 50% of those come from <1% of pixels, then it is considered to be noise-dominated and hence unusable.
| Quadrant | # 1 sec bins | Bins with >0 counts | Bins with >2000 counts | High rate bins dominated by noise | Noise dominated (total time) | Noise dominated (detector-on time) | Marked lightcurve |
|---|---|---|---|---|---|---|---|
| A | 7136 | 5584 | 0 | 0 | 0.00% | 0.00% | 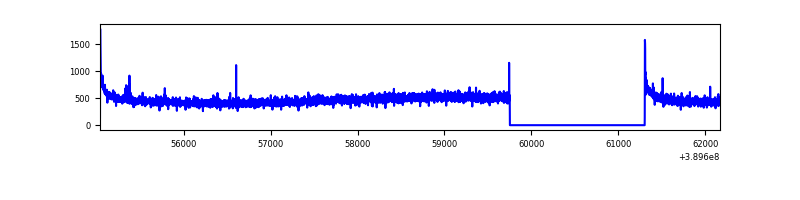 |
| B | 7136 | 5584 | 56 | 56 | 0.78% | 1.00% | 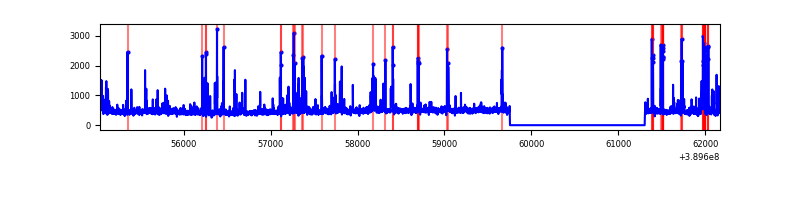 |
| C | 7136 | 5584 | 91 | 91 | 1.28% | 1.63% | 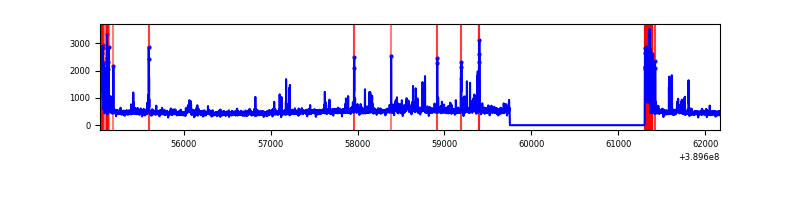 |
| D | 7136 | 5584 | 88 | 88 | 1.23% | 1.58% | 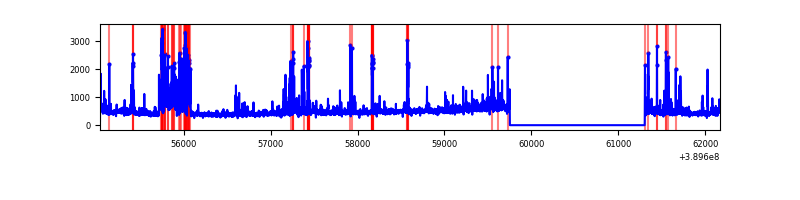 |
Top three noisy pixels from each quadrant. If the there are fewer than three noisy pixels in the level2.evt file, extra rows are filled as -1
| Pixel properties | Quadrant properties | ||||||
|---|---|---|---|---|---|---|---|
| Quadrant | DetID | PixID | Counts | Sigma | Mean | Median | Sigma |
| A | 10 | 83 | 150624 | 1161.86 | 633 | 620 | 129.1 |
| A | 13 | 6 | 13802 | 102.1 | 633 | 620 | 129.1 |
| A | 13 | 254 | 8797 | 63.34 | 633 | 620 | 129.1 |
| B | 5 | 172 | 306038 | 2513.09 | 626 | 610 | 121.5 |
| B | 5 | 255 | 78082 | 637.45 | 626 | 610 | 121.5 |
| B | 15 | 85 | 44085 | 357.72 | 626 | 610 | 121.5 |
| C | 0 | 10 | 296691 | 2102.33 | 605 | 609 | 140.8 |
| C | 15 | 214 | 235058 | 1664.7 | 605 | 609 | 140.8 |
| C | 1 | 23 | 120337 | 850.13 | 605 | 609 | 140.8 |
| D | 14 | 52 | 303355 | 2018.87 | 609 | 590 | 150.0 |
| D | 13 | 249 | 198991 | 1322.96 | 609 | 590 | 150.0 |
| D | 10 | 203 | 51519 | 339.6 | 609 | 590 | 150.0 |
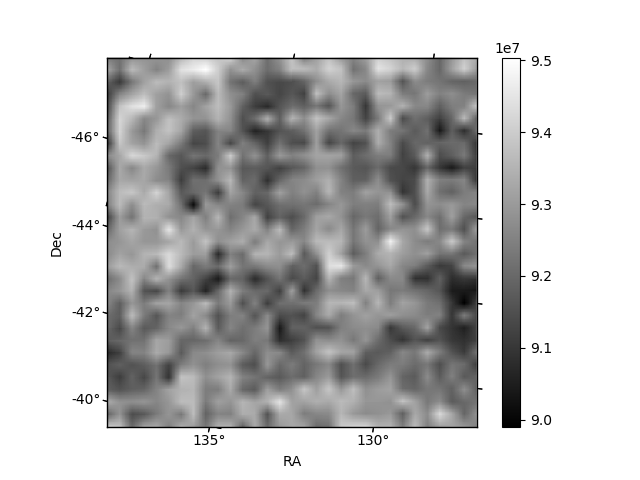
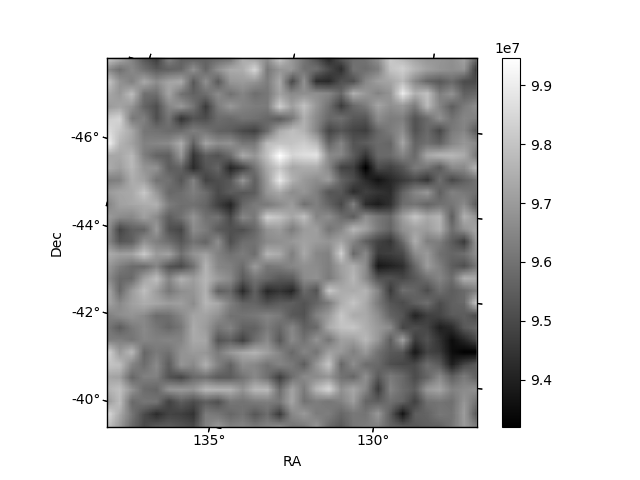
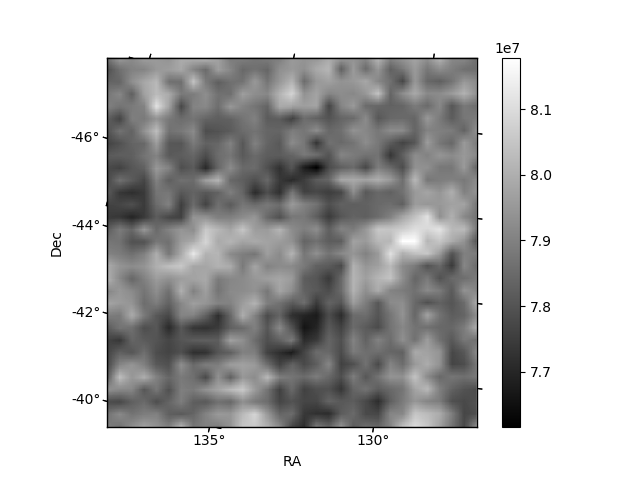
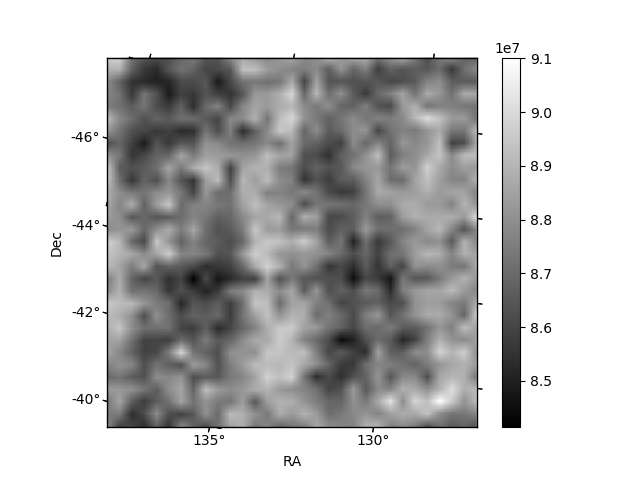
Histogram calculated using DETX and DETY for each event in the final _common_clean file
| Quadrant A | 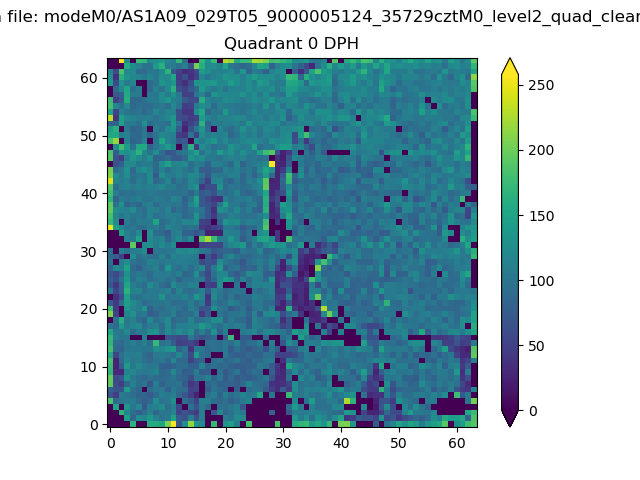 |
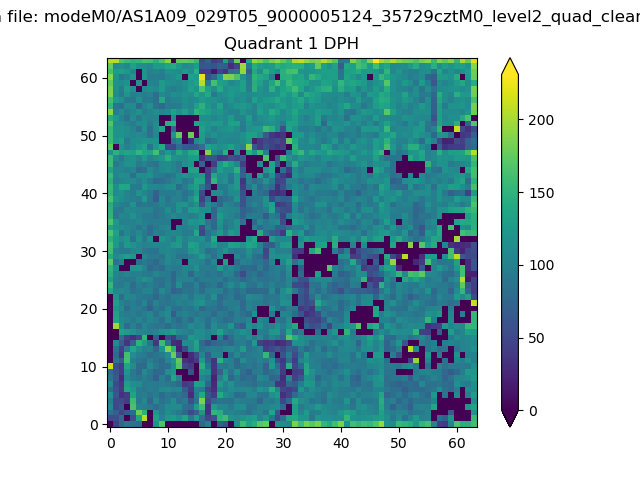 |
Quadrant B |
|---|---|---|---|
| Quadrant D | 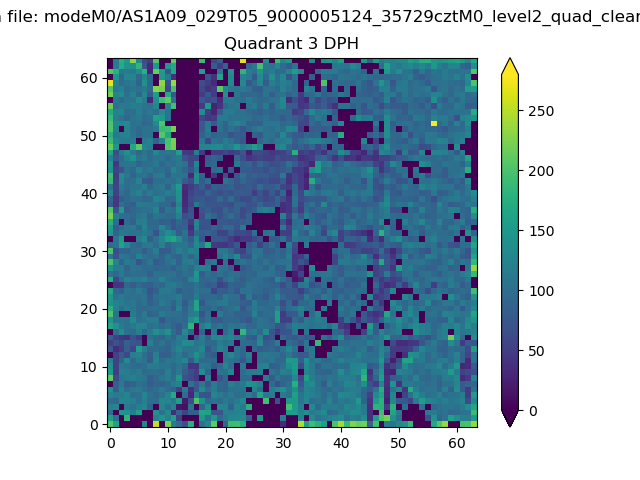 |
 |
Quadrant C |
| Plot type | Count rate plots | Images |
|---|---|---|
| Comparison with Poisson distribution Blue bars denote a histogram of data divided into 1 sec bins. Red curve is a Poisson curve with rate = median count rate of data. |
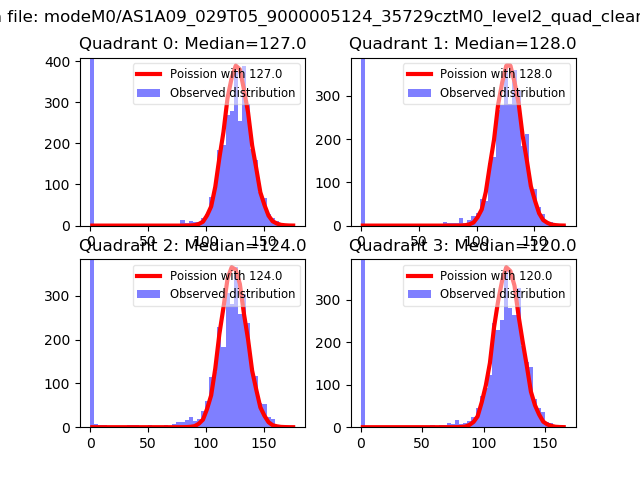 |
 |
| Quadrant-wise count rates Data is divided into 100 sec bins |
 |
|
| Module-wise count rates for Quadrant A Data is divided into 100 sec bins |
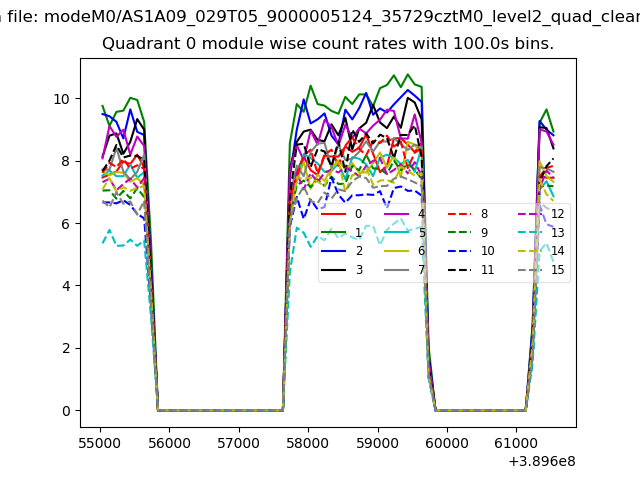 |
 |
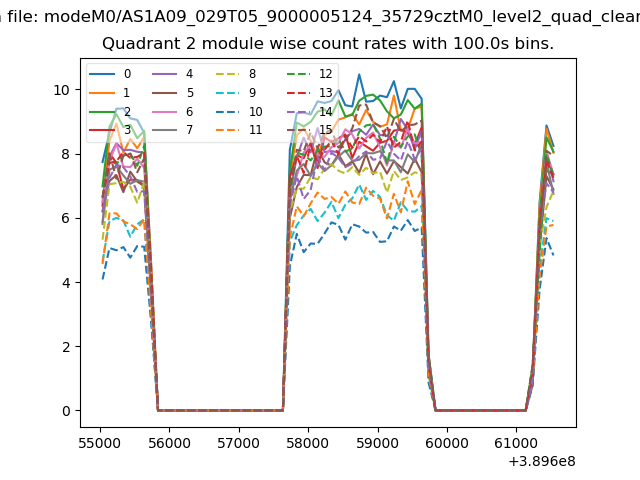
| Module-wise count rates for Quadrant B Data is divided into 100 sec bins |
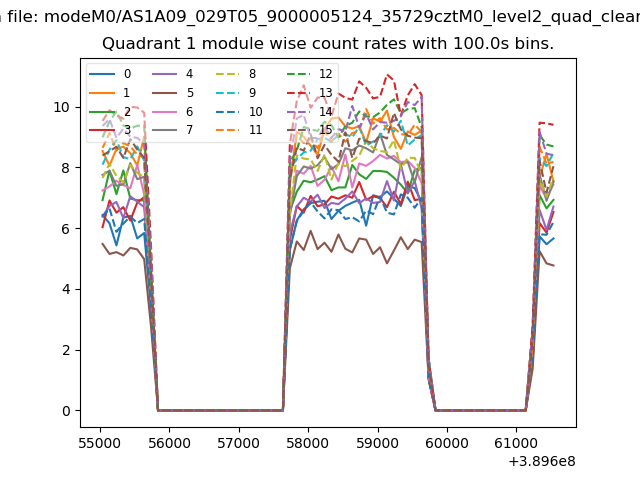 |
 |
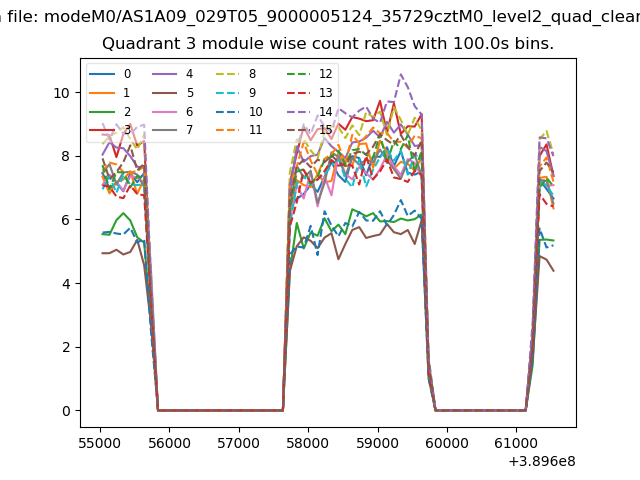
| Module-wise count rates for Quadrant C Data is divided into 100 sec bins |
 |
 |
| Module-wise count rates for Quadrant D Data is divided into 100 sec bins |
 |
 |
| Parameter | Plot |
|---|---|
| CZT HV Monitor | 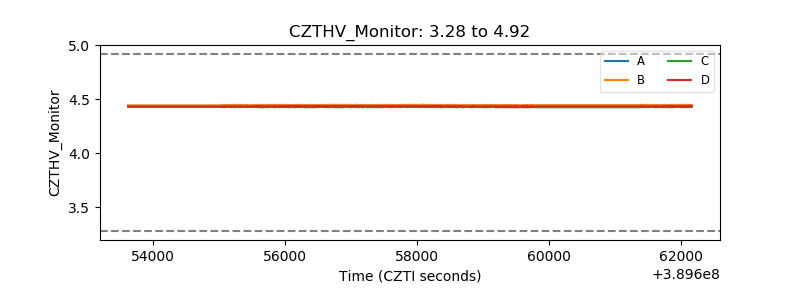 |
| D_VDD | 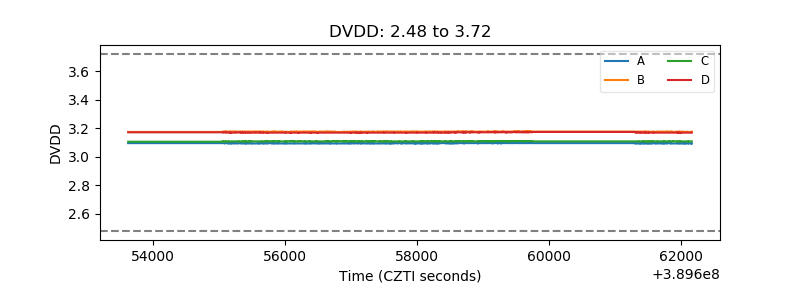 |
| Temperature 1 | 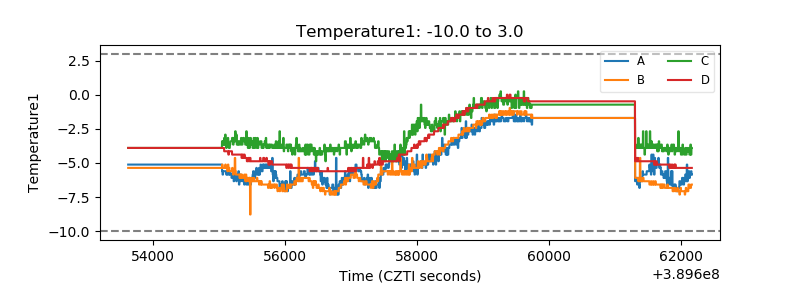 |
| Veto HV Monitor | 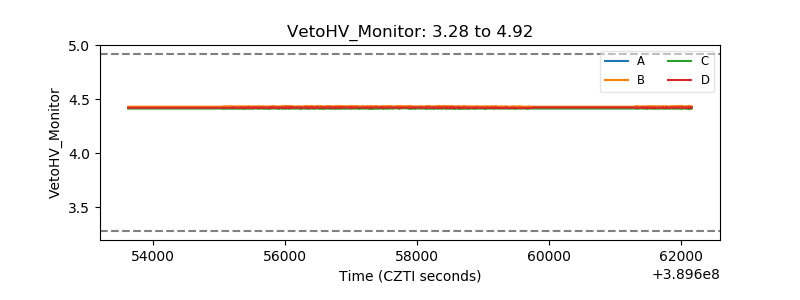 |
| Veto LLD | 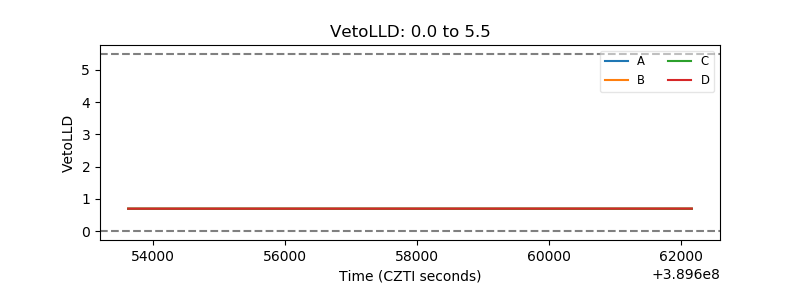 |
| Alpha Counter | 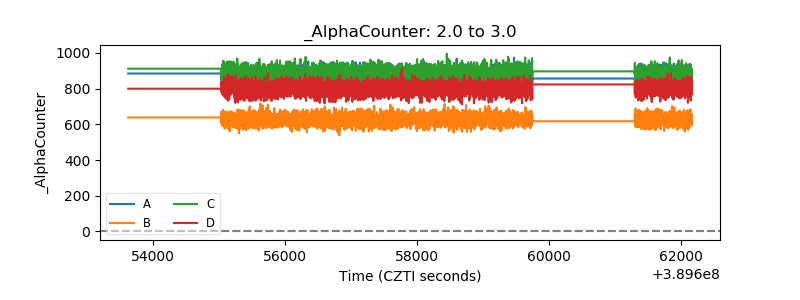 |
| _CPM_Rate | 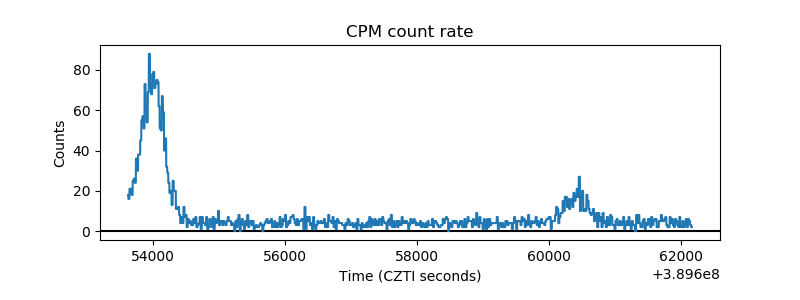 |
| CZT Counter | 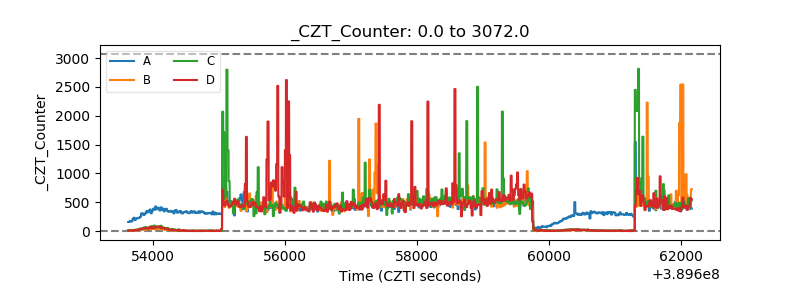 |
| +2.5 Volts monitor |  |
| +5 Volts monitor |  |
| _ROLL_ROT | 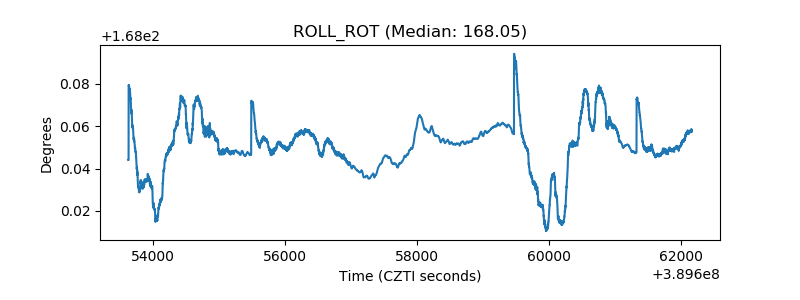 |
| _Roll_DEC | 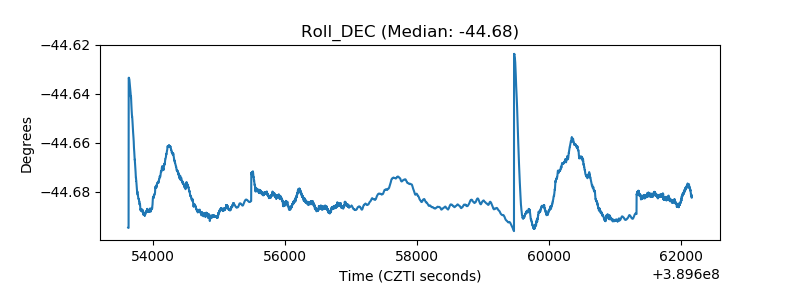 |
| _Roll_RA |  |
| Veto Counter | 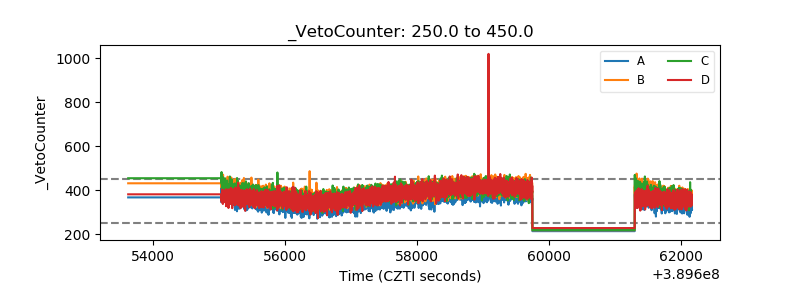 |