| Param | Original file | Final file |
|---|---|---|
| Filename | modeM0/AS1A09_029T05_9000005124_35730cztM0_level2.evt | modeM0/AS1A09_029T05_9000005124_35730cztM0_level2_quad_clean.evt |
| Size (bytes) | 1,015,891,200 | 153,996,480 |
| Size | 968.8 MB | 146.9 MB |
| Events in quadrant A | 6,605,847 | 949,920 |
| Events in quadrant B | 7,360,114 | 952,461 |
| Events in quadrant C | 8,069,850 | 915,850 |
| Events in quadrant D | 7,785,416 | 879,953 |
| Mode SS | |||
|---|---|---|---|
| Quadrant | BADHDUFLAG | Total packets | Discarded packets |
| A | 0 | 286 | 0 |
| B | 0 | 286 | 0 |
| C | 0 | 286 | 0 |
| D | 0 | 286 | 0 |
| Mode M0 | |||
|---|---|---|---|
| Quadrant | BADHDUFLAG | Total packets | Discarded packets |
| A | 0 | 28488 | 5 |
| B | 0 | 30857 | 3 |
| C | 0 | 32928 | 3 |
| D | 0 | 32759 | 3 |
| Mode M9 | |||
|---|---|---|---|
| Quadrant | BADHDUFLAG | Total packets | Discarded packets |
| A | 0 | 43 | 0 |
| B | 0 | 43 | 0 |
| C | 0 | 43 | 0 |
| D | 0 | 43 | 0 |
| Quadrant | Total seconds | Saturated seconds | Saturation percentage |
|---|---|---|---|
| A | 13972 | 13 | 0.093043% |
| B | 13972 | 184 | 1.316920% |
| C | 13972 | 189 | 1.352705% |
| D | 13972 | 304 | 2.175780% |
Noise dominated data is calculated using 1-second bins in cleaned event files. If a bin has >2000 counts, and if more than 50% of those come from <1% of pixels, then it is considered to be noise-dominated and hence unusable.
| Quadrant | # 1 sec bins | Bins with >0 counts | Bins with >2000 counts | High rate bins dominated by noise | Noise dominated (total time) | Noise dominated (detector-on time) | Marked lightcurve |
|---|---|---|---|---|---|---|---|
| A | 32072 | 13975 | 0 | 0 | 0.00% | 0.00% | 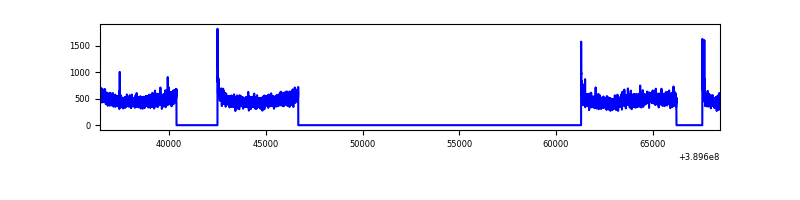 |
| B | 32072 | 13975 | 136 | 136 | 0.42% | 0.97% | 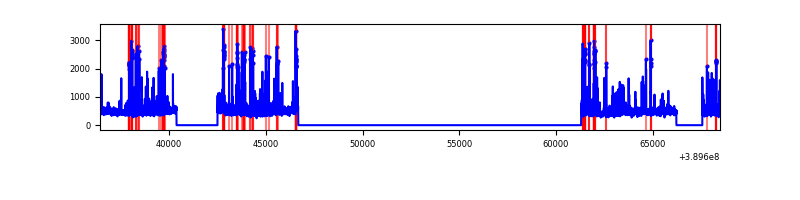 |
| C | 32072 | 13975 | 170 | 170 | 0.53% | 1.22% | 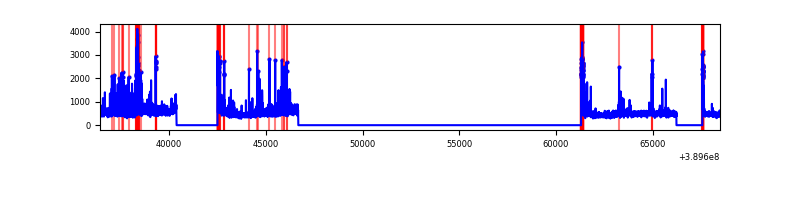 |
| D | 32072 | 13974 | 268 | 268 | 0.84% | 1.92% | 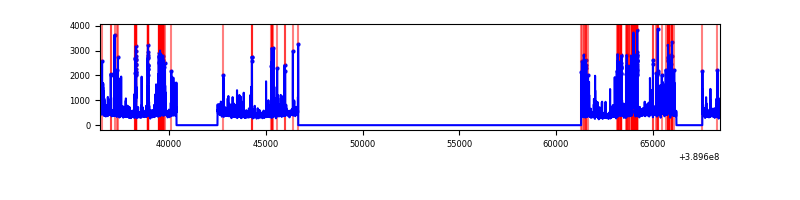 |
Top three noisy pixels from each quadrant. If the there are fewer than three noisy pixels in the level2.evt file, extra rows are filled as -1
| Pixel properties | Quadrant properties | ||||||
|---|---|---|---|---|---|---|---|
| Quadrant | DetID | PixID | Counts | Sigma | Mean | Median | Sigma |
| A | 10 | 83 | 310112 | 963.3 | 1613 | 1587 | 320.3 |
| A | 13 | 6 | 41458 | 124.49 | 1613 | 1587 | 320.3 |
| A | 13 | 254 | 21221 | 61.3 | 1613 | 1587 | 320.3 |
| B | 5 | 172 | 704200 | 2322.03 | 1598 | 1554 | 302.6 |
| B | 15 | 85 | 97222 | 316.15 | 1598 | 1554 | 302.6 |
| B | 5 | 255 | 89889 | 291.92 | 1598 | 1554 | 302.6 |
| C | 0 | 207 | 691616 | 1950.15 | 1540 | 1550 | 353.9 |
| C | 15 | 214 | 577840 | 1628.62 | 1540 | 1550 | 353.9 |
| C | 0 | 10 | 354544 | 997.57 | 1540 | 1550 | 353.9 |
| D | 13 | 249 | 895874 | 2375.64 | 1541 | 1498 | 376.5 |
| D | 10 | 199 | 182006 | 479.47 | 1541 | 1498 | 376.5 |
| D | 1 | 52 | 159445 | 419.54 | 1541 | 1498 | 376.5 |
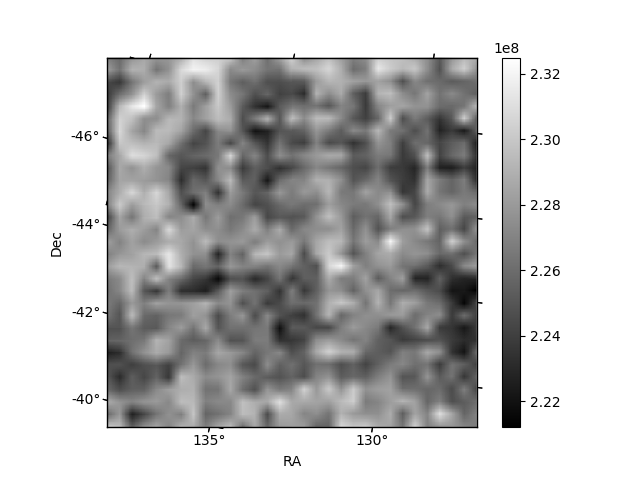
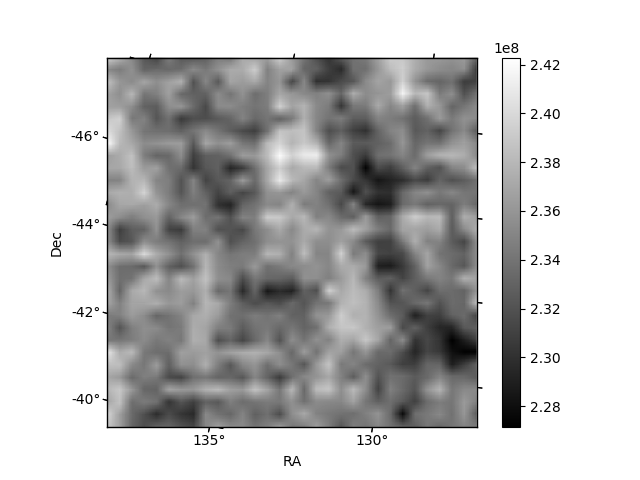
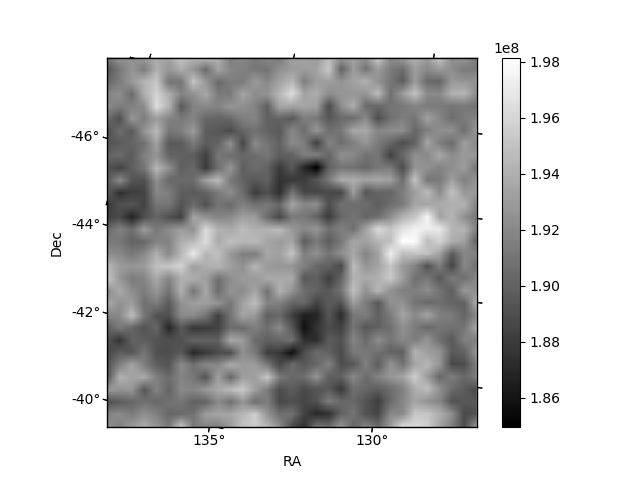
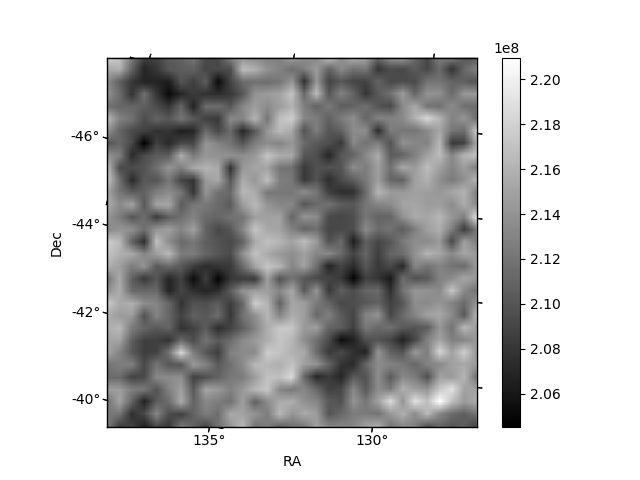
Histogram calculated using DETX and DETY for each event in the final _common_clean file
| Quadrant A | 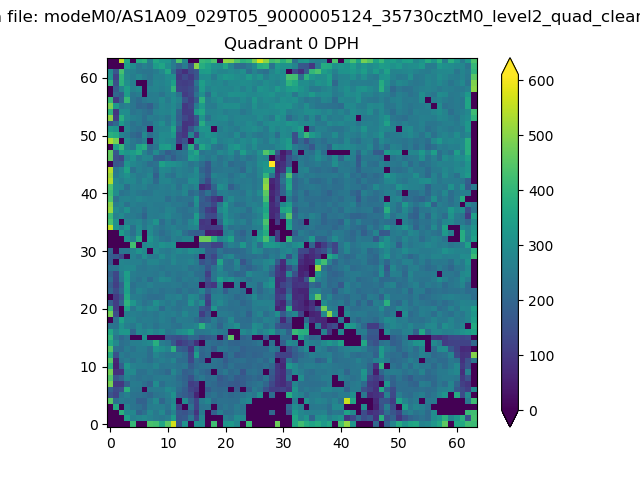 |
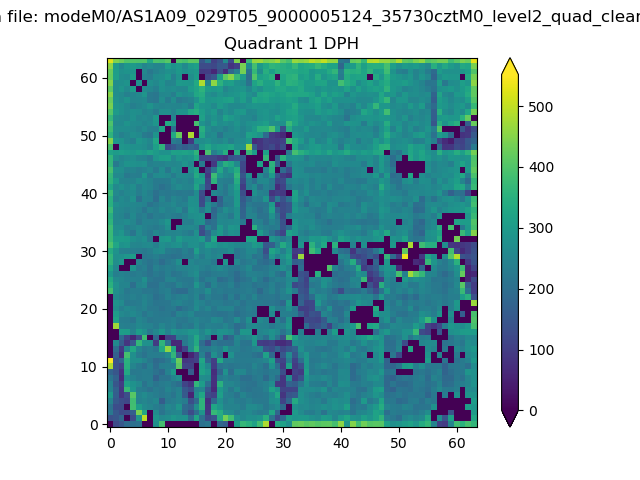 |
Quadrant B |
|---|---|---|---|
| Quadrant D | 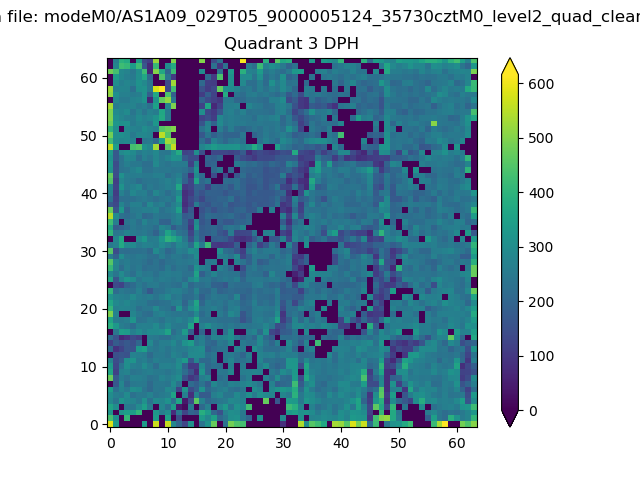 |
 |
Quadrant C |
| Plot type | Count rate plots | Images |
|---|---|---|
| Comparison with Poisson distribution Blue bars denote a histogram of data divided into 1 sec bins. Red curve is a Poisson curve with rate = median count rate of data. |
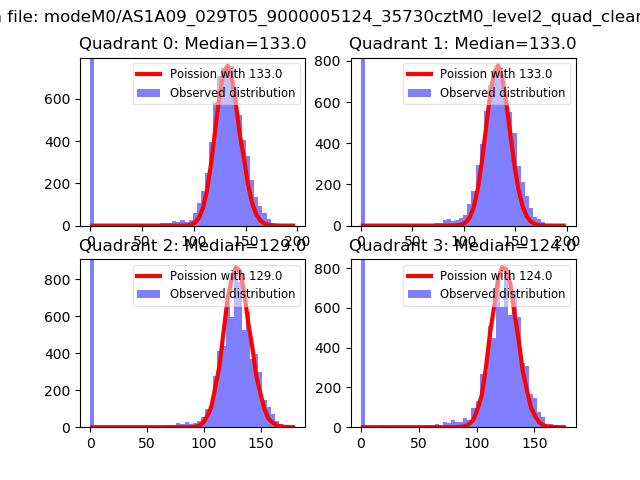 |
 |
| Quadrant-wise count rates Data is divided into 100 sec bins |
 |
|
| Module-wise count rates for Quadrant A Data is divided into 100 sec bins |
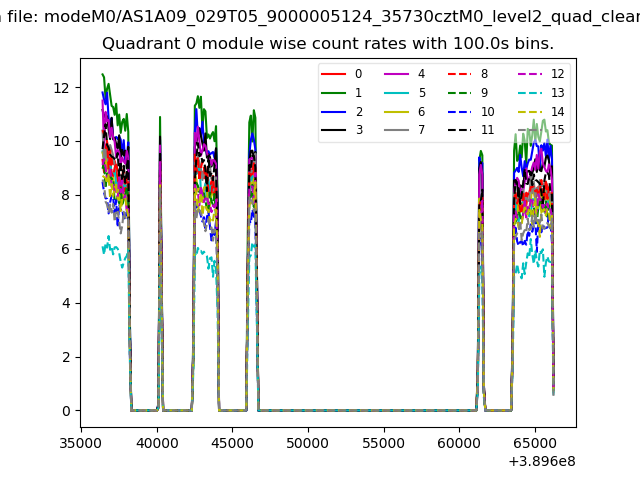 |
 |
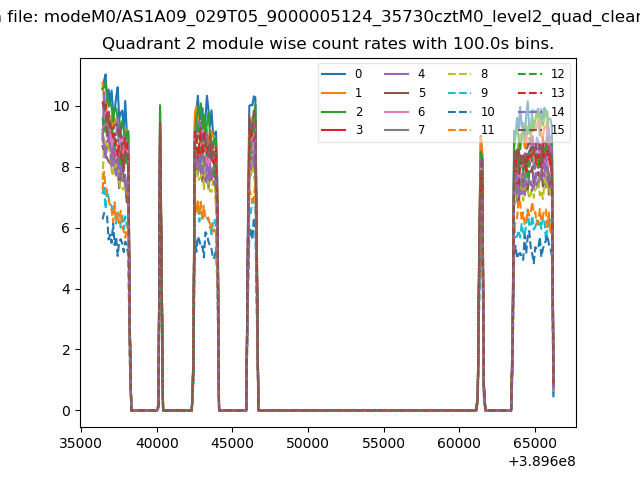
| Module-wise count rates for Quadrant B Data is divided into 100 sec bins |
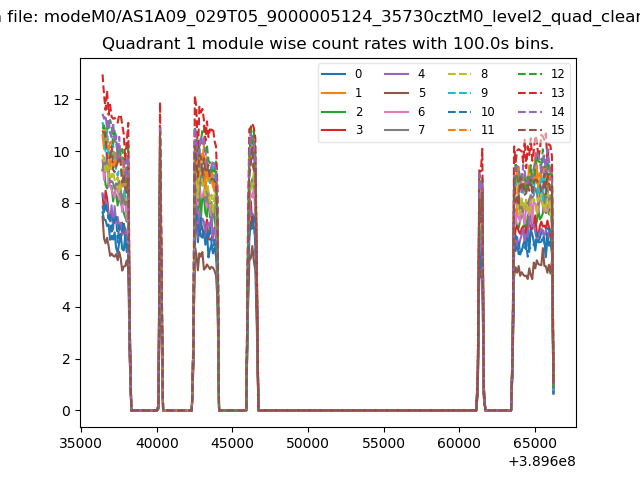 |
 |
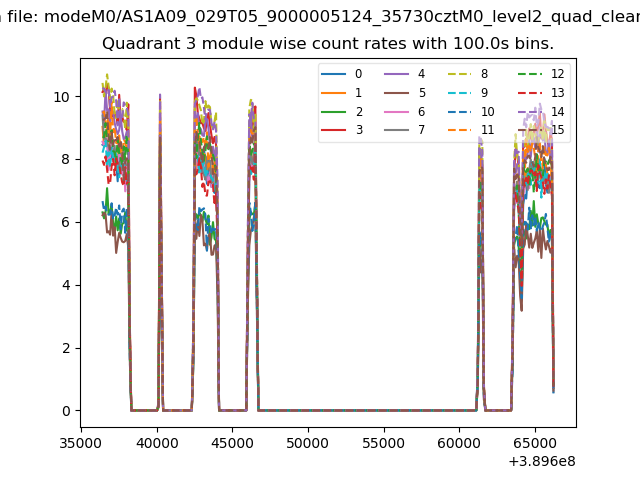
| Module-wise count rates for Quadrant C Data is divided into 100 sec bins |
 |
 |
| Module-wise count rates for Quadrant D Data is divided into 100 sec bins |
 |
 |
| Parameter | Plot |
|---|---|
| CZT HV Monitor | 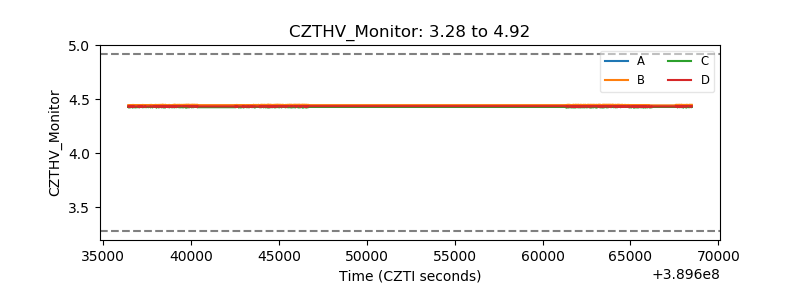 |
| D_VDD | 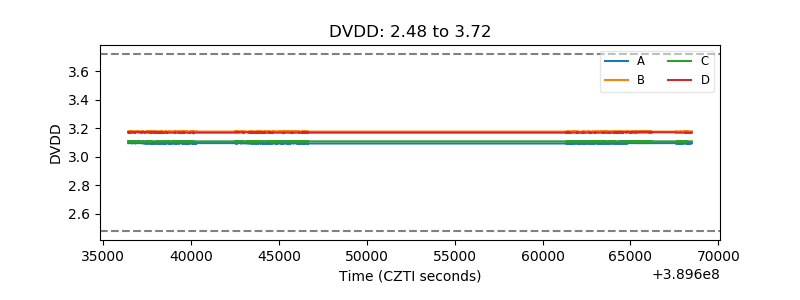 |
| Temperature 1 |  |
| Veto HV Monitor | 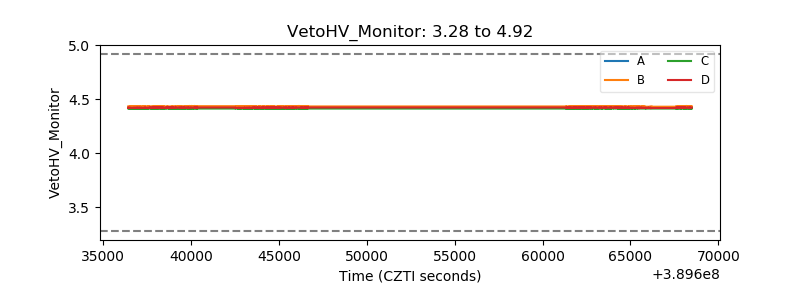 |
| Veto LLD | 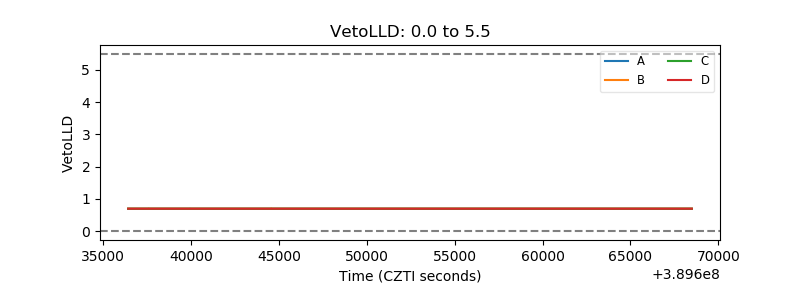 |
| Alpha Counter | 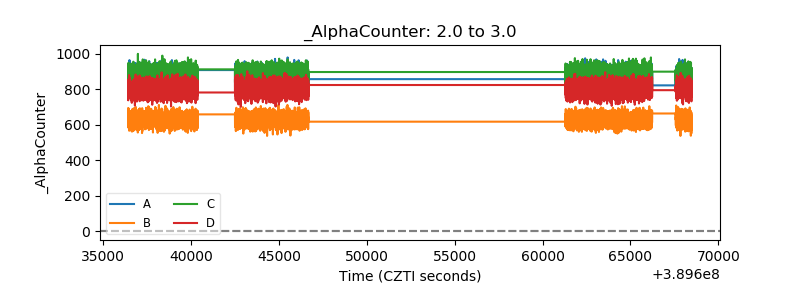 |
| _CPM_Rate |  |
| CZT Counter | 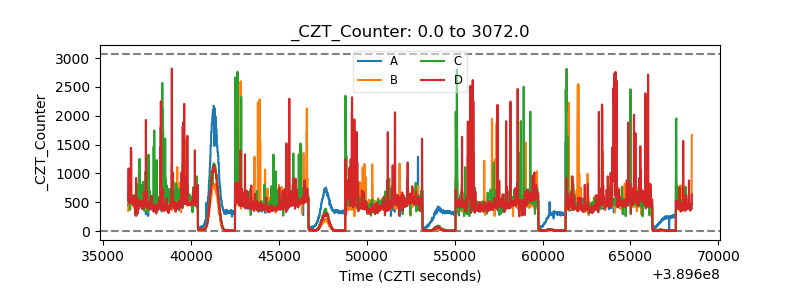 |
| +2.5 Volts monitor |  |
| +5 Volts monitor |  |
| _ROLL_ROT | 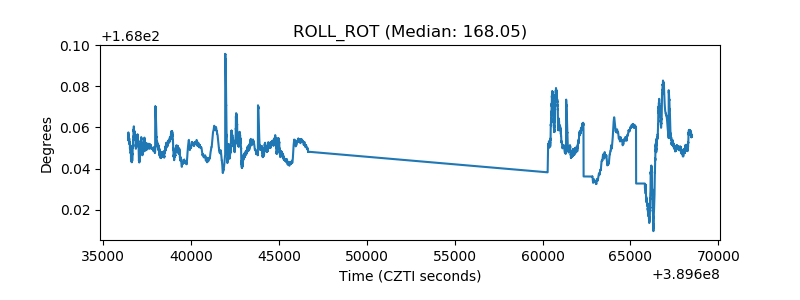 |
| _Roll_DEC | 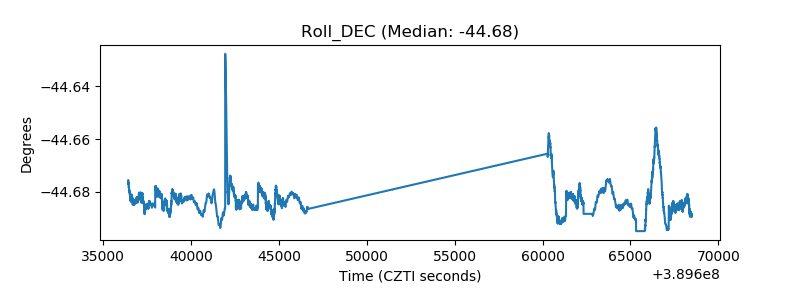 |
| _Roll_RA |  |
| Veto Counter | 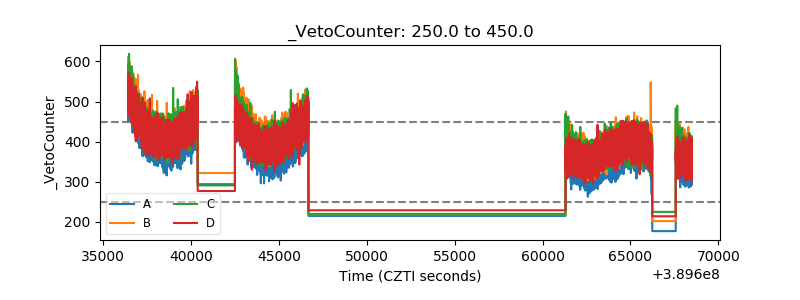 |