| Param | Original file | Final file |
|---|---|---|
| Filename | modeM0/AS1A09_143T09_9000005122cztM0_level2.fits | modeM0/AS1A09_143T09_9000005122cztM0_level2_quad_clean.evt |
| Size (bytes) | 39,977,280 | 32,114,880 |
| Size | 38.1 MB | 30.6 MB |
| Events in quadrant A | 251,780 | 185,821 |
| Events in quadrant B | 235,744 | 181,085 |
| Events in quadrant C | 239,922 | 173,421 |
| Events in quadrant D | 205,410 | 153,096 |
| Mode SS | |||
|---|---|---|---|
| Quadrant | BADHDUFLAG | Total packets | Discarded packets |
| A | 0 | 82 | 0 |
| B | 0 | 82 | 0 |
| C | 0 | 82 | 0 |
| D | 0 | 82 | 0 |
| Mode M9 | |||
|---|---|---|---|
| Quadrant | BADHDUFLAG | Total packets | Discarded packets |
| A | 0 | 19 | 0 |
| B | 0 | 19 | 0 |
| C | 0 | 19 | 0 |
| D | 0 | 19 | 0 |
| Mode M0 | |||
|---|---|---|---|
| Quadrant | BADHDUFLAG | Total packets | Discarded packets |
| A | 0 | 8399 | 0 |
| B | 0 | 8900 | 0 |
| C | 0 | 8814 | 0 |
| D | 0 | 15270 | 0 |
| Quadrant | Total seconds | Saturated seconds | Saturation percentage |
|---|---|---|---|
| A | 3936 | 9 | 0.228659% |
| B | 3936 | 60 | 1.524390% |
| C | 3936 | 51 | 1.295732% |
| D | 3936 | 82 | 2.083333% |
Noise dominated data is calculated using 1-second bins in cleaned event files. If a bin has >2000 counts, and if more than 50% of those come from <1% of pixels, then it is considered to be noise-dominated and hence unusable.
| Quadrant | # 1 sec bins | Bins with >0 counts | Bins with >2000 counts | High rate bins dominated by noise | Noise dominated (total time) | Noise dominated (detector-on time) | Marked lightcurve |
|---|---|---|---|---|---|---|---|
| A | 5820 | 3936 | 0 | 0 | 0.00% | 0.00% |  |
| B | 5820 | 3935 | 0 | 0 | 0.00% | 0.00% |  |
| C | 5820 | 3937 | 0 | 0 | 0.00% | 0.00% | 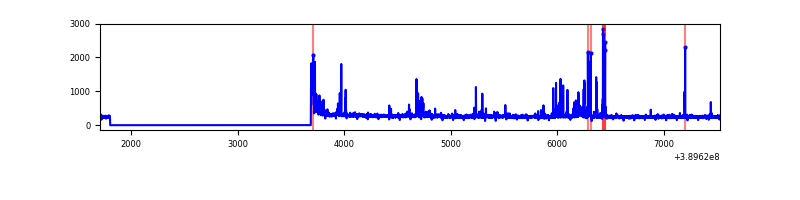 |
| D | 5820 | 3937 | 0 | 0 | 0.00% | 0.00% |  |
Top three noisy pixels from each quadrant. If the there are fewer than three noisy pixels in the level2.evt file, extra rows are filled as -1
| Pixel properties | Quadrant properties | ||||||
|---|---|---|---|---|---|---|---|
| Quadrant | DetID | PixID | Counts | Sigma | Mean | Median | Sigma |
| A | 0 | 29 | 213 | 8.61 | 65 | 62 | 17.5 |
| A | 9 | 19 | 212 | 8.56 | 65 | 62 | 17.5 |
| A | 14 | 79 | 199 | 7.81 | 65 | 62 | 17.5 |
| B | 2 | 9 | 198 | 9.66 | 62 | 60 | 14.3 |
| B | 5 | 128 | 172 | 7.84 | 62 | 60 | 14.3 |
| B | 2 | 8 | 170 | 7.7 | 62 | 60 | 14.3 |
| C | 1 | 80 | 209 | 8.34 | 63 | 60 | 17.9 |
| C | 1 | 81 | 193 | 7.44 | 63 | 60 | 17.9 |
| C | 1 | 65 | 188 | 7.16 | 63 | 60 | 17.9 |
| D | 10 | 189 | 188 | 8.01 | 58 | 54 | 16.7 |
| D | 10 | 113 | 165 | 6.64 | 58 | 54 | 16.7 |
| D | 6 | 67 | 160 | 6.34 | 58 | 54 | 16.7 |
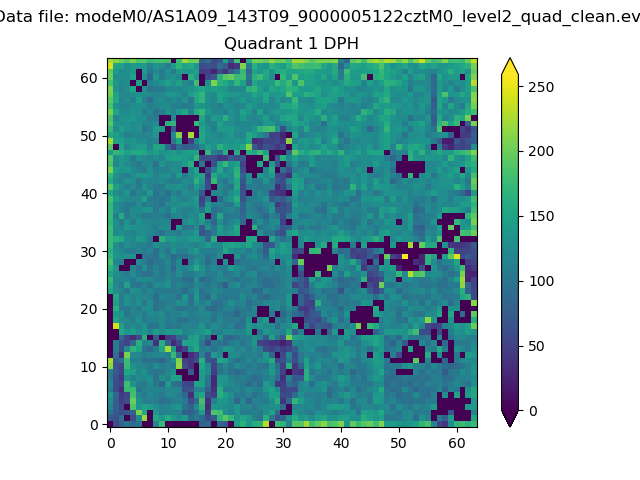
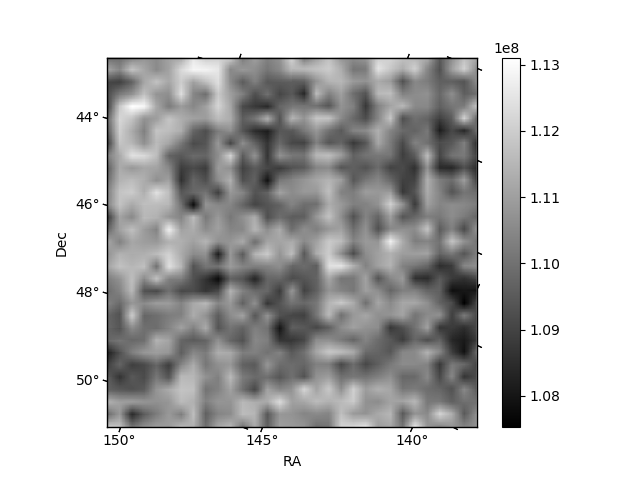
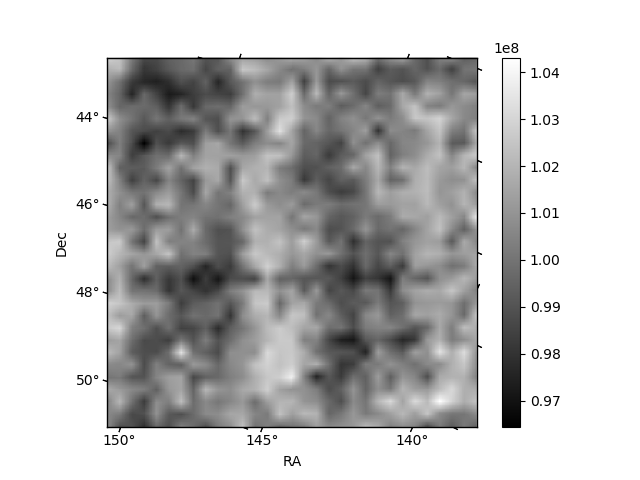
Histogram calculated using DETX and DETY for each event in the final _common_clean file
| Quadrant A |  |
 |
Quadrant B |
|---|---|---|---|
| Quadrant D |  |
 |
Quadrant C |
| Plot type | Count rate plots | Images |
|---|---|---|
| Comparison with Poisson distribution Blue bars denote a histogram of data divided into 1 sec bins. Red curve is a Poisson curve with rate = median count rate of data. |
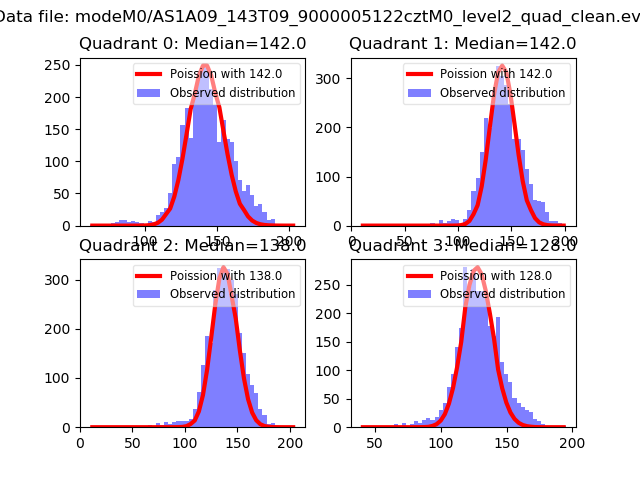 |
 |
| Quadrant-wise count rates Data is divided into 100 sec bins |
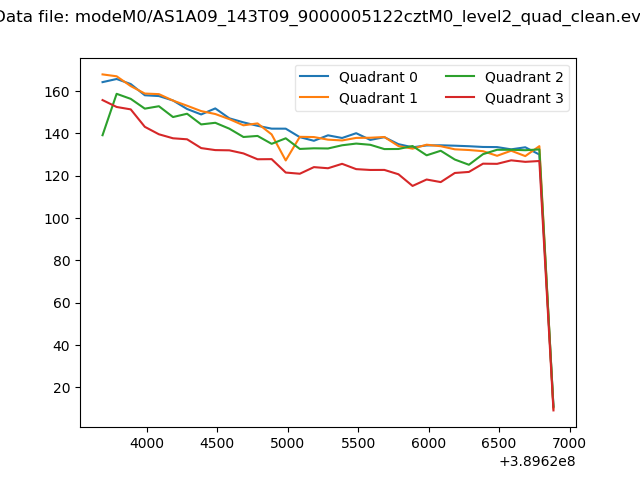 |
|
| Module-wise count rates for Quadrant A Data is divided into 100 sec bins |
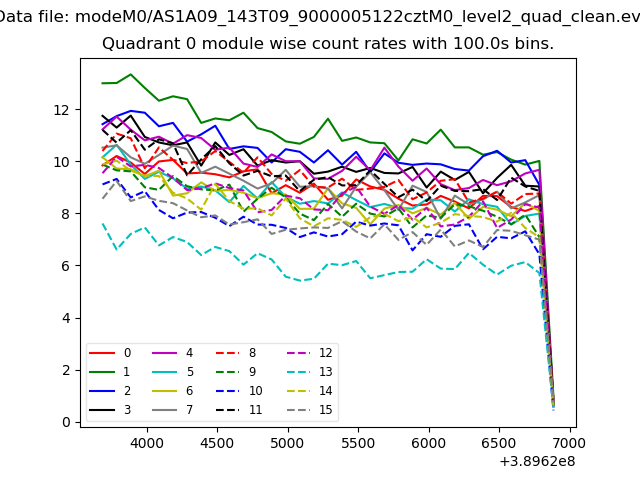 |
 |
| Module-wise count rates for Quadrant B Data is divided into 100 sec bins |
 |
 |
| Module-wise count rates for Quadrant C Data is divided into 100 sec bins |
 |
 |
| Module-wise count rates for Quadrant D Data is divided into 100 sec bins |
 |
 |
| Parameter | Plot |
|---|---|
| CZT HV Monitor | 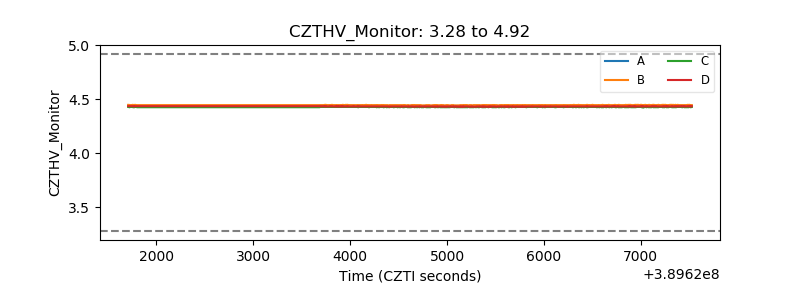 |
| D_VDD | 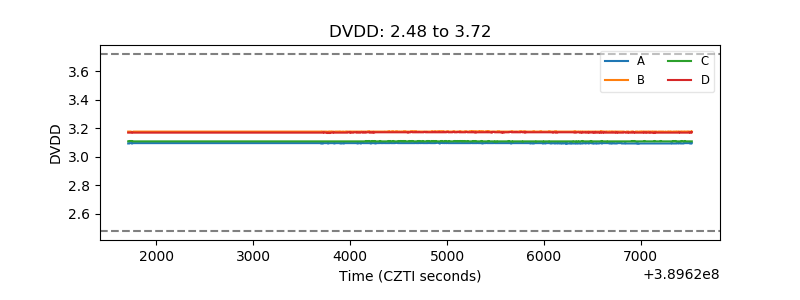 |
| Temperature 1 |  |
| Veto HV Monitor |  |
| Veto LLD |  |
| Alpha Counter | 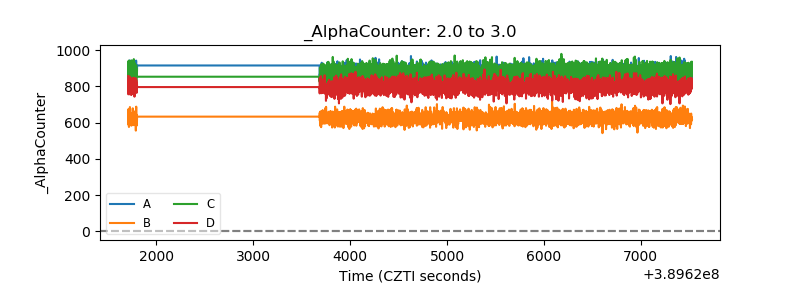 |
| _CPM_Rate |  |
| CZT Counter | 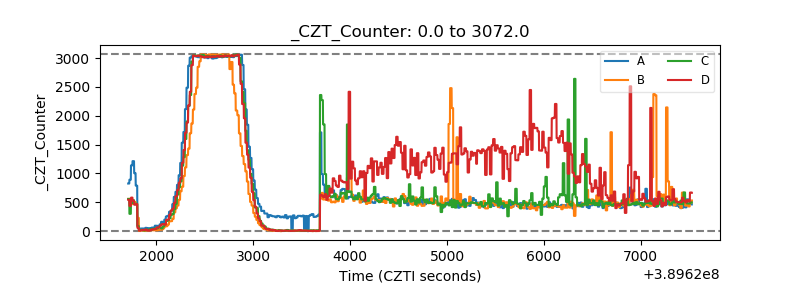 |
| +2.5 Volts monitor |  |
| +5 Volts monitor |  |
| _ROLL_ROT |  |
| _Roll_DEC |  |
| _Roll_RA | 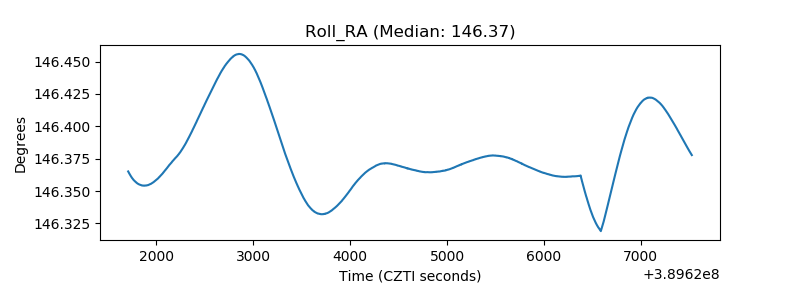 |
| Veto Counter |  |