| Param | Original file | Final file |
|---|---|---|
| Filename | modeM0/AS1A09_029T06_9000005126cztM0_level2.fits | modeM0/AS1A09_029T06_9000005126cztM0_level2_quad_clean.evt |
| Size (bytes) | 265,884,480 | 266,434,560 |
| Size | 253.6 MB | 254.1 MB |
| Events in quadrant A | 1,629,578 | 1,611,077 |
| Events in quadrant B | 1,574,958 | 1,647,899 |
| Events in quadrant C | 1,577,702 | 1,557,284 |
| Events in quadrant D | 1,350,850 | 1,334,198 |
| Mode M0 | |||
|---|---|---|---|
| Quadrant | BADHDUFLAG | Total packets | Discarded packets |
| A | 0 | 70185 | 0 |
| B | 0 | 63256 | 0 |
| C | 0 | 62909 | 0 |
| D | 0 | 90604 | 0 |
| Mode SS | |||
|---|---|---|---|
| Quadrant | BADHDUFLAG | Total packets | Discarded packets |
| A | 0 | 574 | 0 |
| B | 0 | 574 | 0 |
| C | 0 | 574 | 0 |
| D | 0 | 574 | 0 |
| Mode M9 | |||
|---|---|---|---|
| Quadrant | BADHDUFLAG | Total packets | Discarded packets |
| A | 0 | 126 | 0 |
| B | 0 | 126 | 0 |
| C | 0 | 126 | 0 |
| D | 0 | 126 | 0 |
| Quadrant | Total seconds | Saturated seconds | Saturation percentage |
|---|---|---|---|
| A | 27886 | 1387 | 4.973822% |
| B | 27886 | 511 | 1.832461% |
| C | 27886 | 456 | 1.635229% |
| D | 27886 | 2151 | 7.713548% |
Noise dominated data is calculated using 1-second bins in cleaned event files. If a bin has >2000 counts, and if more than 50% of those come from <1% of pixels, then it is considered to be noise-dominated and hence unusable.
| Quadrant | # 1 sec bins | Bins with >0 counts | Bins with >2000 counts | High rate bins dominated by noise | Noise dominated (total time) | Noise dominated (detector-on time) | Marked lightcurve |
|---|---|---|---|---|---|---|---|
| A | 40527 | 27860 | 0 | 0 | 0.00% | 0.00% |  |
| B | 40527 | 27883 | 0 | 0 | 0.00% | 0.00% |  |
| C | 40527 | 27885 | 0 | 0 | 0.00% | 0.00% |  |
| D | 40527 | 27885 | 0 | 0 | 0.00% | 0.00% |  |
Top three noisy pixels from each quadrant. If the there are fewer than three noisy pixels in the level2.evt file, extra rows are filled as -1
| Pixel properties | Quadrant properties | ||||||
|---|---|---|---|---|---|---|---|
| Quadrant | DetID | PixID | Counts | Sigma | Mean | Median | Sigma |
| A | 7 | 110 | 1366 | 9.05 | 425 | 402 | 106.5 |
| A | 14 | 95 | 1293 | 8.37 | 425 | 402 | 106.5 |
| A | 9 | 19 | 1279 | 8.23 | 425 | 402 | 106.5 |
| B | 2 | 9 | 1361 | 11.68 | 417 | 399 | 82.4 |
| B | 3 | 80 | 1166 | 9.31 | 417 | 399 | 82.4 |
| B | 2 | 8 | 1106 | 8.58 | 417 | 399 | 82.4 |
| C | 3 | 203 | 1283 | 8.21 | 417 | 392 | 108.5 |
| C | 3 | 202 | 1268 | 8.08 | 417 | 392 | 108.5 |
| C | 1 | 80 | 1226 | 7.69 | 417 | 392 | 108.5 |
| D | 6 | 67 | 1018 | 6.44 | 386 | 353 | 103.3 |
| D | 6 | 62 | 993 | 6.2 | 386 | 353 | 103.3 |
| D | 7 | 3 | 986 | 6.13 | 386 | 353 | 103.3 |
Histogram calculated using DETX and DETY for each event in the final _common_clean file
| Quadrant A | 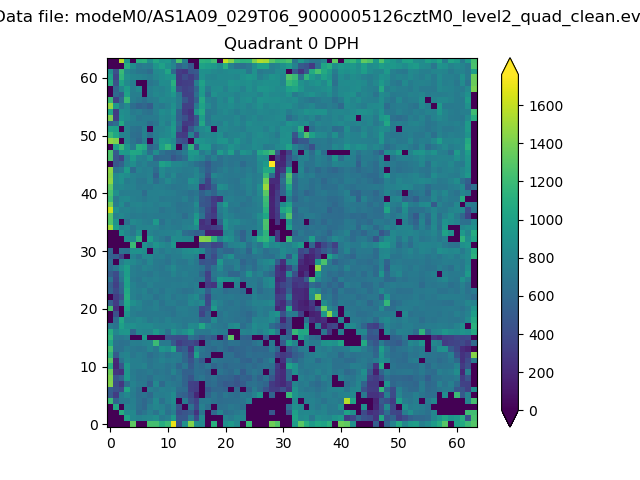 |
 |
Quadrant B |
|---|---|---|---|
| Quadrant D |  |
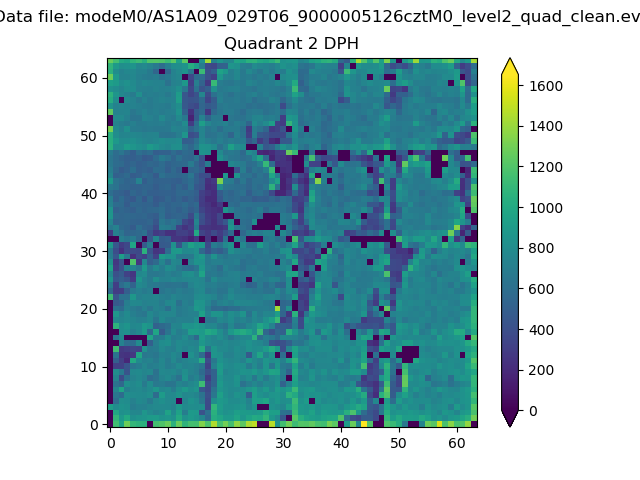 |
Quadrant C |
| Plot type | Count rate plots | Images |
|---|---|---|
| Comparison with Poisson distribution Blue bars denote a histogram of data divided into 1 sec bins. Red curve is a Poisson curve with rate = median count rate of data. |
 |
 |
| Quadrant-wise count rates Data is divided into 100 sec bins |
 |
|
| Module-wise count rates for Quadrant A Data is divided into 100 sec bins |
 |
 |
| Module-wise count rates for Quadrant B Data is divided into 100 sec bins |
 |
 |
| Module-wise count rates for Quadrant C Data is divided into 100 sec bins |
 |
 |
| Module-wise count rates for Quadrant D Data is divided into 100 sec bins |
 |
 |
| Parameter | Plot |
|---|---|
| CZT HV Monitor |  |
| D_VDD | 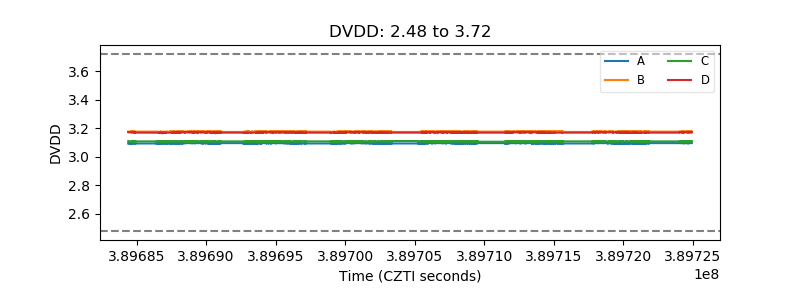 |
| Temperature 1 |  |
| Veto HV Monitor |  |
| Veto LLD |  |
| Alpha Counter |  |
| _CPM_Rate |  |
| CZT Counter |  |
| +2.5 Volts monitor |  |
| +5 Volts monitor |  |
| _ROLL_ROT |  |
| _Roll_DEC | 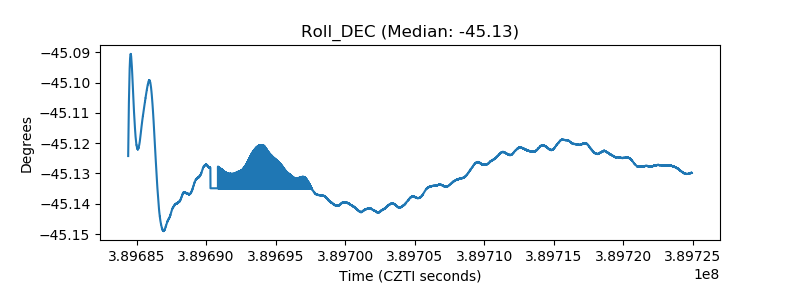 |
| _Roll_RA |  |
| Veto Counter |  |