| Param | Original file | Final file |
|---|---|---|
| Filename | modeM0/AS1A09_029T06_9000005126_35734cztM0_level2.evt | modeM0/AS1A09_029T06_9000005126_35734cztM0_level2_quad_clean.evt |
| Size (bytes) | 446,160,960 | 88,597,440 |
| Size | 425.5 MB | 84.5 MB |
| Events in quadrant A | 3,728,829 | 556,758 |
| Events in quadrant B | 3,077,073 | 590,685 |
| Events in quadrant C | 3,235,188 | 580,430 |
| Events in quadrant D | 3,082,087 | 555,015 |
| Mode M0 | |||
|---|---|---|---|
| Quadrant | BADHDUFLAG | Total packets | Discarded packets |
| A | 0 | 14780 | 3 |
| B | 0 | 12907 | 2 |
| C | 0 | 12999 | 2 |
| D | 0 | 12866 | 2 |
| Mode SS | |||
|---|---|---|---|
| Quadrant | BADHDUFLAG | Total packets | Discarded packets |
| A | 0 | 116 | 0 |
| B | 0 | 116 | 0 |
| C | 0 | 116 | 0 |
| D | 0 | 116 | 0 |
| Mode M9 | |||
|---|---|---|---|
| Quadrant | BADHDUFLAG | Total packets | Discarded packets |
| A | 0 | 27 | 0 |
| B | 0 | 27 | 0 |
| C | 0 | 27 | 0 |
| D | 0 | 28 | 0 |
| Quadrant | Total seconds | Saturated seconds | Saturation percentage |
|---|---|---|---|
| A | 5722 | 445 | 7.777001% |
| B | 5722 | 81 | 1.415589% |
| C | 5722 | 139 | 2.429221% |
| D | 5722 | 35 | 0.611674% |
Noise dominated data is calculated using 1-second bins in cleaned event files. If a bin has >2000 counts, and if more than 50% of those come from <1% of pixels, then it is considered to be noise-dominated and hence unusable.
| Quadrant | # 1 sec bins | Bins with >0 counts | Bins with >2000 counts | High rate bins dominated by noise | Noise dominated (total time) | Noise dominated (detector-on time) | Marked lightcurve |
|---|---|---|---|---|---|---|---|
| A | 7274 | 5723 | 373 | 373 | 5.13% | 6.52% | 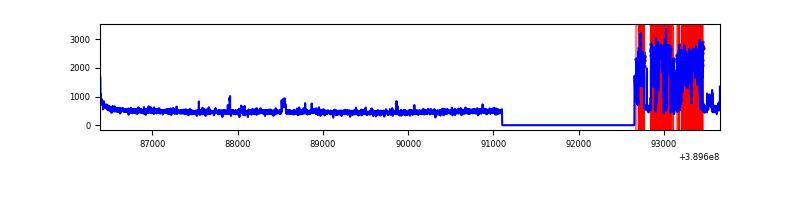 |
| B | 7274 | 5723 | 53 | 53 | 0.73% | 0.93% | 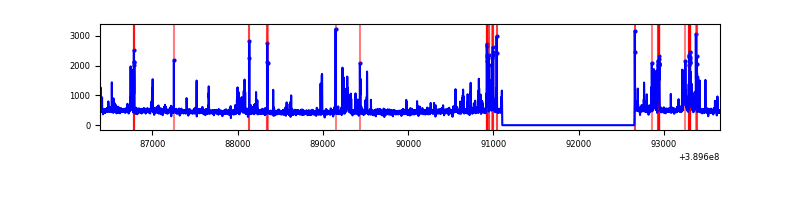 |
| C | 7274 | 5723 | 114 | 114 | 1.57% | 1.99% | 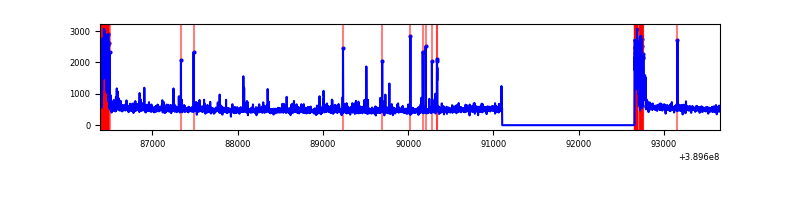 |
| D | 7274 | 5723 | 36 | 36 | 0.49% | 0.63% | 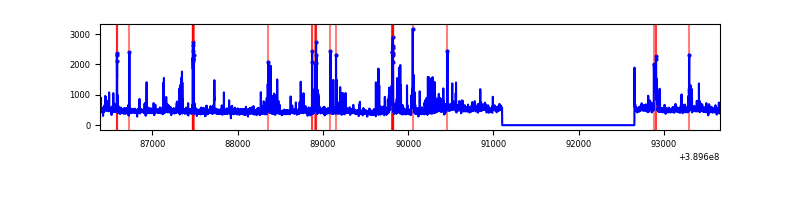 |
Top three noisy pixels from each quadrant. If the there are fewer than three noisy pixels in the level2.evt file, extra rows are filled as -1
| Pixel properties | Quadrant properties | ||||||
|---|---|---|---|---|---|---|---|
| Quadrant | DetID | PixID | Counts | Sigma | Mean | Median | Sigma |
| A | 15 | 169 | 1078199 | 8294.61 | 640 | 627 | 129.9 |
| A | 10 | 83 | 144460 | 1107.15 | 640 | 627 | 129.9 |
| A | 13 | 6 | 23950 | 179.53 | 640 | 627 | 129.9 |
| B | 5 | 172 | 369775 | 2892.44 | 655 | 637 | 127.6 |
| B | 5 | 255 | 76596 | 595.19 | 655 | 637 | 127.6 |
| B | 4 | 81 | 22597 | 172.07 | 655 | 637 | 127.6 |
| C | 0 | 10 | 444292 | 2969.09 | 638 | 641 | 149.4 |
| C | 15 | 214 | 240413 | 1604.65 | 638 | 641 | 149.4 |
| C | 0 | 207 | 43952 | 289.85 | 638 | 641 | 149.4 |
| D | 14 | 52 | 222846 | 1399.16 | 646 | 626 | 158.8 |
| D | 13 | 249 | 126594 | 793.13 | 646 | 626 | 158.8 |
| D | 8 | 195 | 32822 | 202.72 | 646 | 626 | 158.8 |
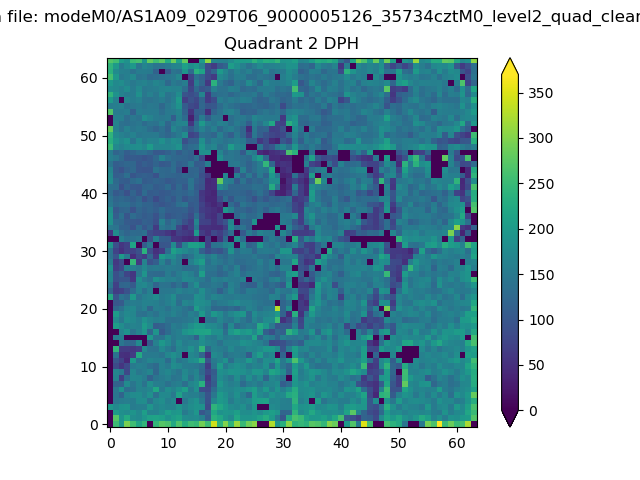
Histogram calculated using DETX and DETY for each event in the final _common_clean file
| Quadrant A | 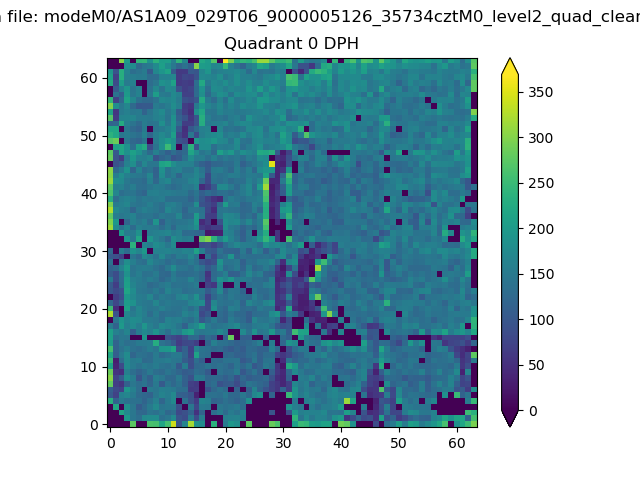 |
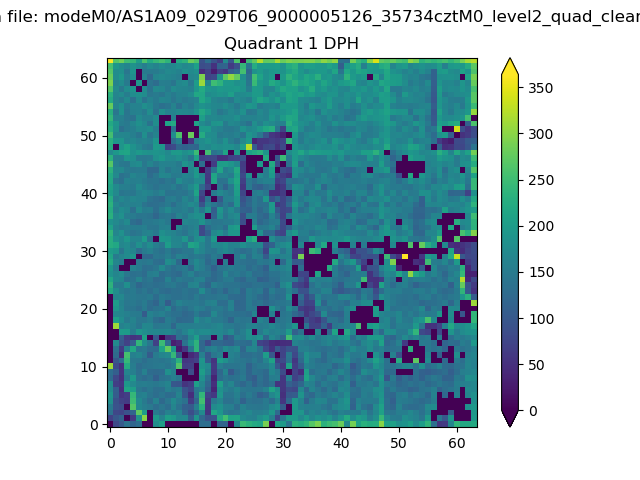 |
Quadrant B |
|---|---|---|---|
| Quadrant D | 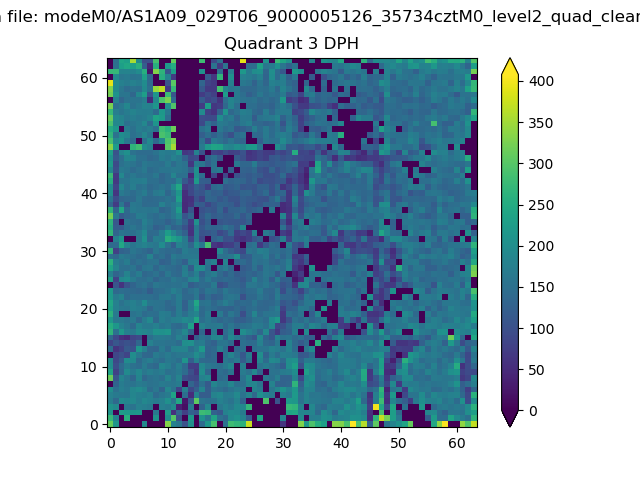 |
 |
Quadrant C |
| Plot type | Count rate plots | Images |
|---|---|---|
| Comparison with Poisson distribution Blue bars denote a histogram of data divided into 1 sec bins. Red curve is a Poisson curve with rate = median count rate of data. |
 |
 |
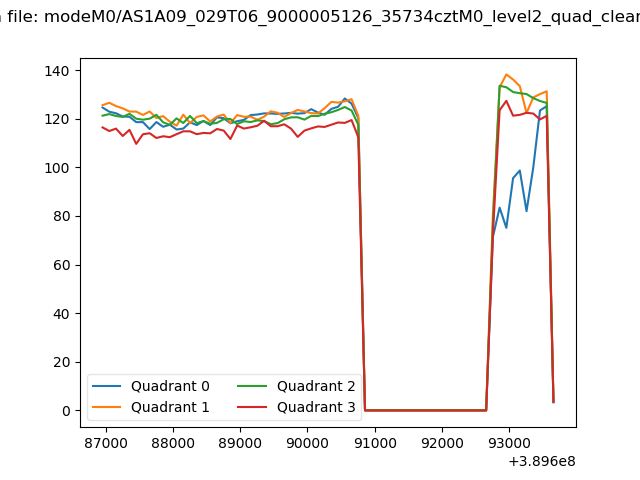
| Quadrant-wise count rates Data is divided into 100 sec bins |
 |
|
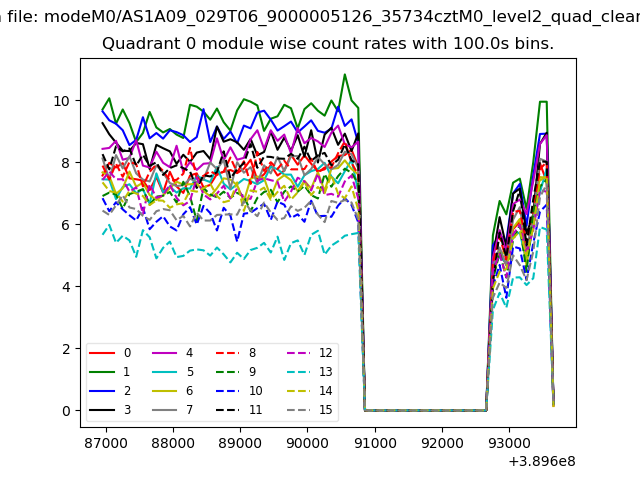
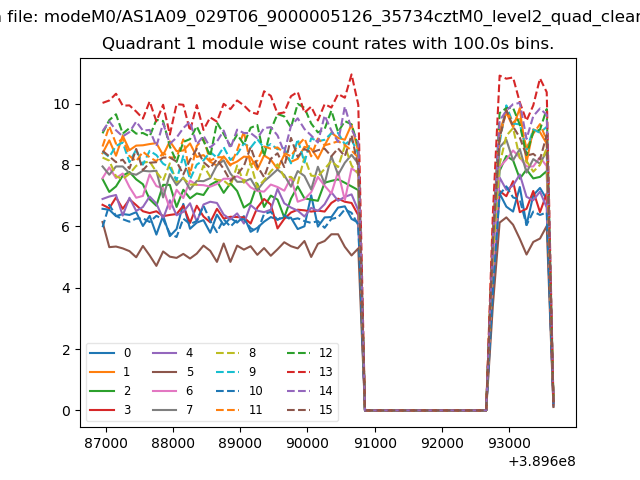
| Module-wise count rates for Quadrant A Data is divided into 100 sec bins |
 |
 |
| Module-wise count rates for Quadrant B Data is divided into 100 sec bins |
 |
 |
| Module-wise count rates for Quadrant C Data is divided into 100 sec bins |
 |
 |
| Module-wise count rates for Quadrant D Data is divided into 100 sec bins |
 |
 |
| Parameter | Plot |
|---|---|
| CZT HV Monitor |  |
| D_VDD | 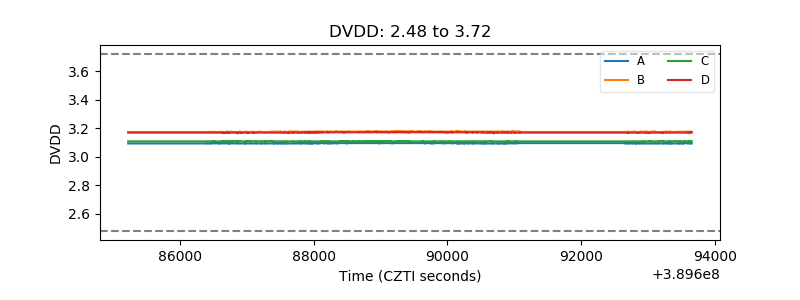 |
| Temperature 1 | 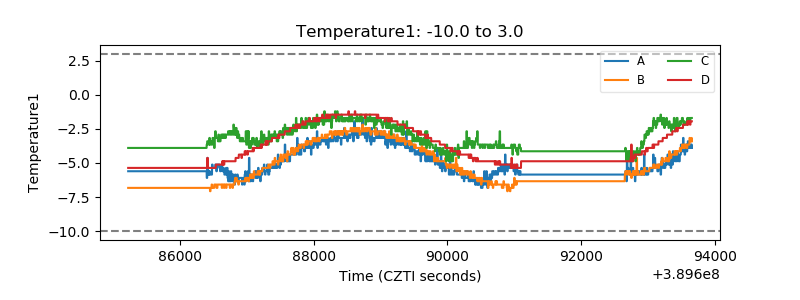 |
| Veto HV Monitor | 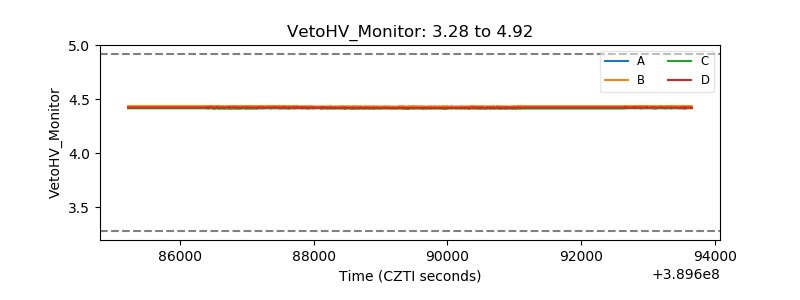 |
| Veto LLD | 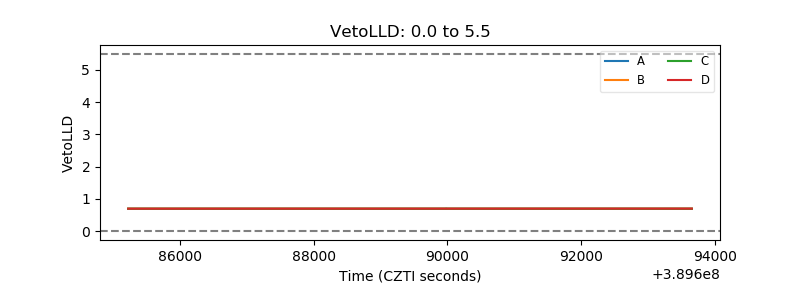 |
| Alpha Counter | 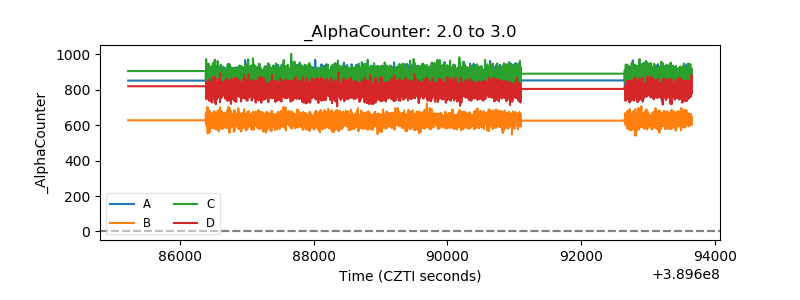 |
| _CPM_Rate | 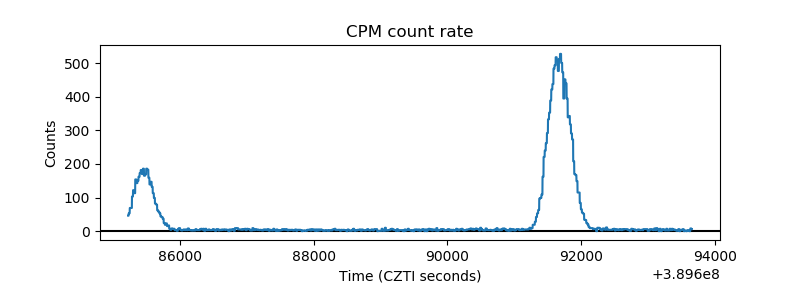 |
| CZT Counter | 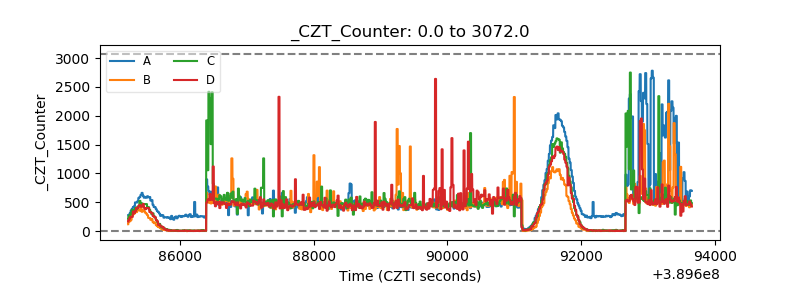 |
| +2.5 Volts monitor |  |
| +5 Volts monitor |  |
| _ROLL_ROT | 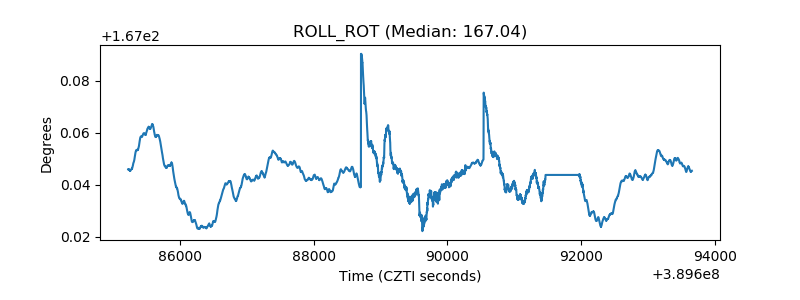 |
| _Roll_DEC | 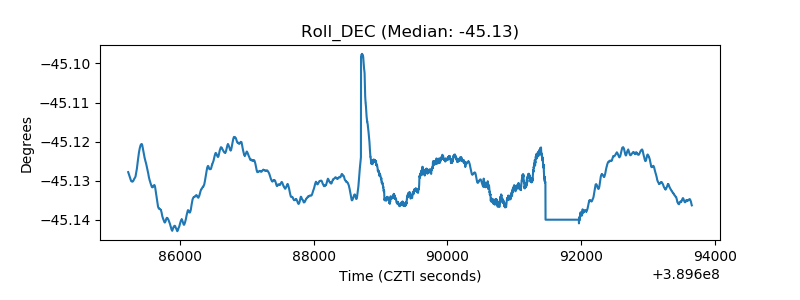 |
| _Roll_RA | 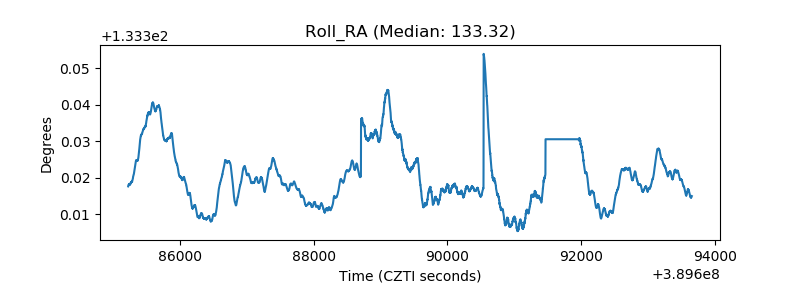 |
| Veto Counter | 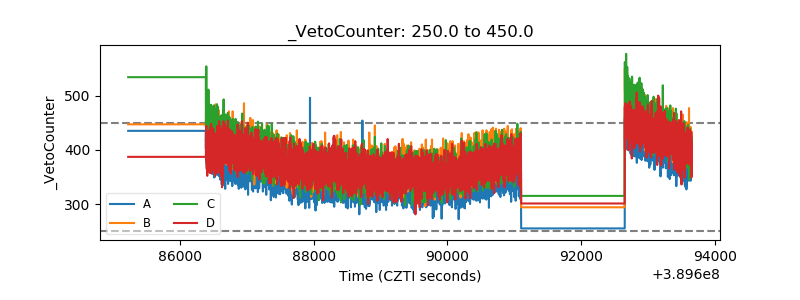 |