| Param | Original file | Final file |
|---|---|---|
| Filename | modeM0/AS1A09_029T06_9000005126_35741cztM0_level2.evt | modeM0/AS1A09_029T06_9000005126_35741cztM0_level2_quad_clean.evt |
| Size (bytes) | 74,566,080 | 19,198,080 |
| Size | 71.1 MB | 18.3 MB |
| Events in quadrant A | 507,327 | 132,160 |
| Events in quadrant B | 482,289 | 133,578 |
| Events in quadrant C | 593,328 | 122,004 |
| Events in quadrant D | 609,387 | 121,480 |
| Mode M0 | |||
|---|---|---|---|
| Quadrant | BADHDUFLAG | Total packets | Discarded packets |
| A | 0 | 2047 | 1 |
| B | 0 | 1957 | 1 |
| C | 0 | 2277 | 1 |
| D | 0 | 2375 | 1 |
| Mode SS | |||
|---|---|---|---|
| Quadrant | BADHDUFLAG | Total packets | Discarded packets |
| A | 0 | 20 | 0 |
| B | 0 | 20 | 0 |
| C | 0 | 20 | 0 |
| D | 0 | 20 | 0 |
| Mode M9 | |||
|---|---|---|---|
| Quadrant | BADHDUFLAG | Total packets | Discarded packets |
| A | 0 | 6 | 0 |
| B | 0 | 6 | 0 |
| C | 0 | 6 | 0 |
| D | 0 | 7 | 0 |
| Quadrant | Total seconds | Saturated seconds | Saturation percentage |
|---|---|---|---|
| A | 916 | 4 | 0.436681% |
| B | 916 | 6 | 0.655022% |
| C | 916 | 57 | 6.222707% |
| D | 916 | 22 | 2.401747% |
Noise dominated data is calculated using 1-second bins in cleaned event files. If a bin has >2000 counts, and if more than 50% of those come from <1% of pixels, then it is considered to be noise-dominated and hence unusable.
| Quadrant | # 1 sec bins | Bins with >0 counts | Bins with >2000 counts | High rate bins dominated by noise | Noise dominated (total time) | Noise dominated (detector-on time) | Marked lightcurve |
|---|---|---|---|---|---|---|---|
| A | 916 | 916 | 0 | 0 | 0.00% | 0.00% | 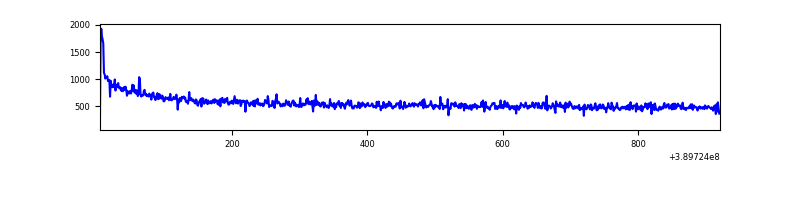 |
| B | 916 | 916 | 3 | 3 | 0.33% | 0.33% | 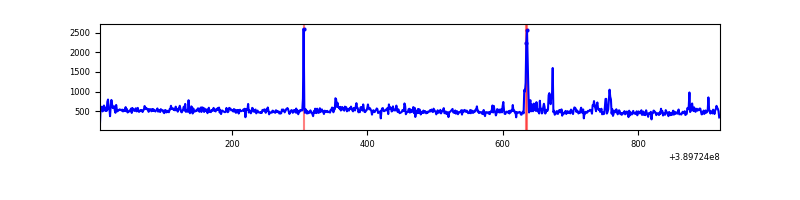 |
| C | 916 | 916 | 54 | 54 | 5.90% | 5.90% | 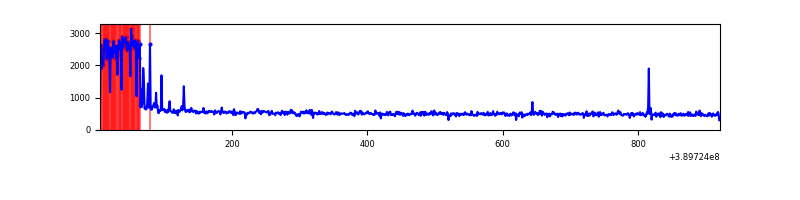 |
| D | 916 | 916 | 20 | 20 | 2.18% | 2.18% | 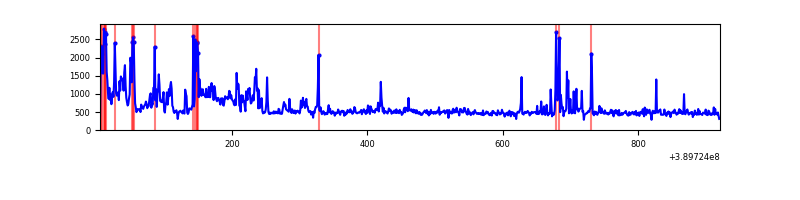 |
Top three noisy pixels from each quadrant. If the there are fewer than three noisy pixels in the level2.evt file, extra rows are filled as -1
| Pixel properties | Quadrant properties | ||||||
|---|---|---|---|---|---|---|---|
| Quadrant | DetID | PixID | Counts | Sigma | Mean | Median | Sigma |
| A | 10 | 83 | 56292 | 2238.02 | 114 | 112 | 25.1 |
| A | 13 | 6 | 3161 | 121.46 | 114 | 112 | 25.1 |
| A | 10 | 67 | 2220 | 83.98 | 114 | 112 | 25.1 |
| B | 5 | 255 | 17587 | 753.51 | 111 | 109 | 23.2 |
| B | 0 | 189 | 15044 | 643.88 | 111 | 109 | 23.2 |
| B | 15 | 85 | 5250 | 221.64 | 111 | 109 | 23.2 |
| C | 0 | 10 | 147712 | 5861.23 | 101 | 101 | 25.2 |
| C | 15 | 214 | 41545 | 1645.63 | 101 | 101 | 25.2 |
| C | 9 | 187 | 4068 | 157.52 | 101 | 101 | 25.2 |
| D | 14 | 52 | 115801 | 4204.9 | 106 | 104 | 27.5 |
| D | 10 | 199 | 18818 | 680.14 | 106 | 104 | 27.5 |
| D | 13 | 249 | 14753 | 532.4 | 106 | 104 | 27.5 |
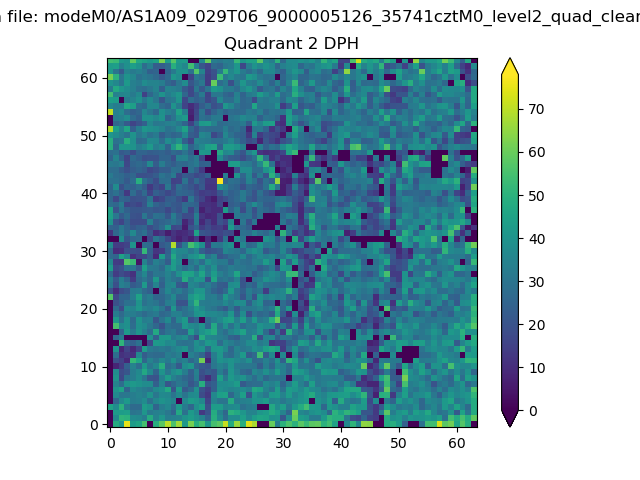
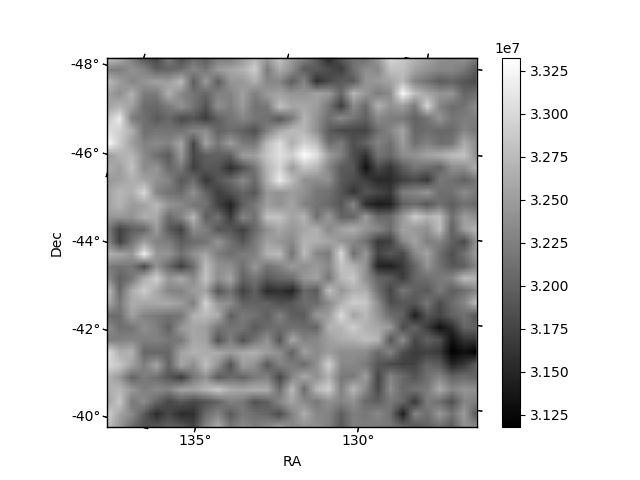
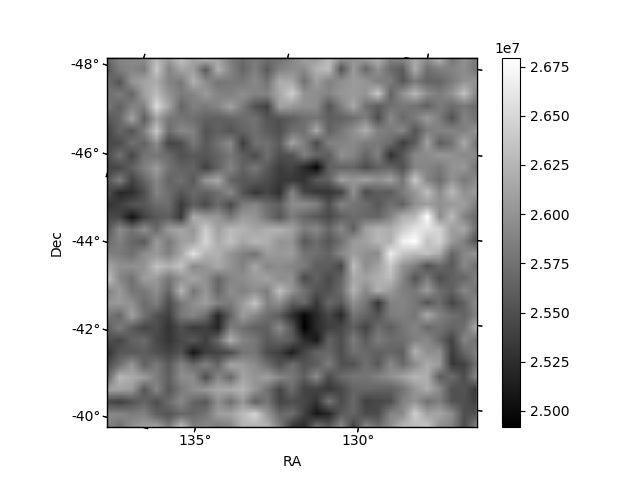
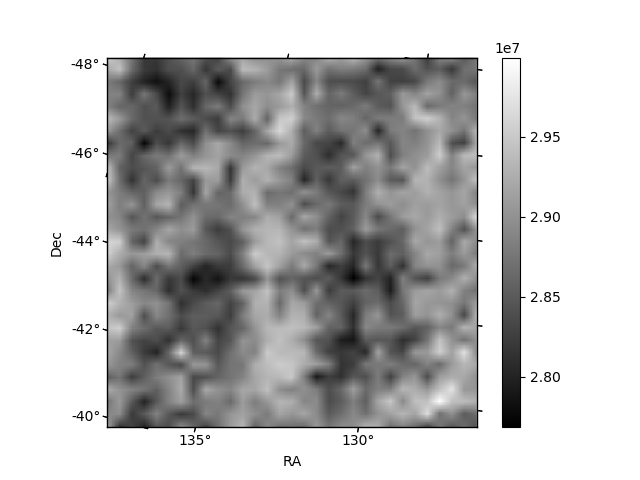
Histogram calculated using DETX and DETY for each event in the final _common_clean file
| Quadrant A | 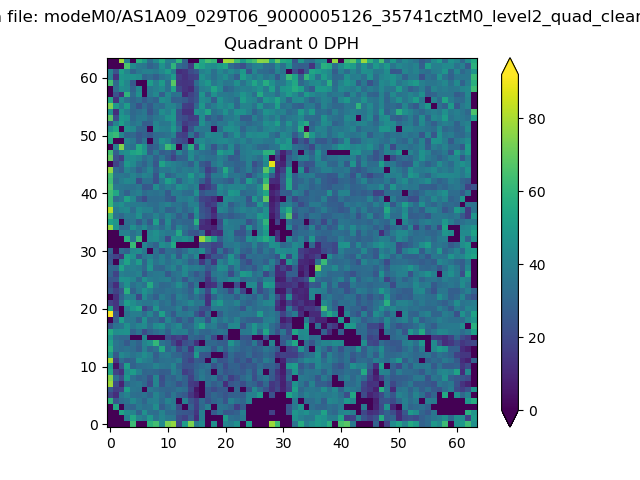 |
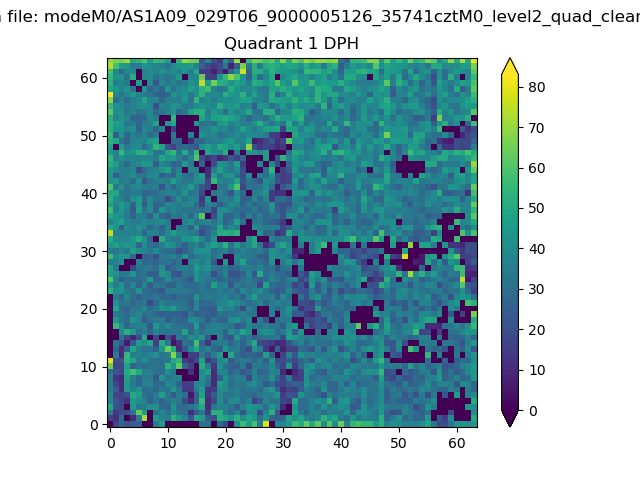 |
Quadrant B |
|---|---|---|---|
| Quadrant D | 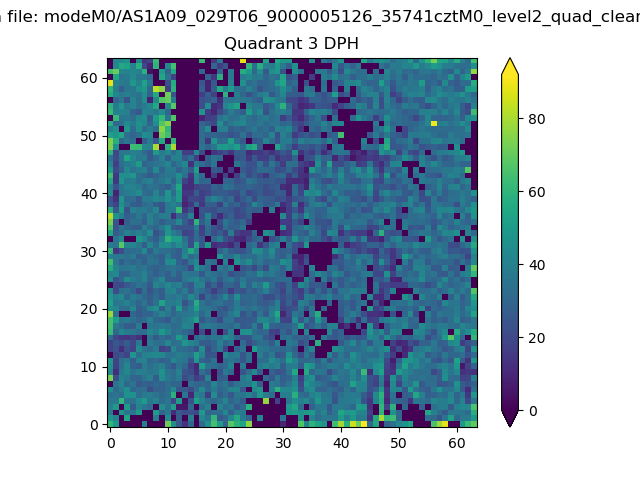 |
 |
Quadrant C |
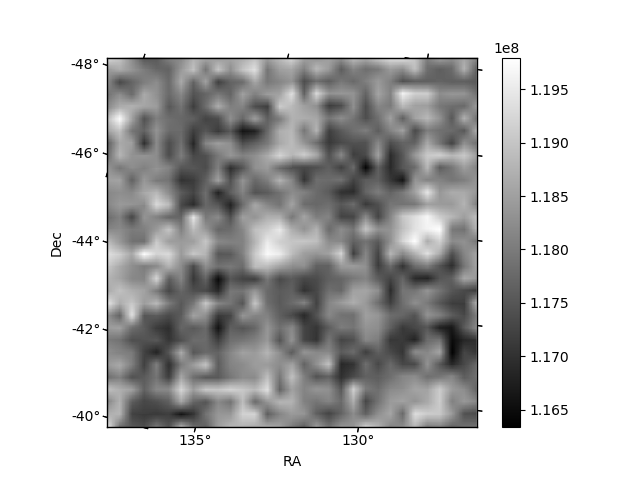
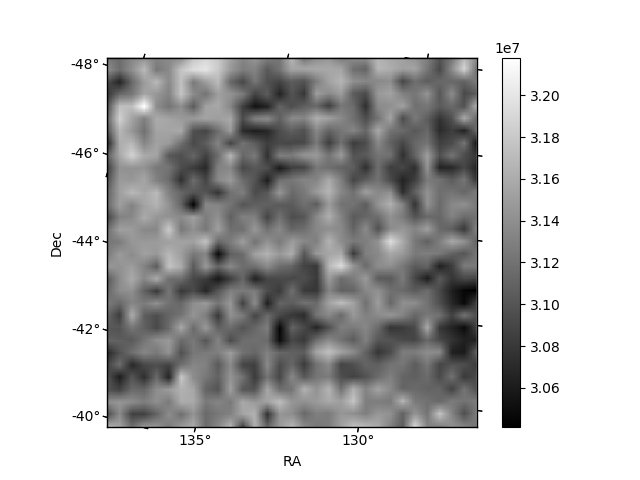
| Plot type | Count rate plots | Images |
|---|---|---|
| Comparison with Poisson distribution Blue bars denote a histogram of data divided into 1 sec bins. Red curve is a Poisson curve with rate = median count rate of data. |
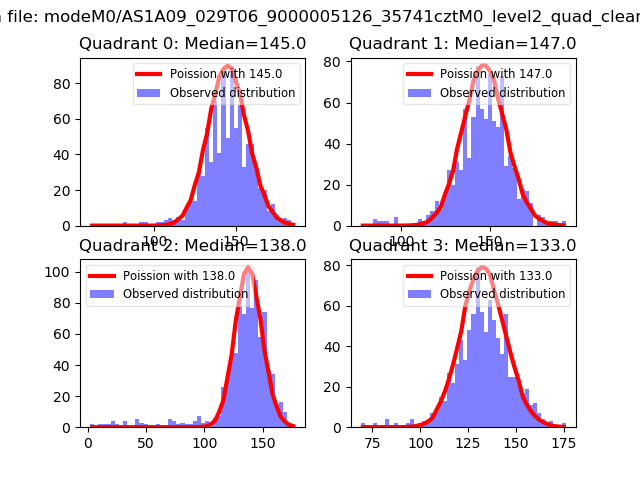 |
 |
| Quadrant-wise count rates Data is divided into 100 sec bins |
 |
|
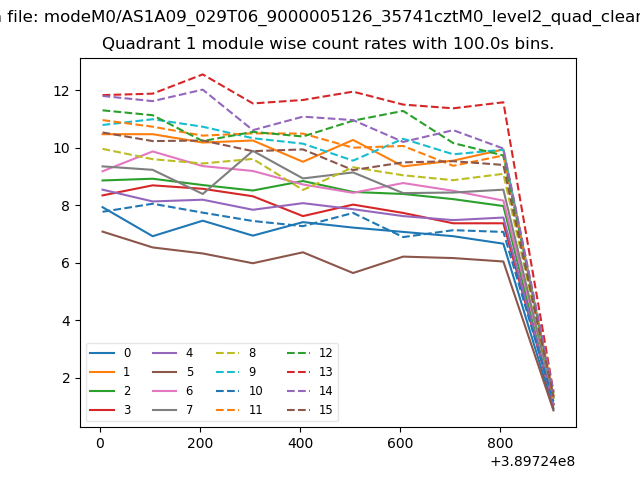
| Module-wise count rates for Quadrant A Data is divided into 100 sec bins |
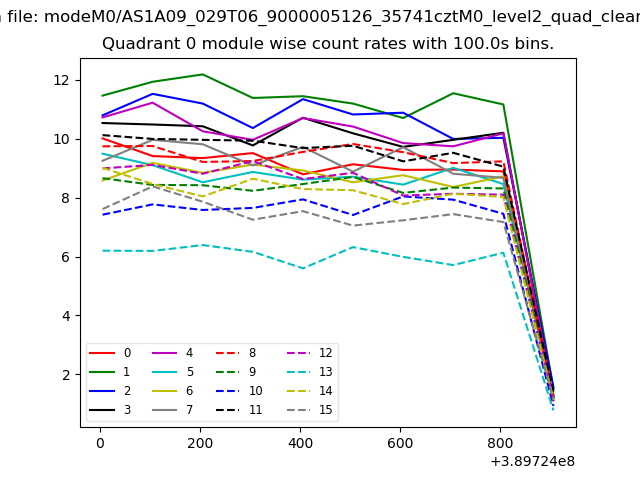 |
 |
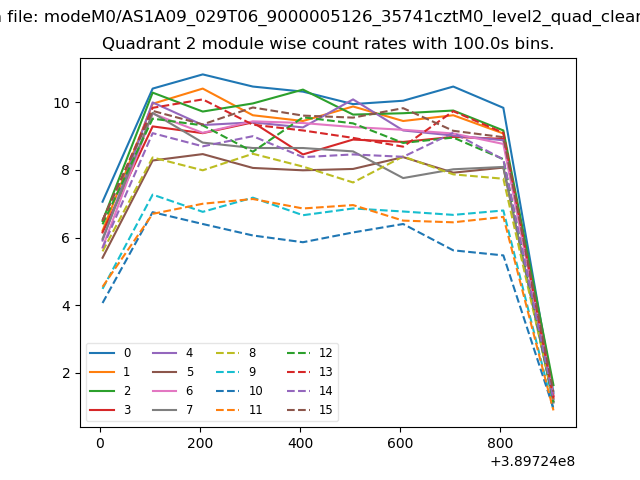
| Module-wise count rates for Quadrant B Data is divided into 100 sec bins |
 |
 |
| Module-wise count rates for Quadrant C Data is divided into 100 sec bins |
 |
 |
| Module-wise count rates for Quadrant D Data is divided into 100 sec bins |
 |
 |
| Parameter | Plot |
|---|---|
| CZT HV Monitor | 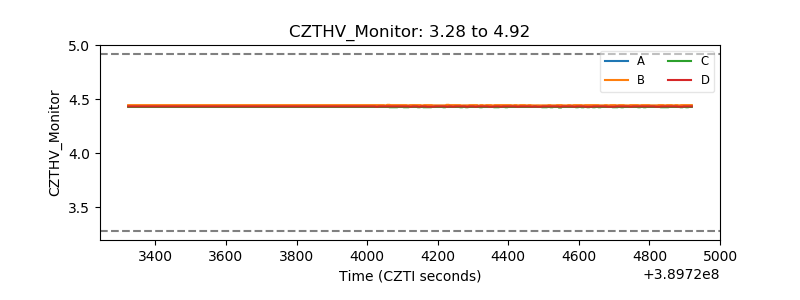 |
| D_VDD | 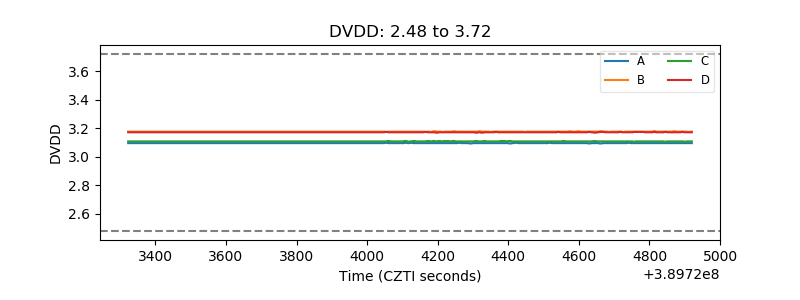 |
| Temperature 1 | 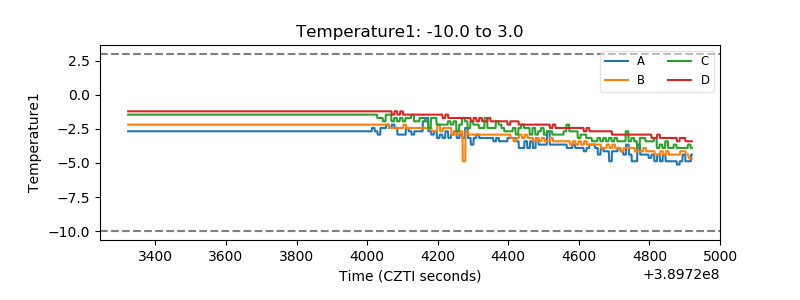 |
| Veto HV Monitor | 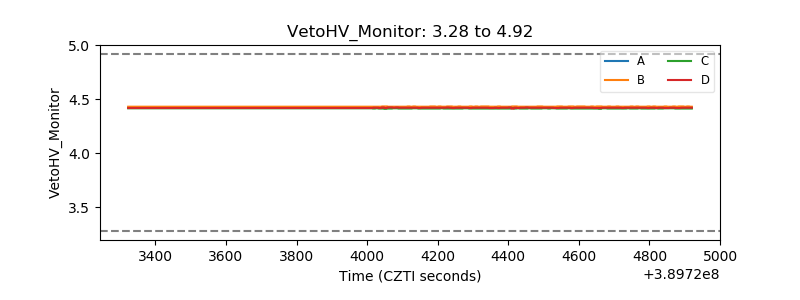 |
| Veto LLD | 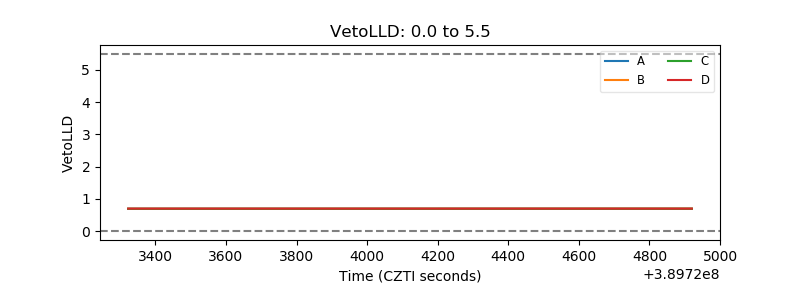 |
| Alpha Counter |  |
| _CPM_Rate | 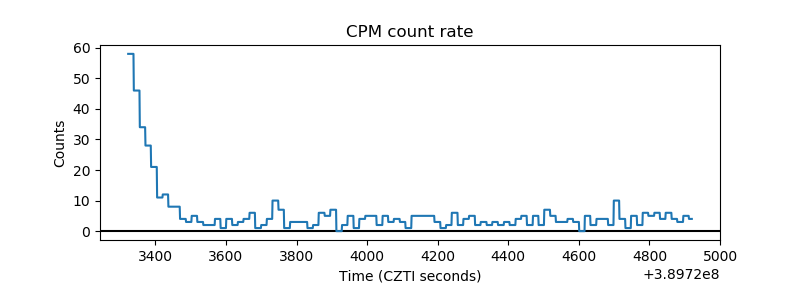 |
| CZT Counter | 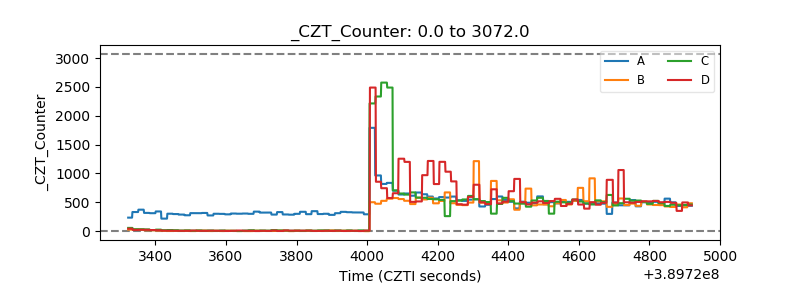 |
| +2.5 Volts monitor |  |
| +5 Volts monitor |  |
| _ROLL_ROT | 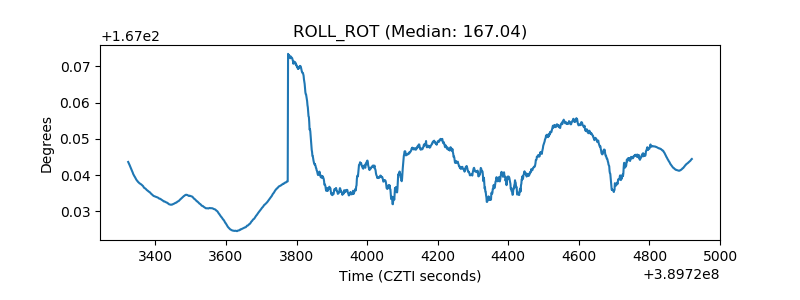 |
| _Roll_DEC | 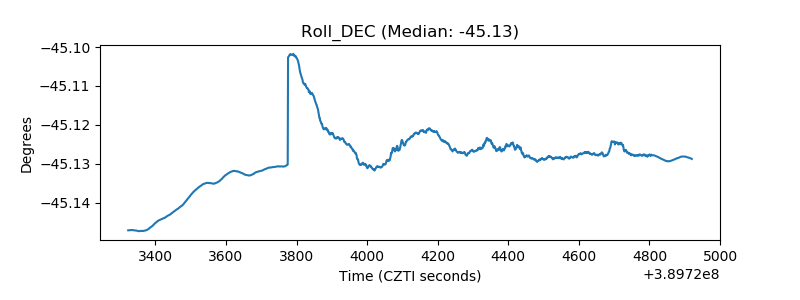 |
| _Roll_RA | 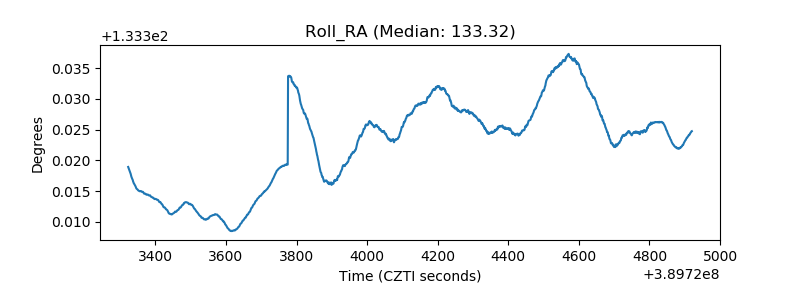 |
| Veto Counter | 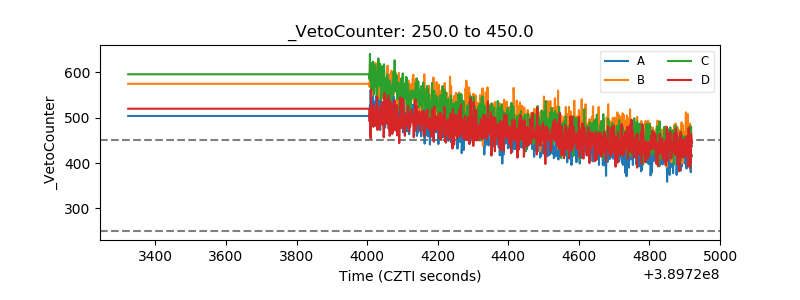 |