| Param | Original file | Final file |
|---|---|---|
| Filename | modeM0/AS1A09_029T07_9000005128_35751cztM0_level2.evt | modeM0/AS1A09_029T07_9000005128_35751cztM0_level2_quad_clean.evt |
| Size (bytes) | 320,639,040 | 57,579,840 |
| Size | 305.8 MB | 54.9 MB |
| Events in quadrant A | 1,547,462 | 395,749 |
| Events in quadrant B | 1,689,224 | 397,777 |
| Events in quadrant C | 1,665,912 | 390,048 |
| Events in quadrant D | 4,593,185 | 335,709 |
| Mode M0 | |||
|---|---|---|---|
| Quadrant | BADHDUFLAG | Total packets | Discarded packets |
| A | 0 | 6579 | 1 |
| B | 0 | 7073 | 1 |
| C | 0 | 6907 | 1 |
| D | 0 | 15816 | 1 |
| Mode SS | |||
|---|---|---|---|
| Quadrant | BADHDUFLAG | Total packets | Discarded packets |
| A | 0 | 64 | 0 |
| B | 0 | 64 | 0 |
| C | 0 | 64 | 0 |
| D | 0 | 64 | 0 |
| Quadrant | Total seconds | Saturated seconds | Saturation percentage |
|---|---|---|---|
| A | 3144 | 8 | 0.254453% |
| B | 3144 | 20 | 0.636132% |
| C | 3144 | 21 | 0.667939% |
| D | 3145 | 727 | 23.116057% |
Noise dominated data is calculated using 1-second bins in cleaned event files. If a bin has >2000 counts, and if more than 50% of those come from <1% of pixels, then it is considered to be noise-dominated and hence unusable.
| Quadrant | # 1 sec bins | Bins with >0 counts | Bins with >2000 counts | High rate bins dominated by noise | Noise dominated (total time) | Noise dominated (detector-on time) | Marked lightcurve |
|---|---|---|---|---|---|---|---|
| A | 3144 | 3144 | 0 | 0 | 0.00% | 0.00% |  |
| B | 3144 | 3144 | 18 | 18 | 0.57% | 0.57% |  |
| C | 3144 | 3144 | 14 | 14 | 0.45% | 0.45% |  |
| D | 3145 | 3145 | 753 | 753 | 23.94% | 23.94% |  |
Top three noisy pixels from each quadrant. If the there are fewer than three noisy pixels in the level2.evt file, extra rows are filled as -1
| Pixel properties | Quadrant properties | ||||||
|---|---|---|---|---|---|---|---|
| Quadrant | DetID | PixID | Counts | Sigma | Mean | Median | Sigma |
| A | 10 | 83 | 84017 | 1119.11 | 369 | 362 | 74.8 |
| A | 8 | 192 | 12721 | 165.33 | 369 | 362 | 74.8 |
| A | 13 | 6 | 12201 | 158.38 | 369 | 362 | 74.8 |
| B | 5 | 255 | 128861 | 1811.69 | 360 | 351 | 70.9 |
| B | 5 | 172 | 69464 | 974.33 | 360 | 351 | 70.9 |
| B | 4 | 232 | 41014 | 573.25 | 360 | 351 | 70.9 |
| C | 15 | 214 | 134803 | 1608.16 | 353 | 355 | 83.6 |
| C | 0 | 10 | 66412 | 790.12 | 353 | 355 | 83.6 |
| C | 2 | 16 | 34001 | 402.45 | 353 | 355 | 83.6 |
| D | 14 | 52 | 2727250 | 32430.39 | 336 | 326 | 84.1 |
| D | 14 | 226 | 209306 | 2485.33 | 336 | 326 | 84.1 |
| D | 13 | 249 | 116942 | 1386.87 | 336 | 326 | 84.1 |
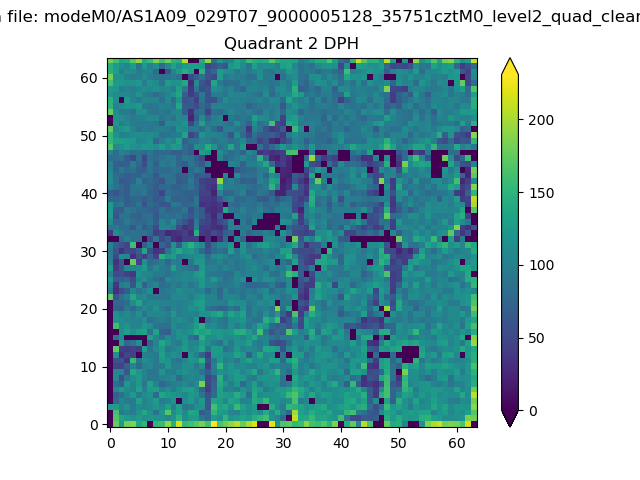
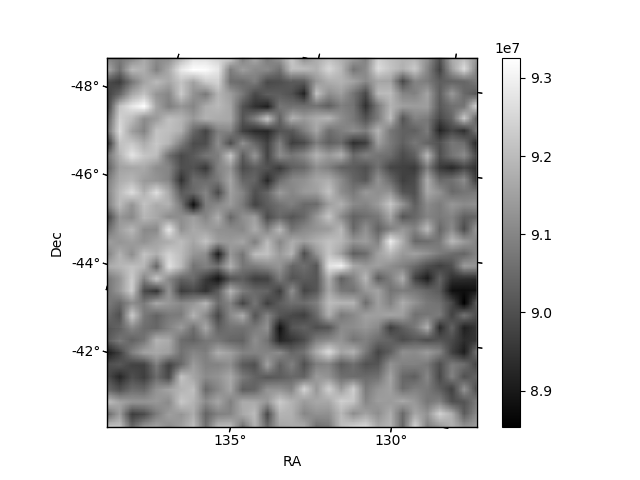
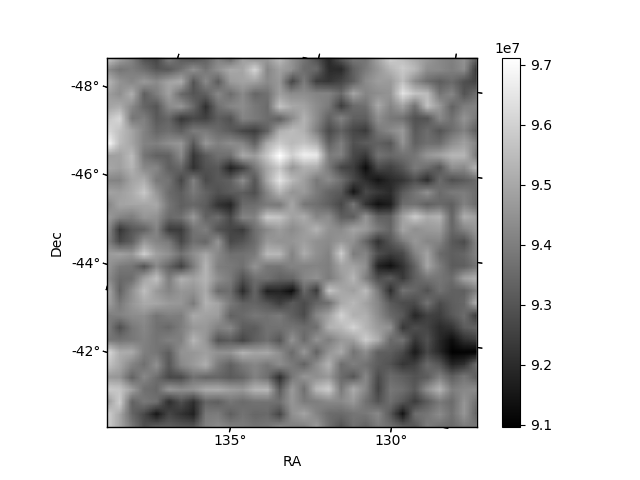
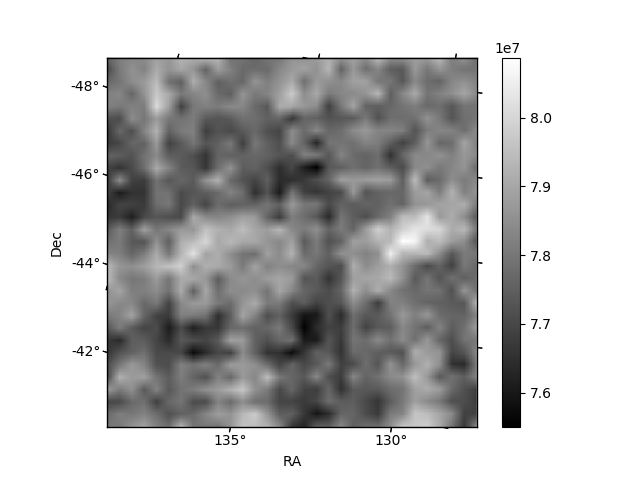
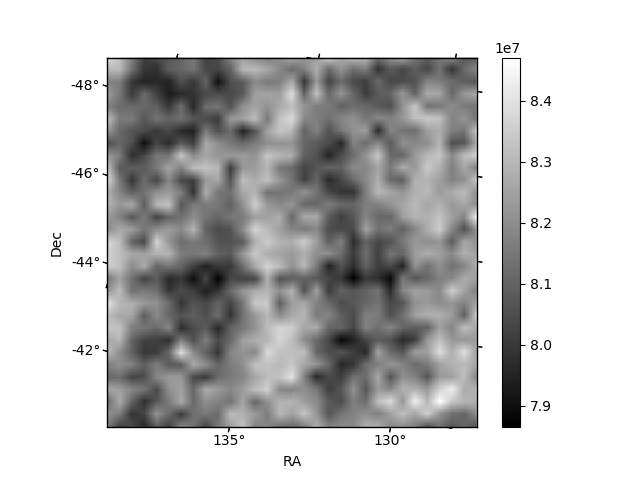
Histogram calculated using DETX and DETY for each event in the final _common_clean file
| Quadrant A | 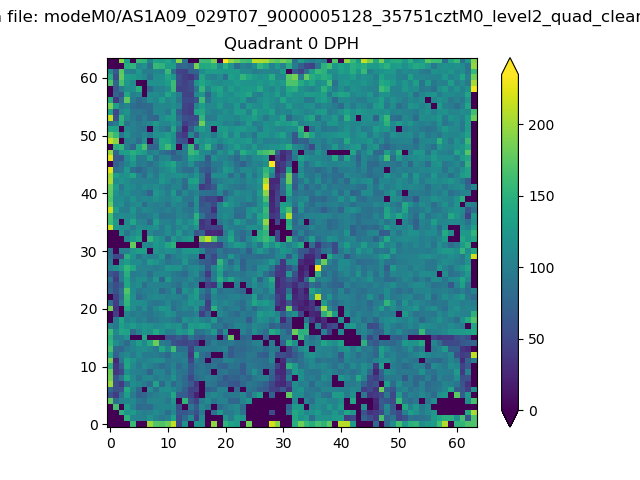 |
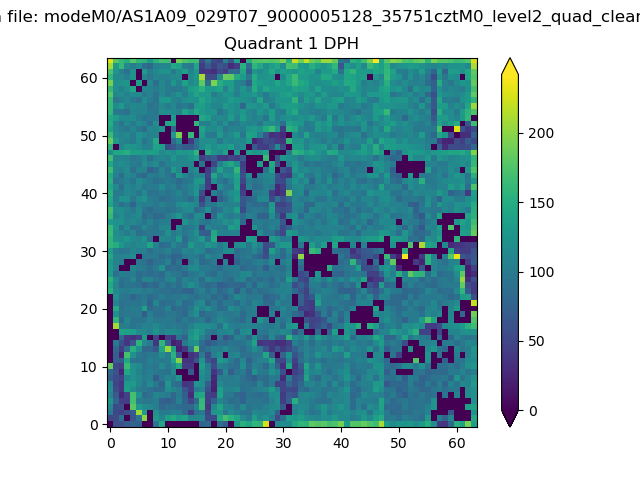 |
Quadrant B |
|---|---|---|---|
| Quadrant D | 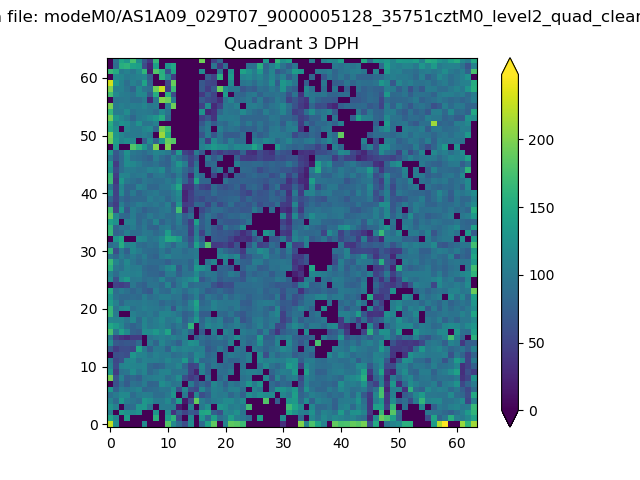 |
 |
Quadrant C |
| Plot type | Count rate plots | Images |
|---|---|---|
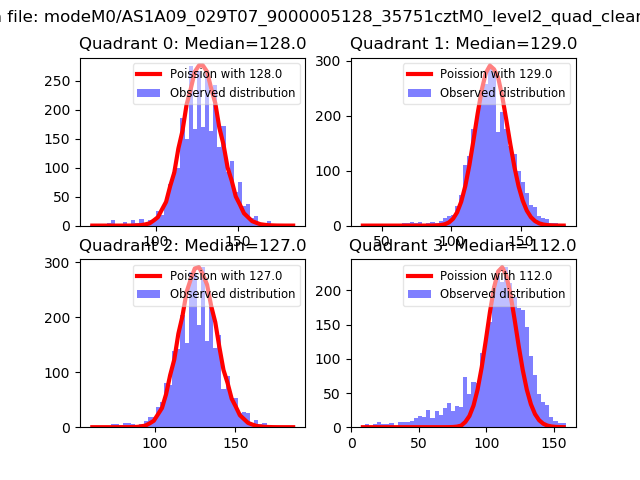
| Comparison with Poisson distribution Blue bars denote a histogram of data divided into 1 sec bins. Red curve is a Poisson curve with rate = median count rate of data. |
 |
 |
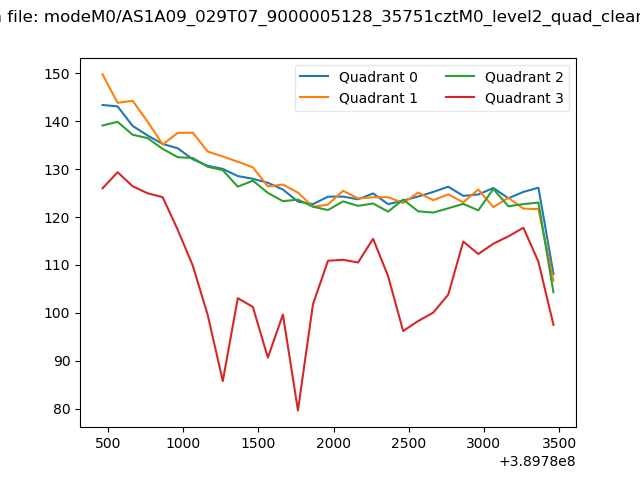
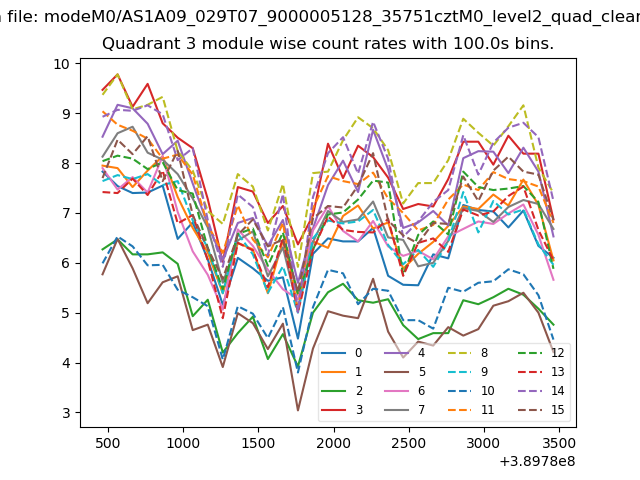
| Quadrant-wise count rates Data is divided into 100 sec bins |
 |
|
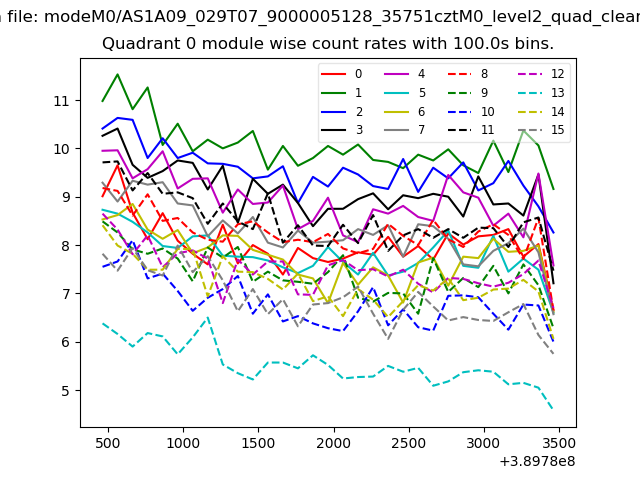
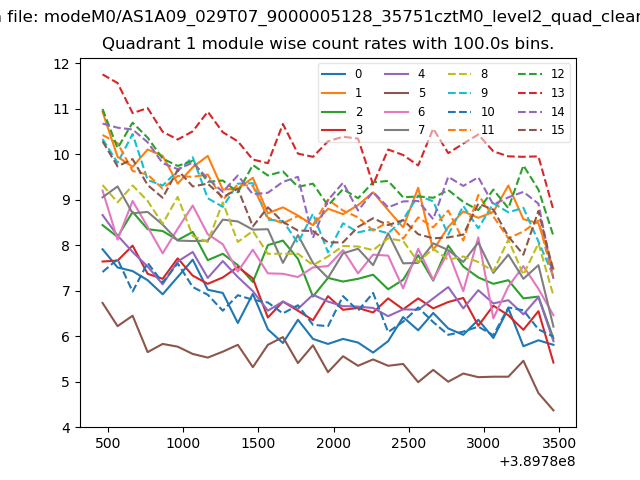
| Module-wise count rates for Quadrant A Data is divided into 100 sec bins |
 |
 |
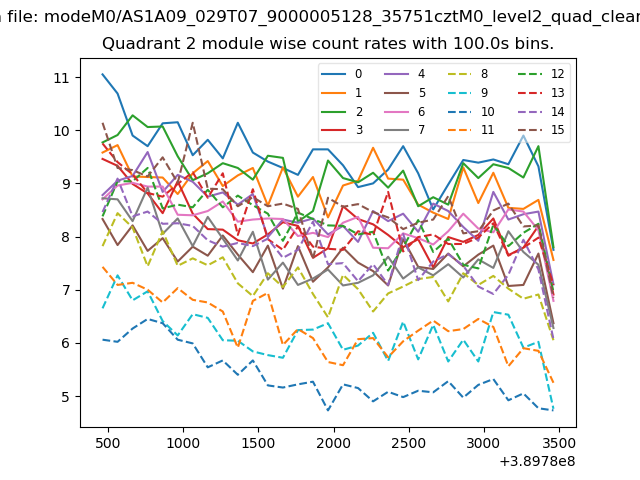
| Module-wise count rates for Quadrant B Data is divided into 100 sec bins |
 |
 |
| Module-wise count rates for Quadrant C Data is divided into 100 sec bins |
 |
 |
| Module-wise count rates for Quadrant D Data is divided into 100 sec bins |
 |
 |
| Parameter | Plot |
|---|---|
| CZT HV Monitor | 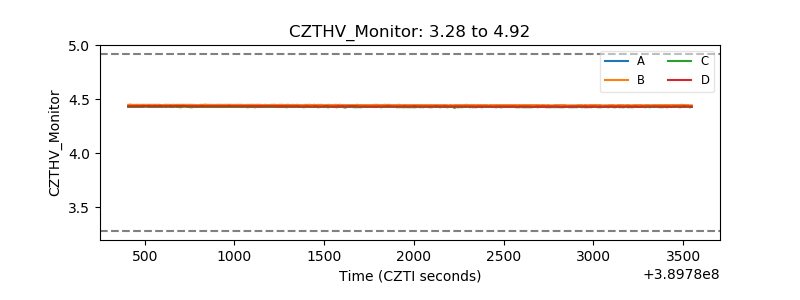 |
| D_VDD | 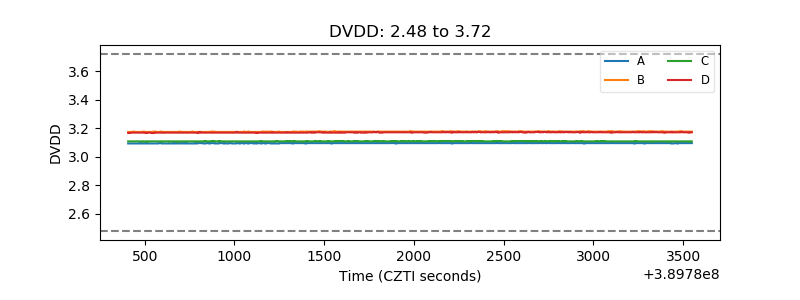 |
| Temperature 1 | 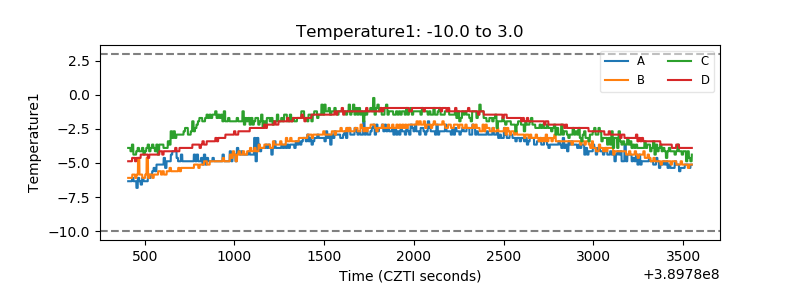 |
| Veto HV Monitor | 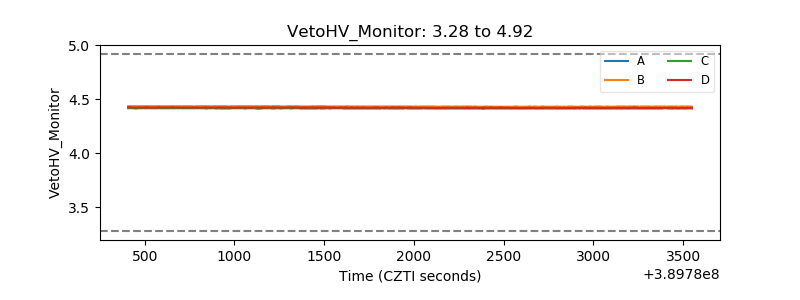 |
| Veto LLD | 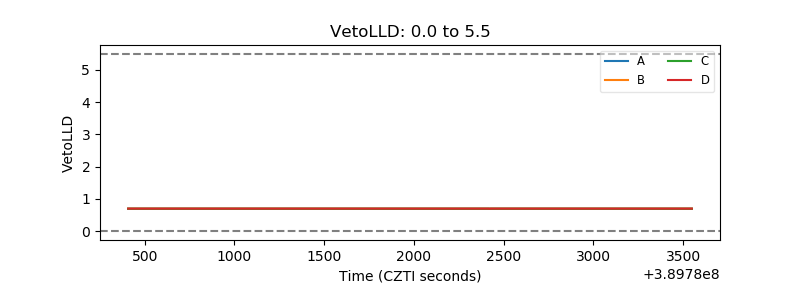 |
| Alpha Counter | 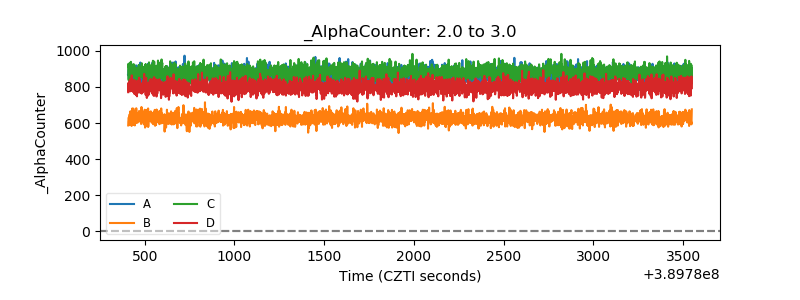 |
| _CPM_Rate | 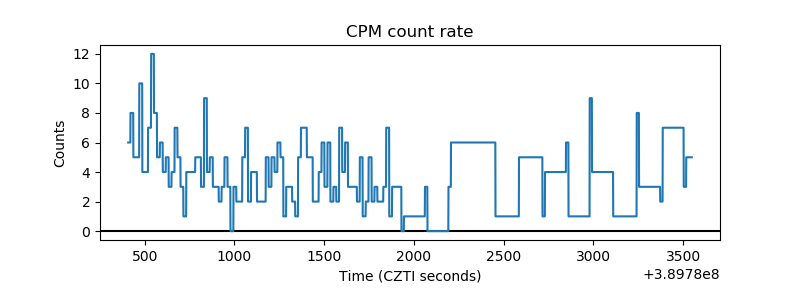 |
| CZT Counter | 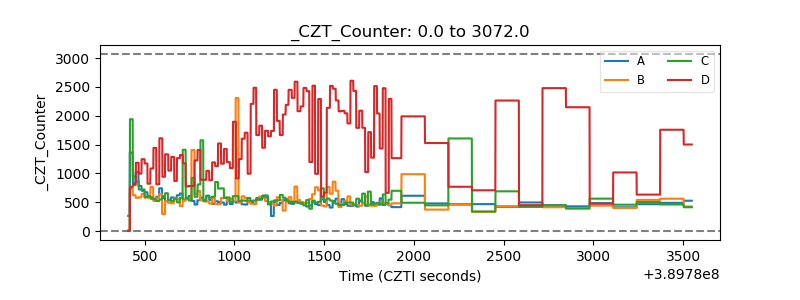 |
| +2.5 Volts monitor |  |
| +5 Volts monitor | 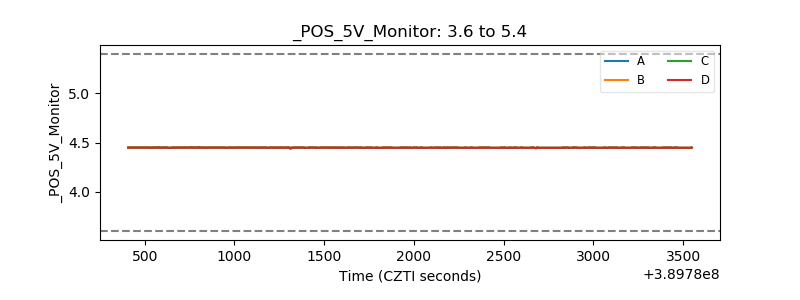 |
| _ROLL_ROT | 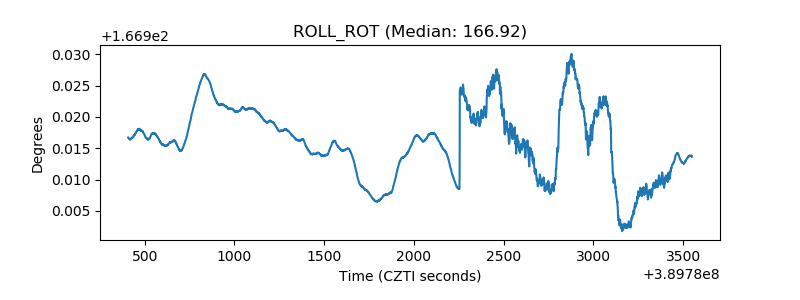 |
| _Roll_DEC | 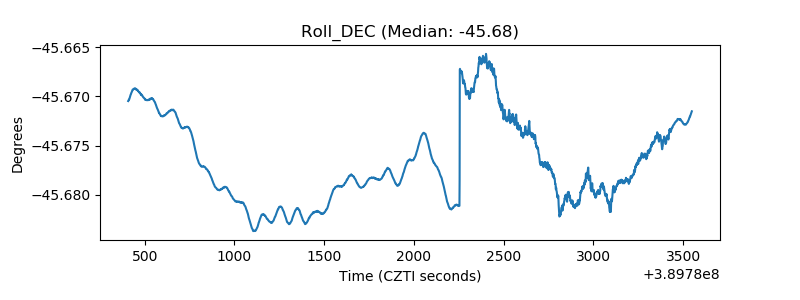 |
| _Roll_RA | 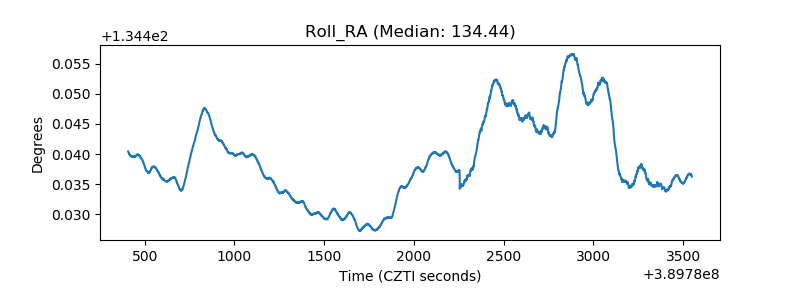 |
| Veto Counter | 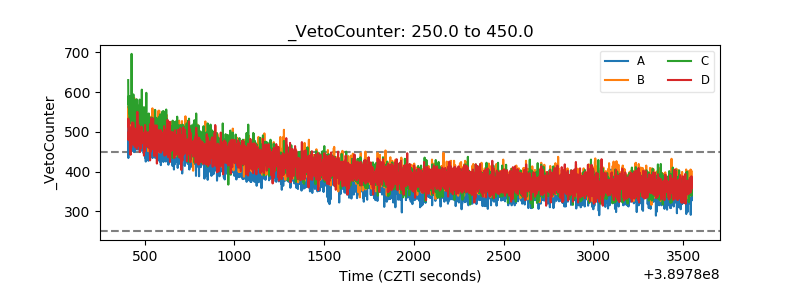 |