| Param | Original file | Final file |
|---|---|---|
| Filename | modeM0/AS1A09_142T06_9000005132cztM0_level2.fits | modeM0/AS1A09_142T06_9000005132cztM0_level2_quad_clean.evt |
| Size (bytes) | 180,256,320 | 150,828,480 |
| Size | 171.9 MB | 143.8 MB |
| Events in quadrant A | 1,115,316 | 853,342 |
| Events in quadrant B | 1,038,892 | 846,185 |
| Events in quadrant C | 1,090,810 | 838,029 |
| Events in quadrant D | 947,360 | 762,872 |
| Mode M0 | |||
|---|---|---|---|
| Quadrant | BADHDUFLAG | Total packets | Discarded packets |
| A | 0 | 42002 | 0 |
| B | 0 | 47127 | 0 |
| C | 0 | 40053 | 0 |
| D | 0 | 47739 | 0 |
| Mode SS | |||
|---|---|---|---|
| Quadrant | BADHDUFLAG | Total packets | Discarded packets |
| A | 0 | 378 | 0 |
| B | 0 | 378 | 0 |
| C | 0 | 378 | 0 |
| D | 0 | 378 | 0 |
| Mode M9 | |||
|---|---|---|---|
| Quadrant | BADHDUFLAG | Total packets | Discarded packets |
| A | 0 | 102 | 0 |
| B | 0 | 102 | 0 |
| C | 0 | 102 | 0 |
| D | 0 | 102 | 0 |
| Quadrant | Total seconds | Saturated seconds | Saturation percentage |
|---|---|---|---|
| A | 18375 | 481 | 2.617687% |
| B | 18375 | 999 | 5.436735% |
| C | 18375 | 296 | 1.610884% |
| D | 18375 | 715 | 3.891156% |
Noise dominated data is calculated using 1-second bins in cleaned event files. If a bin has >2000 counts, and if more than 50% of those come from <1% of pixels, then it is considered to be noise-dominated and hence unusable.
| Quadrant | # 1 sec bins | Bins with >0 counts | Bins with >2000 counts | High rate bins dominated by noise | Noise dominated (total time) | Noise dominated (detector-on time) | Marked lightcurve |
|---|---|---|---|---|---|---|---|
| A | 28566 | 18373 | 0 | 0 | 0.00% | 0.00% |  |
| B | 28566 | 18369 | 0 | 0 | 0.00% | 0.00% |  |
| C | 28566 | 18368 | 0 | 0 | 0.00% | 0.00% | 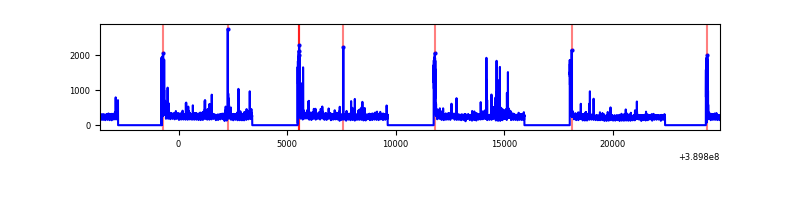 |
| D | 28566 | 18362 | 0 | 0 | 0.00% | 0.00% |  |
Top three noisy pixels from each quadrant. If the there are fewer than three noisy pixels in the level2.evt file, extra rows are filled as -1
| Pixel properties | Quadrant properties | ||||||
|---|---|---|---|---|---|---|---|
| Quadrant | DetID | PixID | Counts | Sigma | Mean | Median | Sigma |
| A | 9 | 19 | 985 | 9.7 | 291 | 276 | 73.1 |
| A | 7 | 110 | 930 | 8.95 | 291 | 276 | 73.1 |
| A | 0 | 29 | 887 | 8.36 | 291 | 276 | 73.1 |
| B | 2 | 9 | 964 | 12.67 | 274 | 263 | 55.3 |
| B | 3 | 80 | 824 | 10.14 | 274 | 263 | 55.3 |
| B | 2 | 8 | 768 | 9.13 | 274 | 263 | 55.3 |
| C | 1 | 81 | 926 | 8.58 | 289 | 274 | 76.0 |
| C | 1 | 80 | 885 | 8.04 | 289 | 274 | 76.0 |
| C | 1 | 65 | 808 | 7.03 | 289 | 274 | 76.0 |
| D | 7 | 3 | 765 | 7.13 | 271 | 249 | 72.4 |
| D | 6 | 67 | 716 | 6.45 | 271 | 249 | 72.4 |
| D | 10 | 113 | 700 | 6.23 | 271 | 249 | 72.4 |
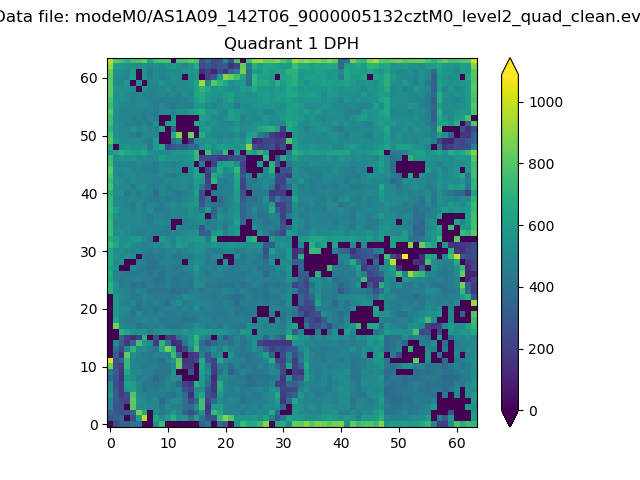
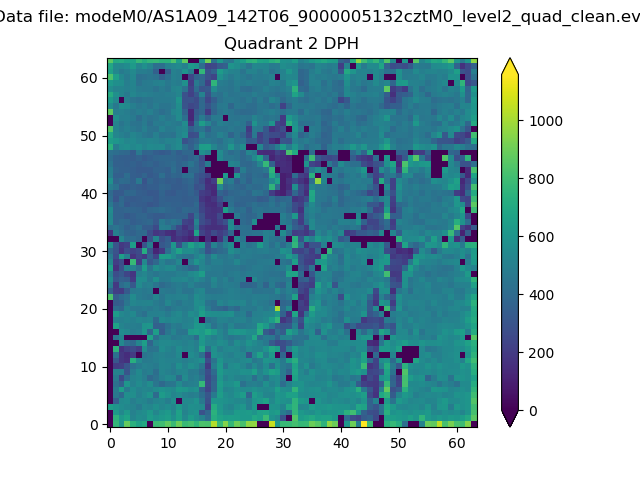
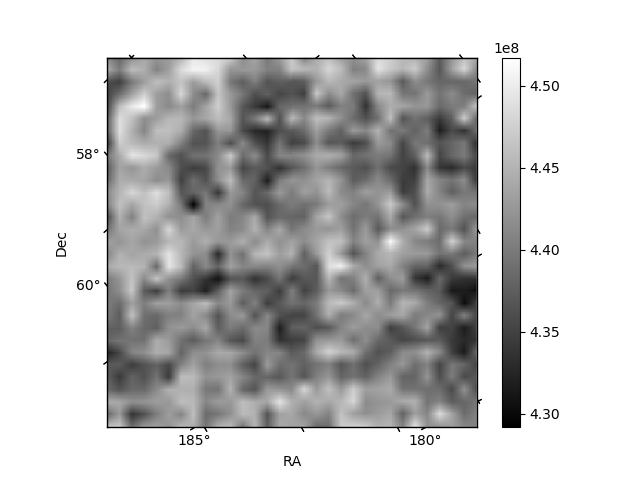
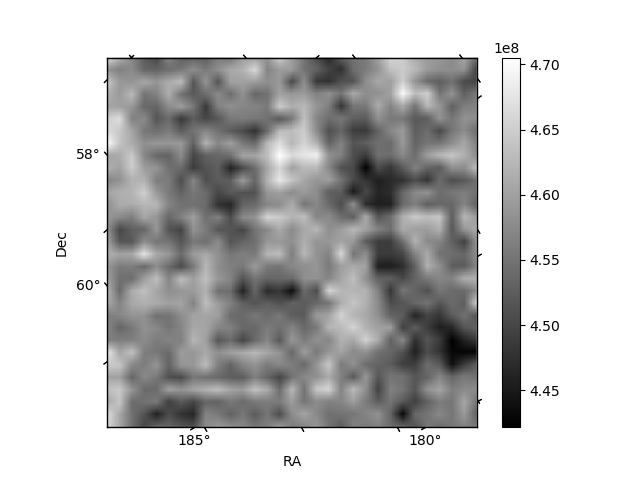
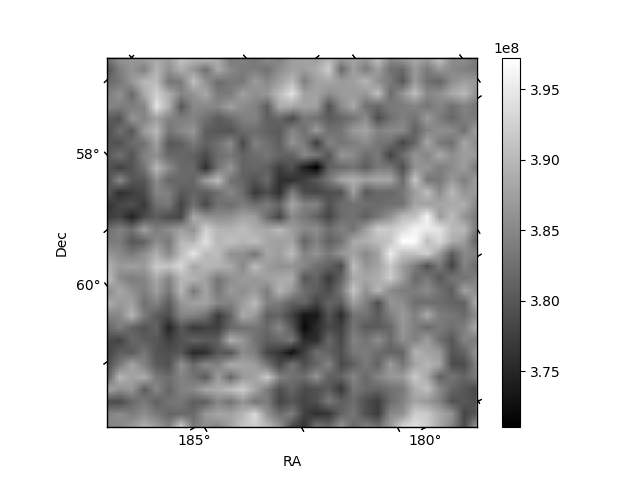
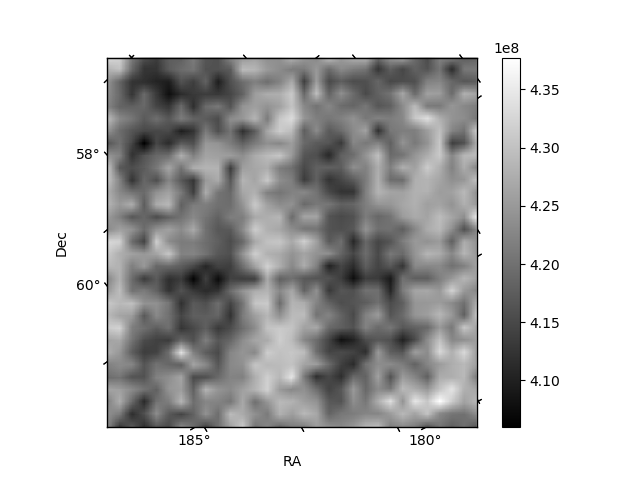
Histogram calculated using DETX and DETY for each event in the final _common_clean file
| Quadrant A |  |
 |
Quadrant B |
|---|---|---|---|
| Quadrant D | 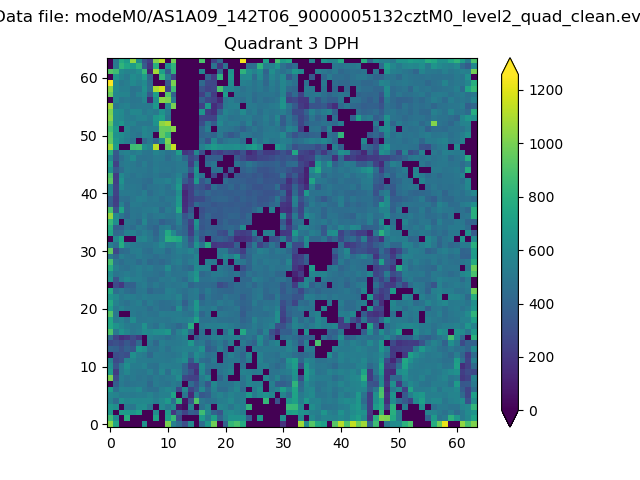 |
 |
Quadrant C |
| Plot type | Count rate plots | Images |
|---|---|---|
| Comparison with Poisson distribution Blue bars denote a histogram of data divided into 1 sec bins. Red curve is a Poisson curve with rate = median count rate of data. |
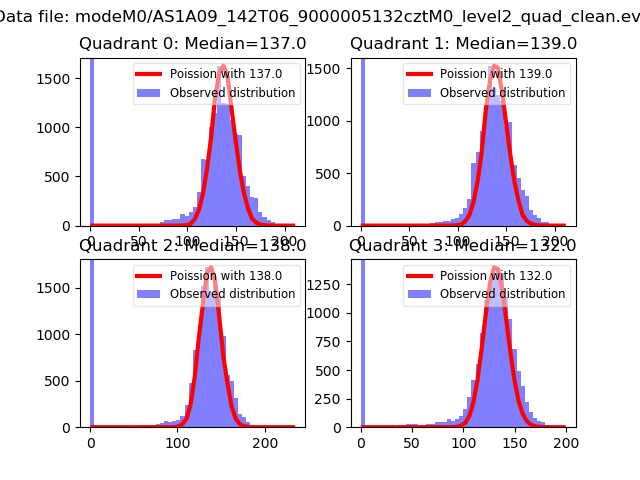 |
 |
| Quadrant-wise count rates Data is divided into 100 sec bins |
 |
|
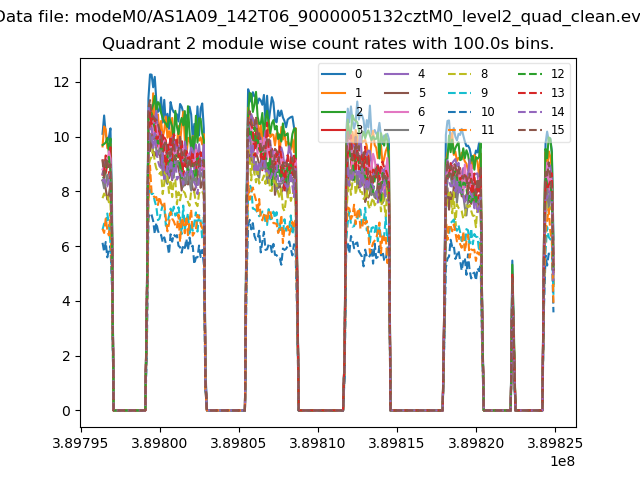
| Module-wise count rates for Quadrant A Data is divided into 100 sec bins |
 |
 |
| Module-wise count rates for Quadrant B Data is divided into 100 sec bins |
 |
 |
| Module-wise count rates for Quadrant C Data is divided into 100 sec bins |
 |
 |
| Module-wise count rates for Quadrant D Data is divided into 100 sec bins |
 |
 |
| Parameter | Plot |
|---|---|
| CZT HV Monitor |  |
| D_VDD | 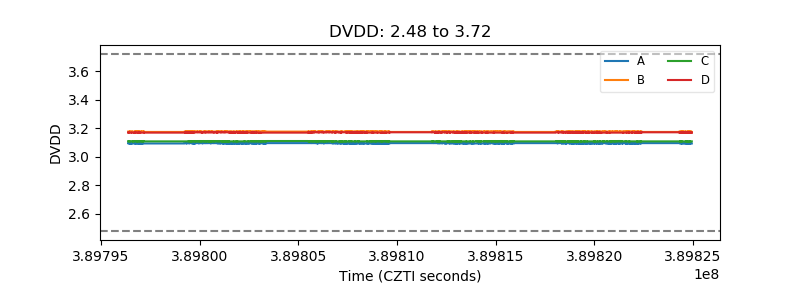 |
| Temperature 1 |  |
| Veto HV Monitor |  |
| Veto LLD |  |
| Alpha Counter |  |
| _CPM_Rate |  |
| CZT Counter |  |
| +2.5 Volts monitor |  |
| +5 Volts monitor |  |
| _ROLL_ROT |  |
| _Roll_DEC |  |
| _Roll_RA | 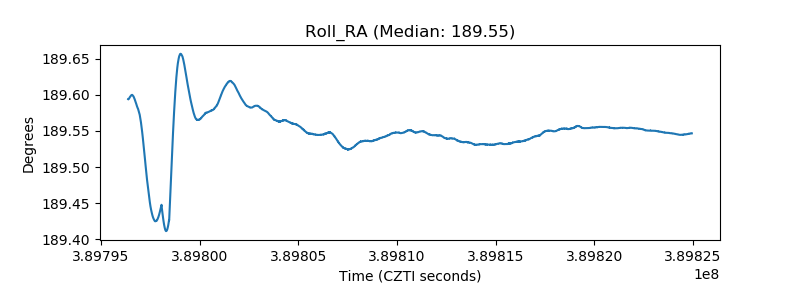 |
| Veto Counter |  |