| Param | Original file | Final file |
|---|---|---|
| Filename | modeM0/AS1A09_143T10_9000005130cztM0_level2.fits | modeM0/AS1A09_143T10_9000005130cztM0_level2_quad_clean.evt |
| Size (bytes) | 76,328,640 | 40,020,480 |
| Size | 72.8 MB | 38.2 MB |
| Events in quadrant A | 479,254 | 179,315 |
| Events in quadrant B | 448,306 | 176,948 |
| Events in quadrant C | 455,040 | 168,292 |
| Events in quadrant D | 395,420 | 152,337 |
| Mode M0 | |||
|---|---|---|---|
| Quadrant | BADHDUFLAG | Total packets | Discarded packets |
| A | 0 | 16157 | 0 |
| B | 0 | 17820 | 0 |
| C | 0 | 16894 | 0 |
| D | 0 | 22596 | 0 |
| Mode SS | |||
|---|---|---|---|
| Quadrant | BADHDUFLAG | Total packets | Discarded packets |
| A | 0 | 158 | 0 |
| B | 0 | 158 | 0 |
| C | 0 | 158 | 0 |
| D | 0 | 158 | 0 |
| Mode M9 | |||
|---|---|---|---|
| Quadrant | BADHDUFLAG | Total packets | Discarded packets |
| A | 0 | 37 | 0 |
| B | 0 | 37 | 0 |
| C | 0 | 37 | 0 |
| D | 0 | 37 | 0 |
| Quadrant | Total seconds | Saturated seconds | Saturation percentage |
|---|---|---|---|
| A | 7673 | 8 | 0.104262% |
| B | 7673 | 152 | 1.980972% |
| C | 7673 | 115 | 1.498762% |
| D | 7673 | 453 | 5.903819% |
Noise dominated data is calculated using 1-second bins in cleaned event files. If a bin has >2000 counts, and if more than 50% of those come from <1% of pixels, then it is considered to be noise-dominated and hence unusable.
| Quadrant | # 1 sec bins | Bins with >0 counts | Bins with >2000 counts | High rate bins dominated by noise | Noise dominated (total time) | Noise dominated (detector-on time) | Marked lightcurve |
|---|---|---|---|---|---|---|---|
| A | 11320 | 7673 | 0 | 0 | 0.00% | 0.00% |  |
| B | 11320 | 7671 | 0 | 0 | 0.00% | 0.00% |  |
| C | 11320 | 7672 | 0 | 0 | 0.00% | 0.00% |  |
| D | 11320 | 7664 | 0 | 0 | 0.00% | 0.00% | 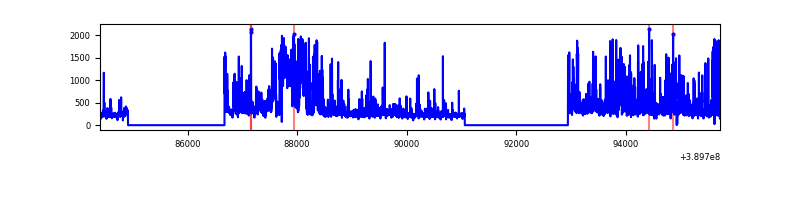 |
Top three noisy pixels from each quadrant. If the there are fewer than three noisy pixels in the level2.evt file, extra rows are filled as -1
| Pixel properties | Quadrant properties | ||||||
|---|---|---|---|---|---|---|---|
| Quadrant | DetID | PixID | Counts | Sigma | Mean | Median | Sigma |
| A | 7 | 110 | 373 | 7.74 | 125 | 118 | 32.9 |
| A | 14 | 95 | 368 | 7.59 | 125 | 118 | 32.9 |
| A | 0 | 29 | 365 | 7.5 | 125 | 118 | 32.9 |
| B | 2 | 9 | 406 | 11.1 | 119 | 114 | 26.3 |
| B | 3 | 80 | 361 | 9.39 | 119 | 114 | 26.3 |
| B | 5 | 128 | 314 | 7.6 | 119 | 114 | 26.3 |
| C | 1 | 81 | 361 | 7.64 | 120 | 112 | 32.5 |
| C | 3 | 202 | 357 | 7.51 | 120 | 112 | 32.5 |
| C | 3 | 203 | 347 | 7.21 | 120 | 112 | 32.5 |
| D | 10 | 189 | 303 | 6.49 | 112 | 103 | 30.8 |
| D | 6 | 231 | 303 | 6.49 | 112 | 103 | 30.8 |
| D | 4 | 160 | 296 | 6.27 | 112 | 103 | 30.8 |
Histogram calculated using DETX and DETY for each event in the final _common_clean file
| Quadrant A | 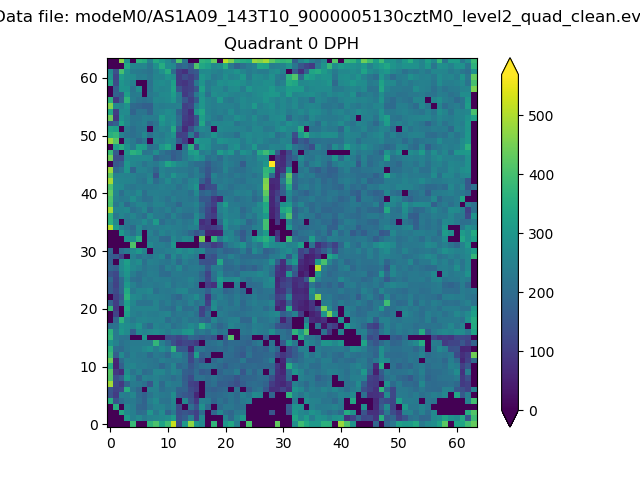 |
 |
Quadrant B |
|---|---|---|---|
| Quadrant D | 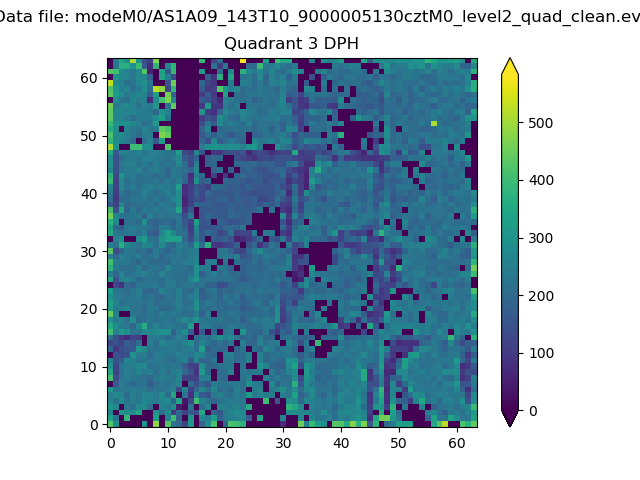 |
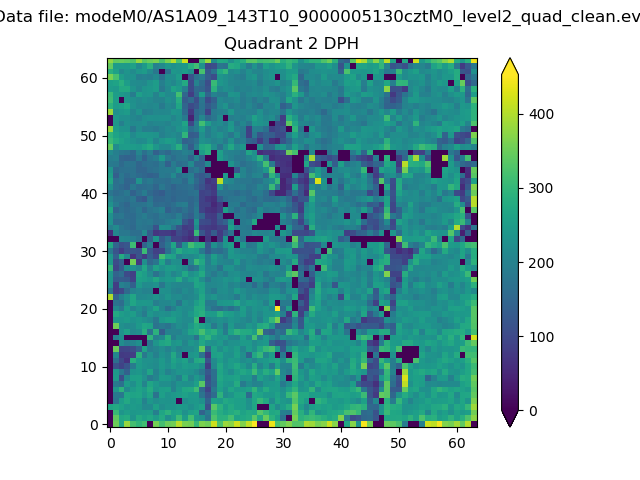 |
Quadrant C |
| Plot type | Count rate plots | Images |
|---|---|---|
| Comparison with Poisson distribution Blue bars denote a histogram of data divided into 1 sec bins. Red curve is a Poisson curve with rate = median count rate of data. |
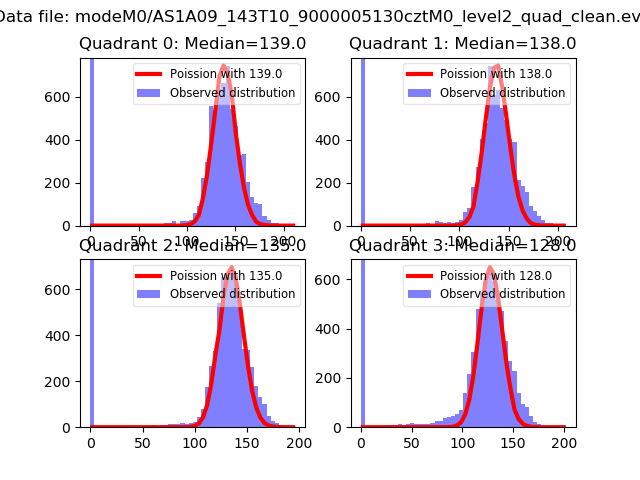 |
 |
| Quadrant-wise count rates Data is divided into 100 sec bins |
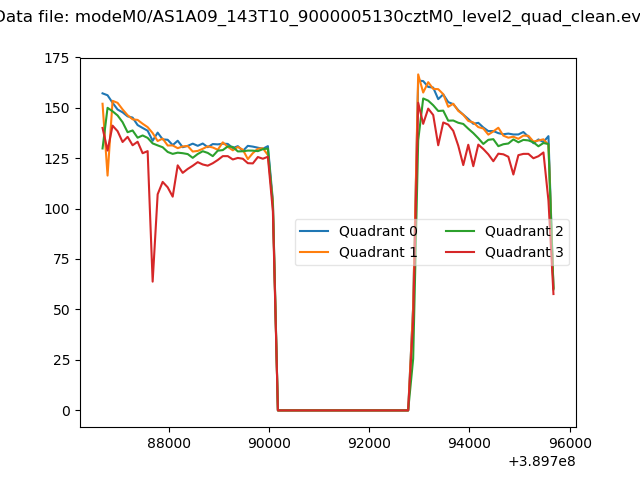 |
|
| Module-wise count rates for Quadrant A Data is divided into 100 sec bins |
 |
 |
| Module-wise count rates for Quadrant B Data is divided into 100 sec bins |
 |
 |
| Module-wise count rates for Quadrant C Data is divided into 100 sec bins |
 |
 |
| Module-wise count rates for Quadrant D Data is divided into 100 sec bins |
 |
 |
| Parameter | Plot |
|---|---|
| CZT HV Monitor |  |
| D_VDD |  |
| Temperature 1 |  |
| Veto HV Monitor | 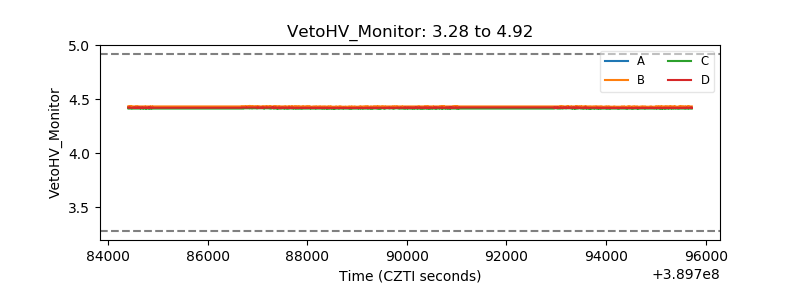 |
| Veto LLD |  |
| Alpha Counter | 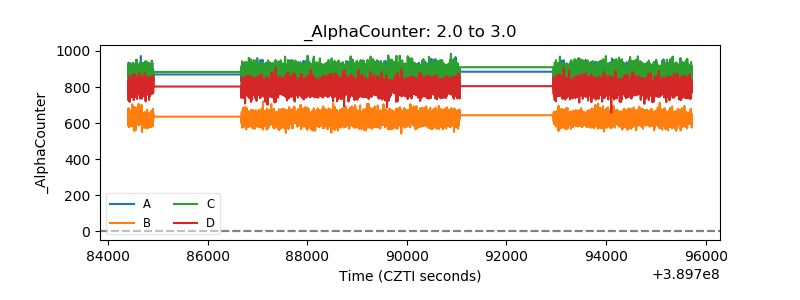 |
| _CPM_Rate |  |
| CZT Counter | 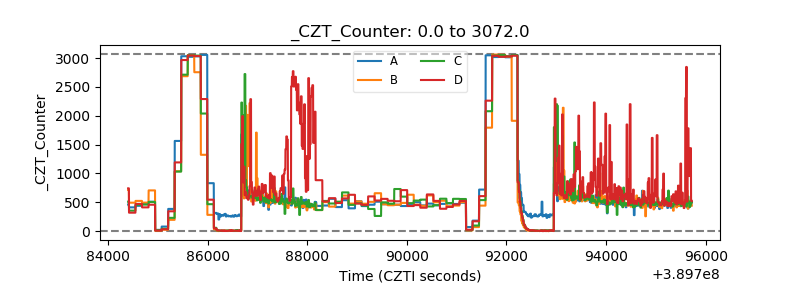 |
| +2.5 Volts monitor |  |
| +5 Volts monitor |  |
| _ROLL_ROT |  |
| _Roll_DEC | 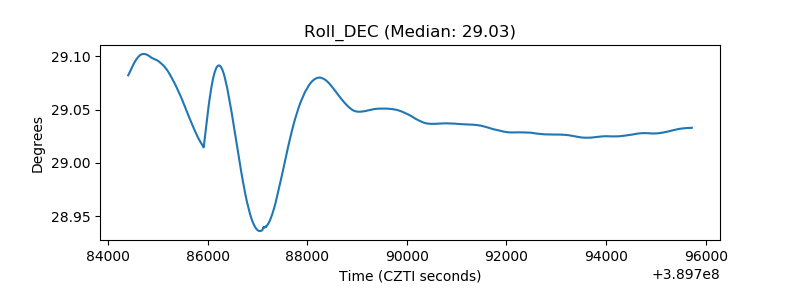 |
| _Roll_RA |  |
| Veto Counter |  |