| Param | Original file | Final file |
|---|---|---|
| Filename | modeM0/AS1A10_058T14_9000005134cztM0_level2.fits | modeM0/AS1A10_058T14_9000005134cztM0_level2_quad_clean.evt |
| Size (bytes) | 597,648,960 | 600,909,120 |
| Size | 570.0 MB | 573.1 MB |
| Events in quadrant A | 3,719,334 | 3,763,184 |
| Events in quadrant B | 3,484,220 | 3,679,169 |
| Events in quadrant C | 3,556,594 | 3,468,221 |
| Events in quadrant D | 3,019,870 | 2,970,158 |
| Mode SS | |||
|---|---|---|---|
| Quadrant | BADHDUFLAG | Total packets | Discarded packets |
| A | 0 | 1288 | 0 |
| B | 0 | 1288 | 0 |
| C | 0 | 1288 | 0 |
| D | 0 | 1288 | 0 |
| Mode M9 | |||
|---|---|---|---|
| Quadrant | BADHDUFLAG | Total packets | Discarded packets |
| A | 0 | 240 | 0 |
| B | 0 | 240 | 0 |
| C | 0 | 240 | 0 |
| D | 0 | 240 | 0 |
| Mode M0 | |||
|---|---|---|---|
| Quadrant | BADHDUFLAG | Total packets | Discarded packets |
| A | 0 | 139822 | 0 |
| B | 0 | 154168 | 0 |
| C | 0 | 139274 | 0 |
| D | 0 | 194331 | 0 |
| Quadrant | Total seconds | Saturated seconds | Saturation percentage |
|---|---|---|---|
| A | 62945 | 113 | 0.179522% |
| B | 62945 | 2011 | 3.194853% |
| C | 62945 | 796 | 1.264596% |
| D | 62945 | 5164 | 8.203988% |
Noise dominated data is calculated using 1-second bins in cleaned event files. If a bin has >2000 counts, and if more than 50% of those come from <1% of pixels, then it is considered to be noise-dominated and hence unusable.
| Quadrant | # 1 sec bins | Bins with >0 counts | Bins with >2000 counts | High rate bins dominated by noise | Noise dominated (total time) | Noise dominated (detector-on time) | Marked lightcurve |
|---|---|---|---|---|---|---|---|
| A | 87000 | 62945 | 0 | 0 | 0.00% | 0.00% |  |
| B | 87000 | 62931 | 0 | 0 | 0.00% | 0.00% |  |
| C | 87000 | 62913 | 0 | 0 | 0.00% | 0.00% |  |
| D | 87000 | 62876 | 0 | 0 | 0.00% | 0.00% |  |
Top three noisy pixels from each quadrant. If the there are fewer than three noisy pixels in the level2.evt file, extra rows are filled as -1
| Pixel properties | Quadrant properties | ||||||
|---|---|---|---|---|---|---|---|
| Quadrant | DetID | PixID | Counts | Sigma | Mean | Median | Sigma |
| A | 9 | 19 | 3062 | 8.93 | 971 | 915 | 240.5 |
| A | 7 | 110 | 2993 | 8.64 | 971 | 915 | 240.5 |
| A | 0 | 29 | 2952 | 8.47 | 971 | 915 | 240.5 |
| B | 2 | 9 | 3020 | 11.63 | 924 | 884 | 183.7 |
| B | 3 | 80 | 2775 | 10.29 | 924 | 884 | 183.7 |
| B | 2 | 8 | 2486 | 8.72 | 924 | 884 | 183.7 |
| C | 1 | 81 | 2858 | 8.18 | 940 | 884 | 241.3 |
| C | 1 | 80 | 2799 | 7.94 | 940 | 884 | 241.3 |
| C | 3 | 187 | 2401 | 6.29 | 940 | 884 | 241.3 |
| D | 6 | 62 | 2212 | 6.13 | 865 | 792 | 231.7 |
| D | 3 | 14 | 2201 | 6.08 | 865 | 792 | 231.7 |
| D | 10 | 189 | 2190 | 6.03 | 865 | 792 | 231.7 |
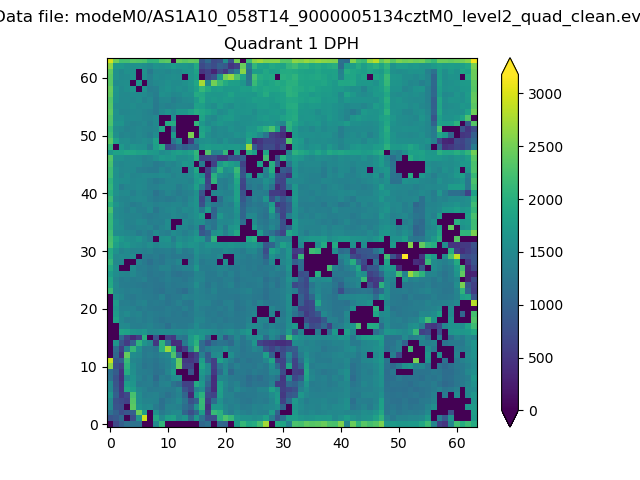
Histogram calculated using DETX and DETY for each event in the final _common_clean file
| Quadrant A |  |
 |
Quadrant B |
|---|---|---|---|
| Quadrant D |  |
 |
Quadrant C |
| Plot type | Count rate plots | Images |
|---|---|---|
| Comparison with Poisson distribution Blue bars denote a histogram of data divided into 1 sec bins. Red curve is a Poisson curve with rate = median count rate of data. |
 |
 |
| Quadrant-wise count rates Data is divided into 100 sec bins |
 |
|
| Module-wise count rates for Quadrant A Data is divided into 100 sec bins |
 |
 |
| Module-wise count rates for Quadrant B Data is divided into 100 sec bins |
 |
 |
| Module-wise count rates for Quadrant C Data is divided into 100 sec bins |
 |
 |
| Module-wise count rates for Quadrant D Data is divided into 100 sec bins |
 |
 |
| Parameter | Plot |
|---|---|
| CZT HV Monitor |  |
| D_VDD |  |
| Temperature 1 |  |
| Veto HV Monitor |  |
| Veto LLD |  |
| Alpha Counter |  |
| _CPM_Rate |  |
| CZT Counter |  |
| +2.5 Volts monitor |  |
| +5 Volts monitor |  |
| _ROLL_ROT |  |
| _Roll_DEC |  |
| _Roll_RA |  |
| Veto Counter |  |