| Param | Original file | Final file |
|---|---|---|
| Filename | modeM0/AS1A10_058T14_9000005134_35772cztM0_level2.evt | modeM0/AS1A10_058T14_9000005134_35772cztM0_level2_quad_clean.evt |
| Size (bytes) | 416,257,920 | 66,453,120 |
| Size | 397.0 MB | 63.4 MB |
| Events in quadrant A | 2,585,753 | 424,284 |
| Events in quadrant B | 3,537,948 | 417,273 |
| Events in quadrant C | 2,824,996 | 399,143 |
| Events in quadrant D | 3,289,003 | 391,734 |
| Mode SS | |||
|---|---|---|---|
| Quadrant | BADHDUFLAG | Total packets | Discarded packets |
| A | 0 | 110 | 0 |
| B | 0 | 110 | 0 |
| C | 0 | 110 | 0 |
| D | 0 | 110 | 0 |
| Mode M9 | |||
|---|---|---|---|
| Quadrant | BADHDUFLAG | Total packets | Discarded packets |
| A | 0 | 27 | 0 |
| B | 0 | 27 | 0 |
| C | 0 | 27 | 0 |
| D | 0 | 28 | 0 |
| Mode M0 | |||
|---|---|---|---|
| Quadrant | BADHDUFLAG | Total packets | Discarded packets |
| A | 0 | 11193 | 3 |
| B | 0 | 14017 | 2 |
| C | 0 | 11801 | 2 |
| D | 0 | 13311 | 2 |
| Quadrant | Total seconds | Saturated seconds | Saturation percentage |
|---|---|---|---|
| A | 5424 | 5 | 0.092183% |
| B | 5424 | 265 | 4.885693% |
| C | 5424 | 94 | 1.733038% |
| D | 5424 | 137 | 2.525811% |
Noise dominated data is calculated using 1-second bins in cleaned event files. If a bin has >2000 counts, and if more than 50% of those come from <1% of pixels, then it is considered to be noise-dominated and hence unusable.
| Quadrant | # 1 sec bins | Bins with >0 counts | Bins with >2000 counts | High rate bins dominated by noise | Noise dominated (total time) | Noise dominated (detector-on time) | Marked lightcurve |
|---|---|---|---|---|---|---|---|
| A | 7128 | 5425 | 1 | 1 | 0.01% | 0.02% | 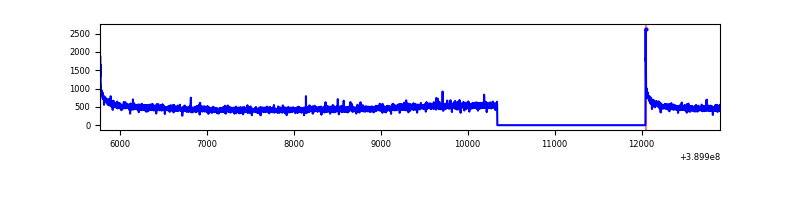 |
| B | 7128 | 5425 | 181 | 181 | 2.54% | 3.34% | 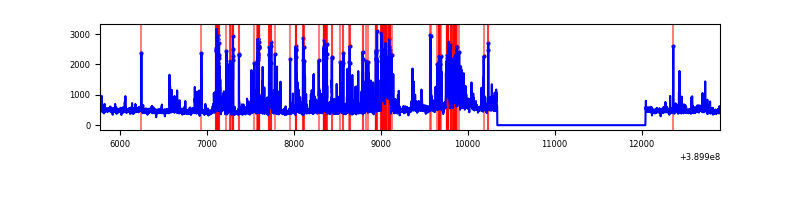 |
| C | 7128 | 5425 | 86 | 86 | 1.21% | 1.59% | 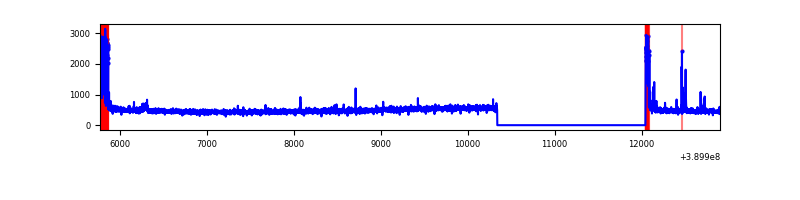 |
| D | 7128 | 5425 | 114 | 114 | 1.60% | 2.10% | 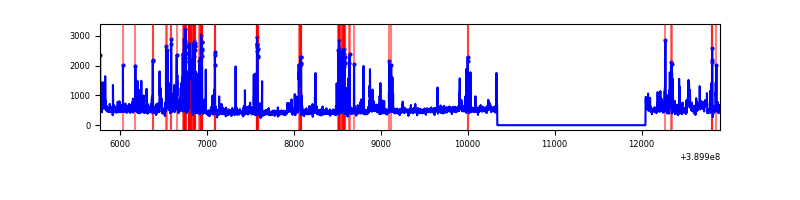 |
Top three noisy pixels from each quadrant. If the there are fewer than three noisy pixels in the level2.evt file, extra rows are filled as -1
| Pixel properties | Quadrant properties | ||||||
|---|---|---|---|---|---|---|---|
| Quadrant | DetID | PixID | Counts | Sigma | Mean | Median | Sigma |
| A | 10 | 83 | 160800 | 1261.06 | 623 | 611 | 127.0 |
| A | 13 | 6 | 12239 | 91.54 | 623 | 611 | 127.0 |
| A | 3 | 137 | 6426 | 45.78 | 623 | 611 | 127.0 |
| B | 5 | 172 | 500449 | 4251.28 | 610 | 596 | 117.6 |
| B | 5 | 255 | 425390 | 3612.9 | 610 | 596 | 117.6 |
| B | 0 | 197 | 49353 | 414.68 | 610 | 596 | 117.6 |
| C | 0 | 10 | 247464 | 1779.86 | 593 | 597 | 138.7 |
| C | 15 | 214 | 228537 | 1643.4 | 593 | 597 | 138.7 |
| C | 9 | 187 | 27788 | 196.04 | 593 | 597 | 138.7 |
| D | 13 | 249 | 364637 | 2495.12 | 594 | 576 | 145.9 |
| D | 10 | 118 | 240954 | 1647.45 | 594 | 576 | 145.9 |
| D | 7 | 223 | 120488 | 821.83 | 594 | 576 | 145.9 |
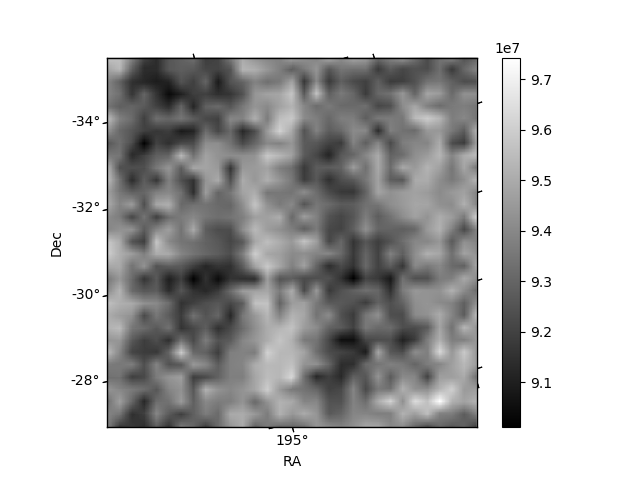
Histogram calculated using DETX and DETY for each event in the final _common_clean file
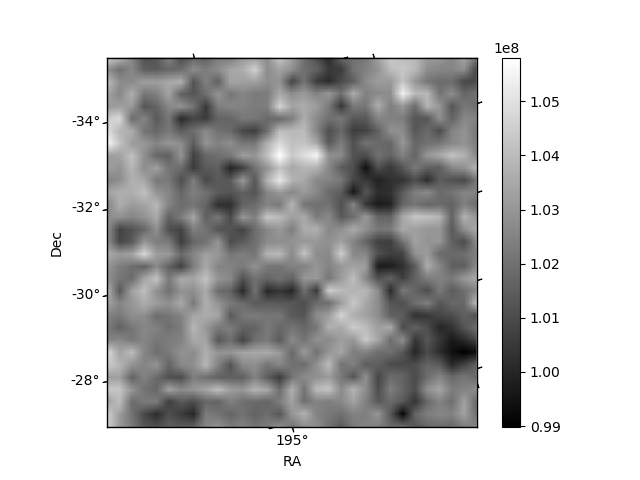
| Quadrant A | 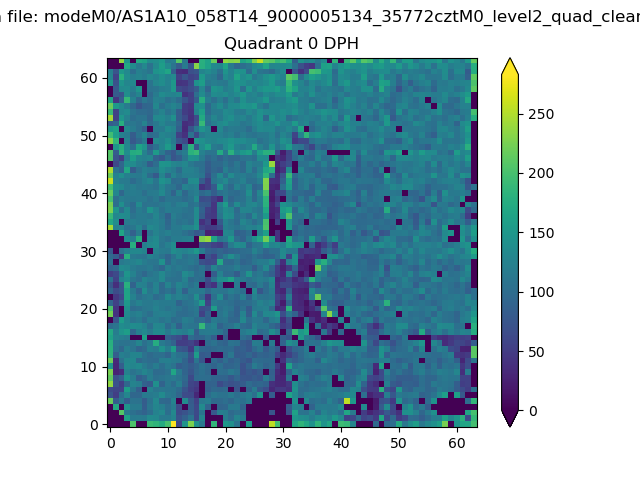 |
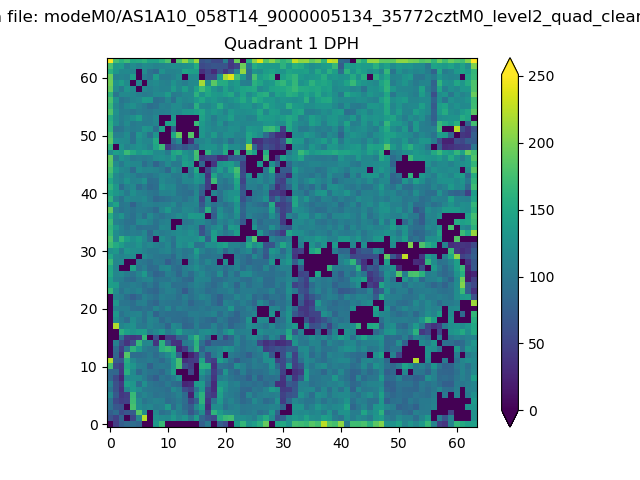 |
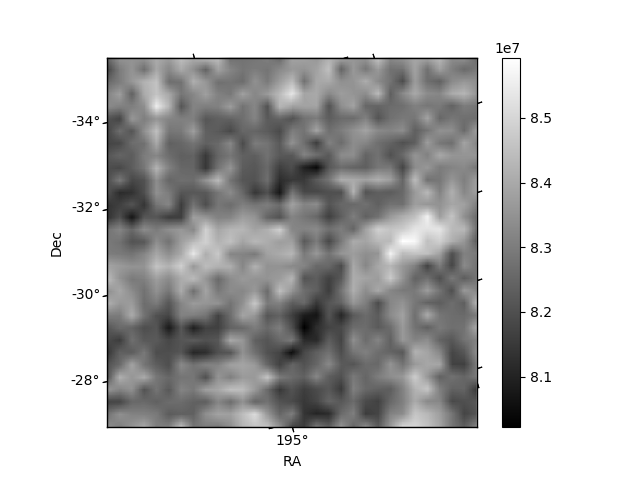
Quadrant B |
|---|---|---|---|
| Quadrant D | 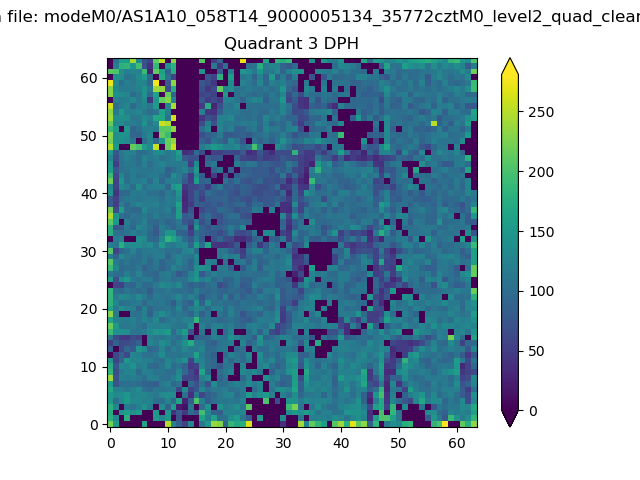 |
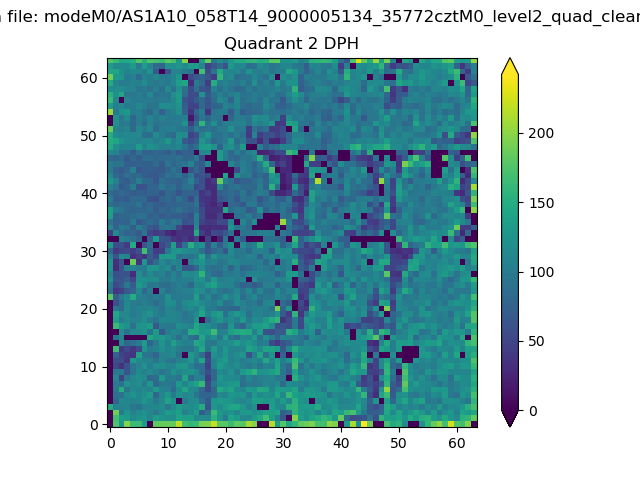 |
Quadrant C |
| Plot type | Count rate plots | Images |
|---|---|---|
| Comparison with Poisson distribution Blue bars denote a histogram of data divided into 1 sec bins. Red curve is a Poisson curve with rate = median count rate of data. |
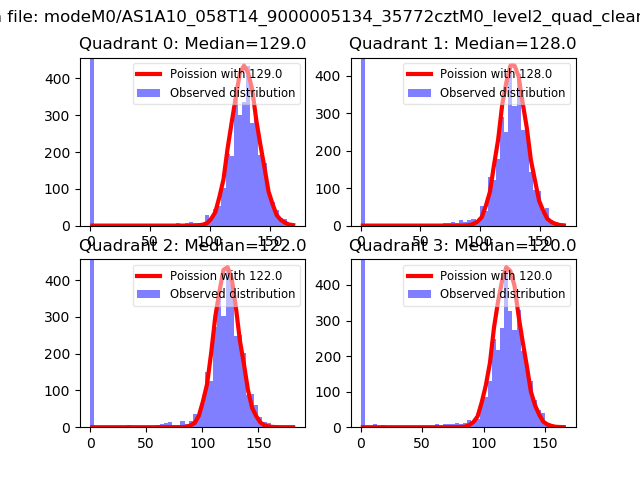 |
 |
| Quadrant-wise count rates Data is divided into 100 sec bins |
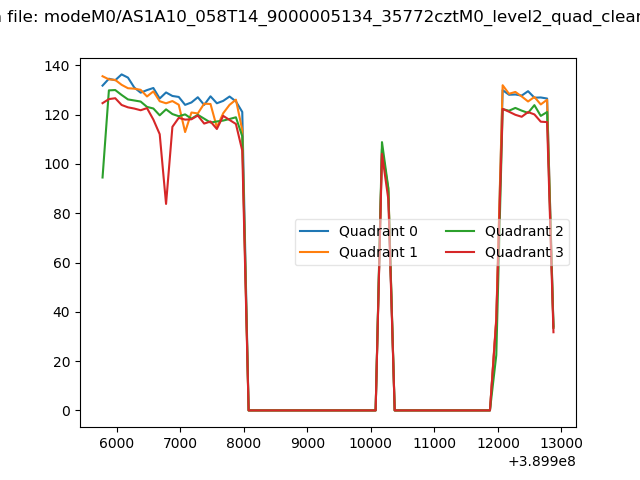 |
|
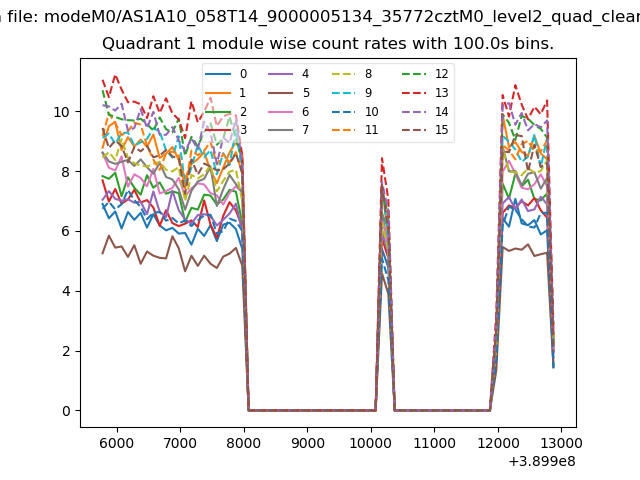
| Module-wise count rates for Quadrant A Data is divided into 100 sec bins |
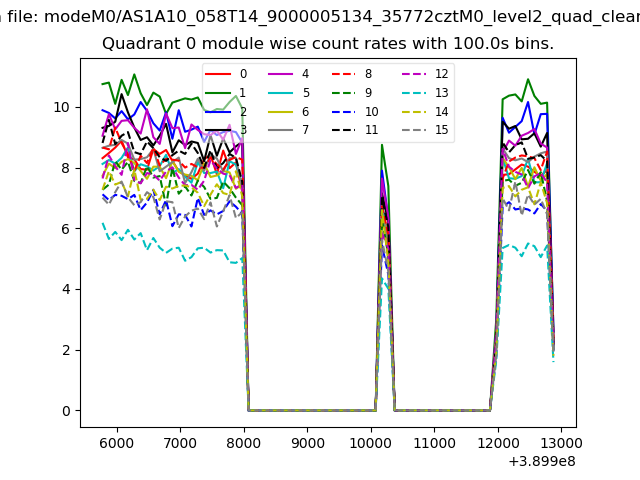 |
 |
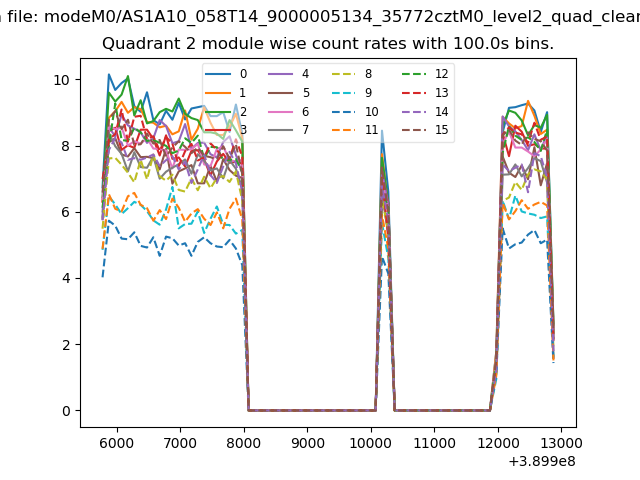
| Module-wise count rates for Quadrant B Data is divided into 100 sec bins |
 |
 |
| Module-wise count rates for Quadrant C Data is divided into 100 sec bins |
 |
 |
| Module-wise count rates for Quadrant D Data is divided into 100 sec bins |
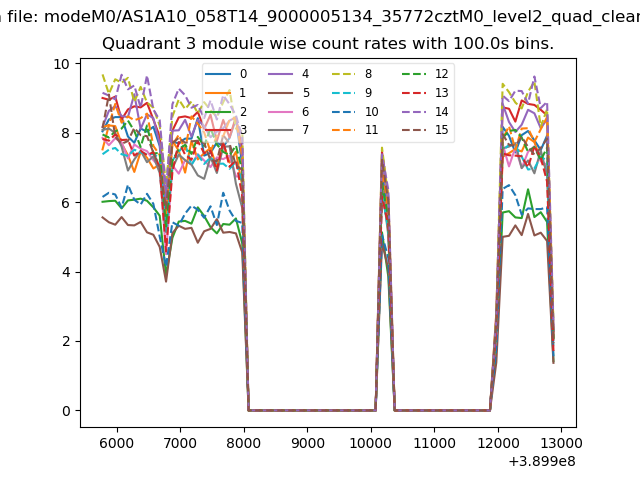 |
 |
| Parameter | Plot |
|---|---|
| CZT HV Monitor | 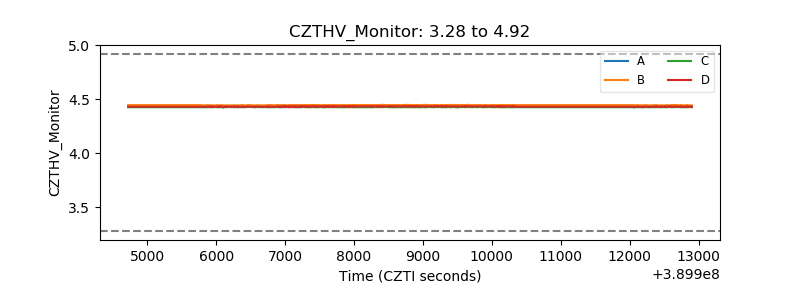 |
| D_VDD | 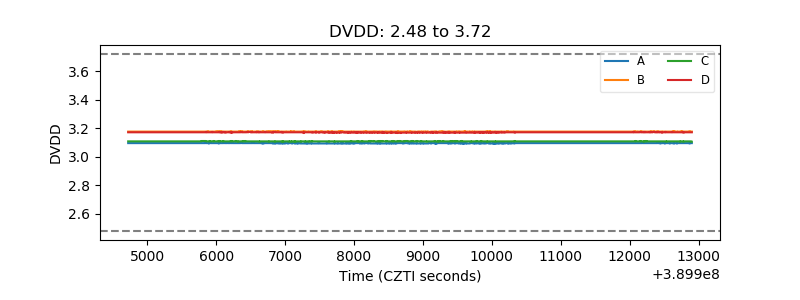 |
| Temperature 1 | 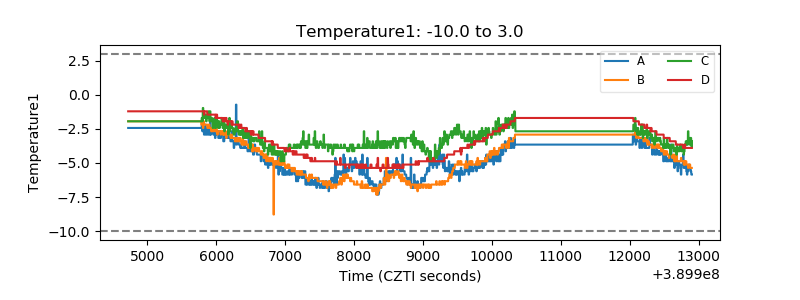 |
| Veto HV Monitor |  |
| Veto LLD |  |
| Alpha Counter | 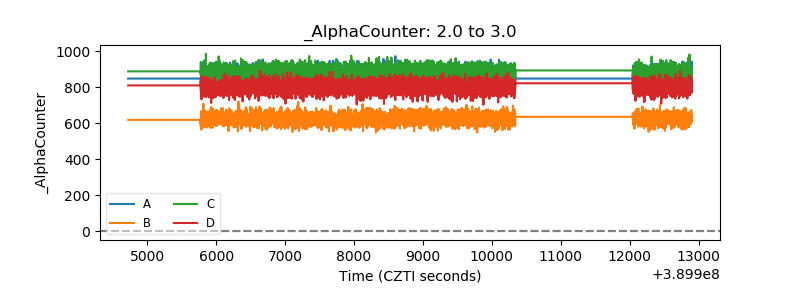 |
| _CPM_Rate | 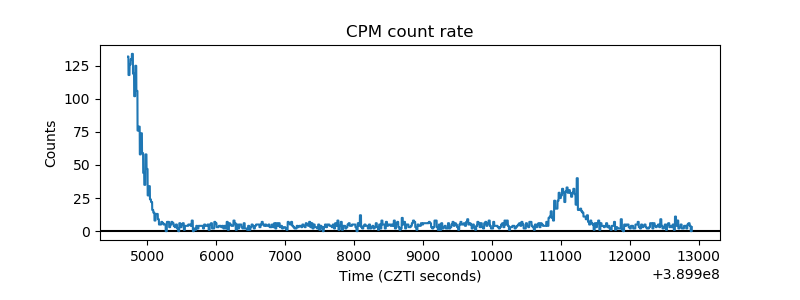 |
| CZT Counter | 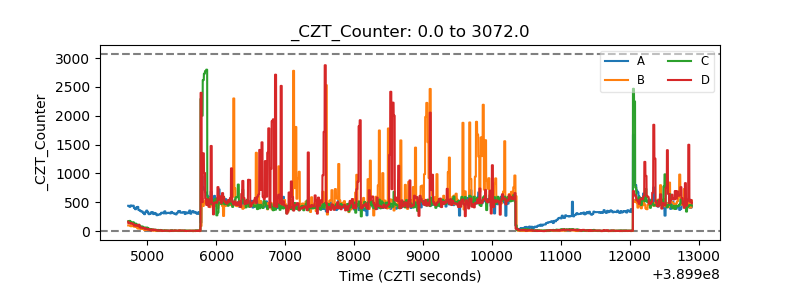 |
| +2.5 Volts monitor | 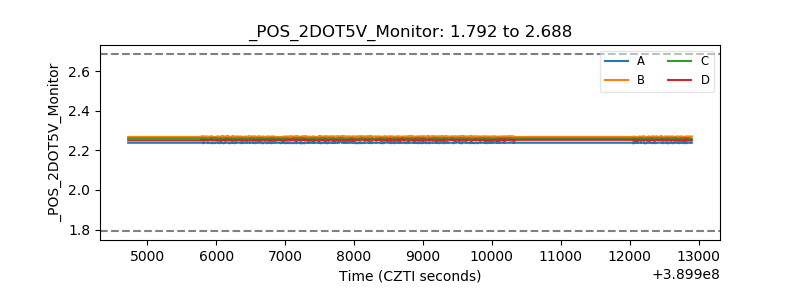 |
| +5 Volts monitor | 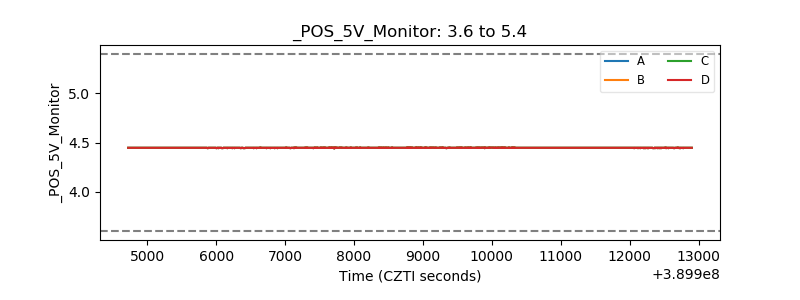 |
| _ROLL_ROT | 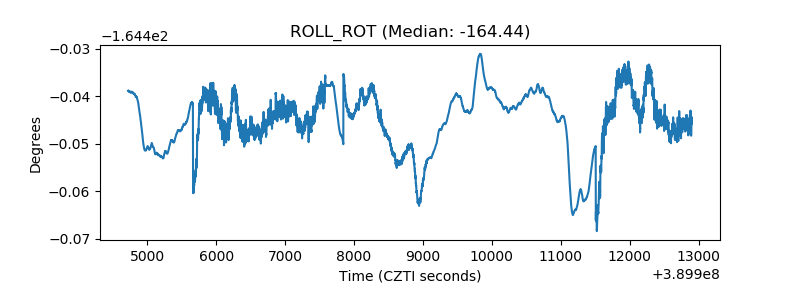 |
| _Roll_DEC | 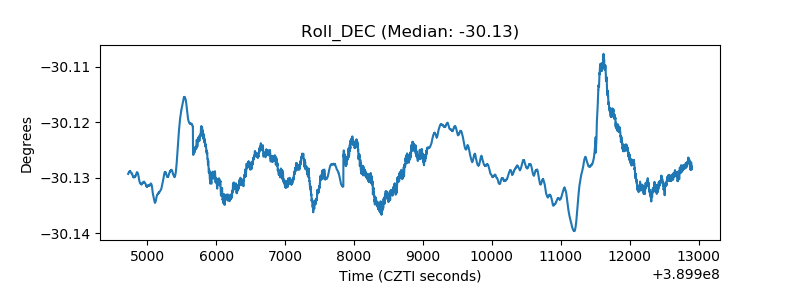 |
| _Roll_RA | 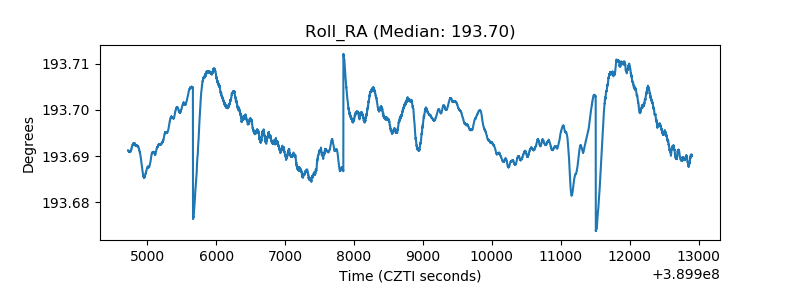 |
| Veto Counter | 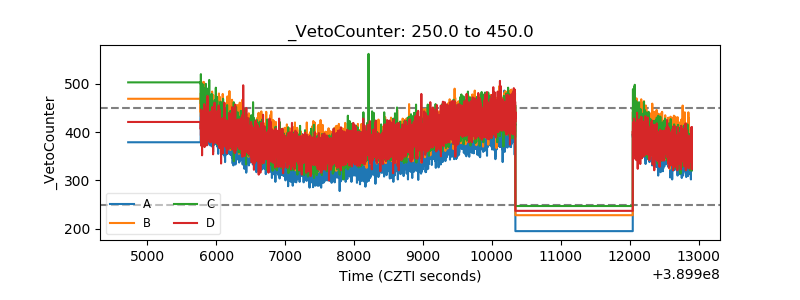 |