| Param | Original file | Final file |
|---|---|---|
| Filename | modeM0/AS1A09_121T01_9000005136cztM0_level2.fits | modeM0/AS1A09_121T01_9000005136cztM0_level2_quad_clean.evt |
| Size (bytes) | 509,353,920 | 485,222,400 |
| Size | 485.8 MB | 462.7 MB |
| Events in quadrant A | 3,150,798 | 2,899,866 |
| Events in quadrant B | 2,943,314 | 2,864,057 |
| Events in quadrant C | 3,023,160 | 2,750,629 |
| Events in quadrant D | 2,637,900 | 2,509,749 |
| Mode M9 | |||
|---|---|---|---|
| Quadrant | BADHDUFLAG | Total packets | Discarded packets |
| A | 0 | 204 | 0 |
| B | 0 | 204 | 0 |
| C | 0 | 204 | 0 |
| D | 0 | 204 | 0 |
| Mode M0 | |||
|---|---|---|---|
| Quadrant | BADHDUFLAG | Total packets | Discarded packets |
| A | 0 | 115008 | 0 |
| B | 0 | 133784 | 0 |
| C | 0 | 122059 | 0 |
| D | 0 | 139759 | 0 |
| Mode SS | |||
|---|---|---|---|
| Quadrant | BADHDUFLAG | Total packets | Discarded packets |
| A | 0 | 1096 | 0 |
| B | 0 | 1096 | 0 |
| C | 0 | 1096 | 0 |
| D | 0 | 1096 | 0 |
| Quadrant | Total seconds | Saturated seconds | Saturation percentage |
|---|---|---|---|
| A | 53480 | 478 | 0.893792% |
| B | 53480 | 1493 | 2.791698% |
| C | 53480 | 960 | 1.795064% |
| D | 53480 | 1666 | 3.115183% |
Noise dominated data is calculated using 1-second bins in cleaned event files. If a bin has >2000 counts, and if more than 50% of those come from <1% of pixels, then it is considered to be noise-dominated and hence unusable.
| Quadrant | # 1 sec bins | Bins with >0 counts | Bins with >2000 counts | High rate bins dominated by noise | Noise dominated (total time) | Noise dominated (detector-on time) | Marked lightcurve |
|---|---|---|---|---|---|---|---|
| A | 74004 | 53474 | 0 | 0 | 0.00% | 0.00% |  |
| B | 74004 | 53467 | 0 | 0 | 0.00% | 0.00% |  |
| C | 74004 | 53443 | 0 | 0 | 0.00% | 0.00% |  |
| D | 74004 | 53422 | 0 | 0 | 0.00% | 0.00% | 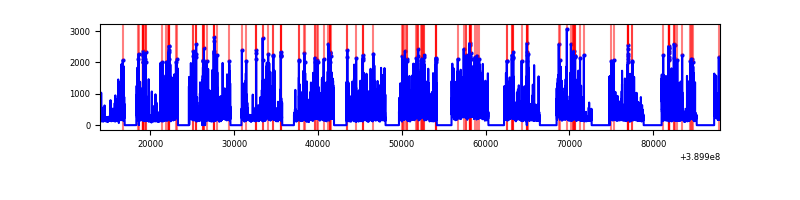 |
Top three noisy pixels from each quadrant. If the there are fewer than three noisy pixels in the level2.evt file, extra rows are filled as -1
| Pixel properties | Quadrant properties | ||||||
|---|---|---|---|---|---|---|---|
| Quadrant | DetID | PixID | Counts | Sigma | Mean | Median | Sigma |
| A | 7 | 110 | 2569 | 8.72 | 824 | 776 | 205.6 |
| A | 9 | 19 | 2563 | 8.69 | 824 | 776 | 205.6 |
| A | 0 | 29 | 2546 | 8.61 | 824 | 776 | 205.6 |
| B | 2 | 9 | 2476 | 11.22 | 782 | 746 | 154.2 |
| B | 3 | 80 | 2329 | 10.27 | 782 | 746 | 154.2 |
| B | 5 | 128 | 2096 | 8.75 | 782 | 746 | 154.2 |
| C | 1 | 81 | 2504 | 8.49 | 800 | 749 | 206.6 |
| C | 1 | 80 | 2440 | 8.18 | 800 | 749 | 206.6 |
| C | 3 | 187 | 2069 | 6.39 | 800 | 749 | 206.6 |
| D | 7 | 3 | 2009 | 6.62 | 755 | 690 | 199.1 |
| D | 4 | 160 | 1966 | 6.41 | 755 | 690 | 199.1 |
| D | 10 | 113 | 1959 | 6.37 | 755 | 690 | 199.1 |
Histogram calculated using DETX and DETY for each event in the final _common_clean file
| Quadrant A | 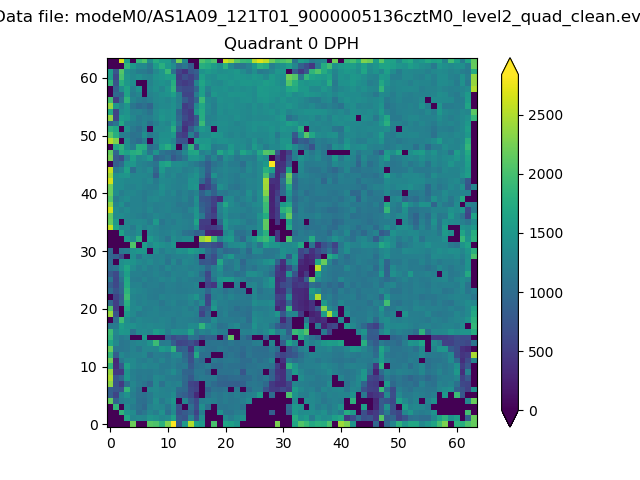 |
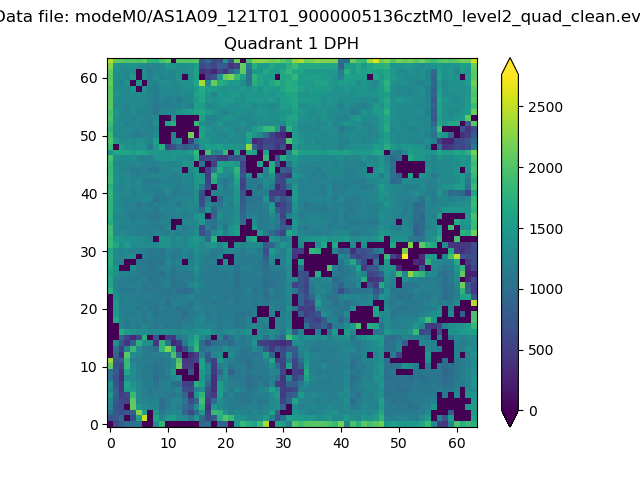 |
Quadrant B |
|---|---|---|---|
| Quadrant D |  |
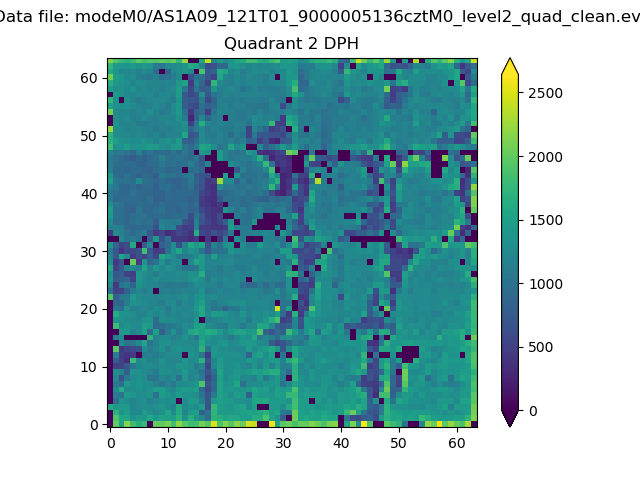 |
Quadrant C |
| Plot type | Count rate plots | Images |
|---|---|---|
| Comparison with Poisson distribution Blue bars denote a histogram of data divided into 1 sec bins. Red curve is a Poisson curve with rate = median count rate of data. |
 |
 |
| Quadrant-wise count rates Data is divided into 100 sec bins |
 |
|
| Module-wise count rates for Quadrant A Data is divided into 100 sec bins |
 |
 |
| Module-wise count rates for Quadrant B Data is divided into 100 sec bins |
 |
 |
| Module-wise count rates for Quadrant C Data is divided into 100 sec bins |
 |
 |
| Module-wise count rates for Quadrant D Data is divided into 100 sec bins |
 |
 |
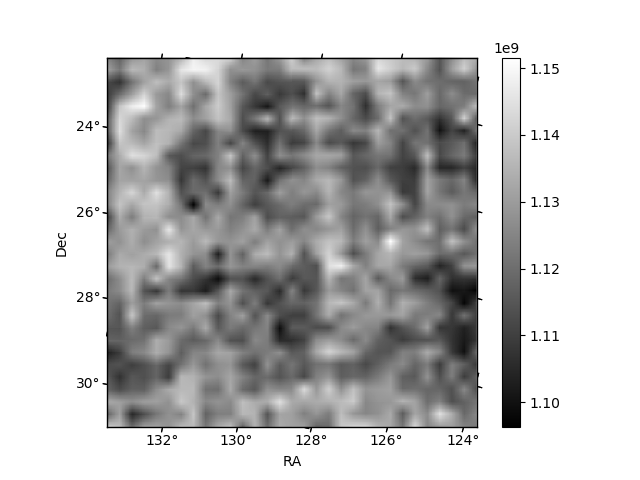
| Parameter | Plot |
|---|---|
| CZT HV Monitor |  |
| D_VDD |  |
| Temperature 1 |  |
| Veto HV Monitor |  |
| Veto LLD |  |
| Alpha Counter |  |
| _CPM_Rate |  |
| CZT Counter |  |
| +2.5 Volts monitor | 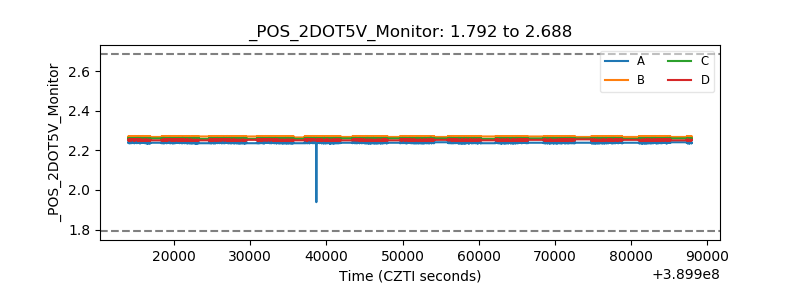 |
| +5 Volts monitor |  |
| _ROLL_ROT |  |
| _Roll_DEC |  |
| _Roll_RA |  |
| Veto Counter |  |