| Param | Original file | Final file |
|---|---|---|
| Filename | modeM0/AS1A09_121T01_9000005136_35778cztM0_level2.evt | modeM0/AS1A09_121T01_9000005136_35778cztM0_level2_quad_clean.evt |
| Size (bytes) | 456,615,360 | 79,280,640 |
| Size | 435.5 MB | 75.6 MB |
| Events in quadrant A | 2,781,517 | 512,041 |
| Events in quadrant B | 3,650,832 | 509,571 |
| Events in quadrant C | 3,448,495 | 504,279 |
| Events in quadrant D | 3,565,625 | 481,214 |
| Mode M9 | |||
|---|---|---|---|
| Quadrant | BADHDUFLAG | Total packets | Discarded packets |
| A | 0 | 22 | 0 |
| B | 0 | 22 | 0 |
| C | 0 | 22 | 0 |
| D | 0 | 23 | 0 |
| Mode M0 | |||
|---|---|---|---|
| Quadrant | BADHDUFLAG | Total packets | Discarded packets |
| A | 0 | 11727 | 3 |
| B | 0 | 14396 | 2 |
| C | 0 | 13407 | 2 |
| D | 0 | 14117 | 2 |
| Mode SS | |||
|---|---|---|---|
| Quadrant | BADHDUFLAG | Total packets | Discarded packets |
| A | 0 | 116 | 0 |
| B | 0 | 116 | 0 |
| C | 0 | 116 | 0 |
| D | 0 | 116 | 0 |
| Quadrant | Total seconds | Saturated seconds | Saturation percentage |
|---|---|---|---|
| A | 5623 | 10 | 0.177841% |
| B | 5623 | 223 | 3.965855% |
| C | 5623 | 96 | 1.707274% |
| D | 5623 | 147 | 2.614263% |
Noise dominated data is calculated using 1-second bins in cleaned event files. If a bin has >2000 counts, and if more than 50% of those come from <1% of pixels, then it is considered to be noise-dominated and hence unusable.
| Quadrant | # 1 sec bins | Bins with >0 counts | Bins with >2000 counts | High rate bins dominated by noise | Noise dominated (total time) | Noise dominated (detector-on time) | Marked lightcurve |
|---|---|---|---|---|---|---|---|
| A | 7235 | 5624 | 0 | 0 | 0.00% | 0.00% | 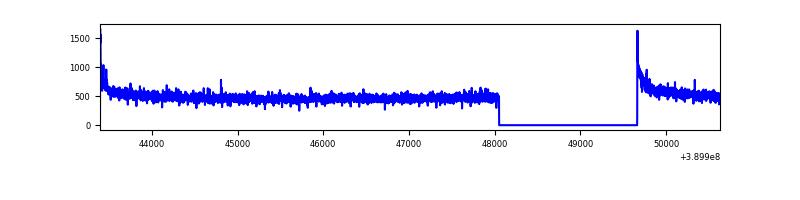 |
| B | 7234 | 5623 | 163 | 163 | 2.25% | 2.90% | 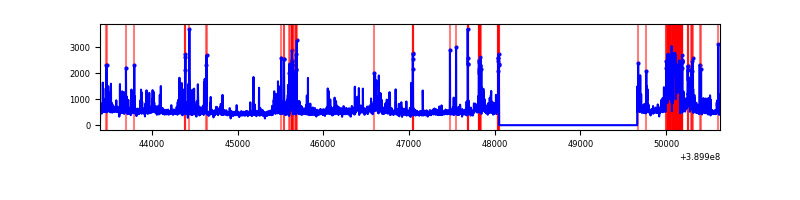 |
| C | 7235 | 5624 | 67 | 67 | 0.93% | 1.19% | 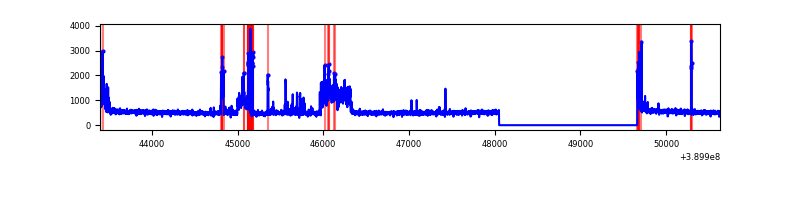 |
| D | 7235 | 5624 | 132 | 132 | 1.82% | 2.35% | 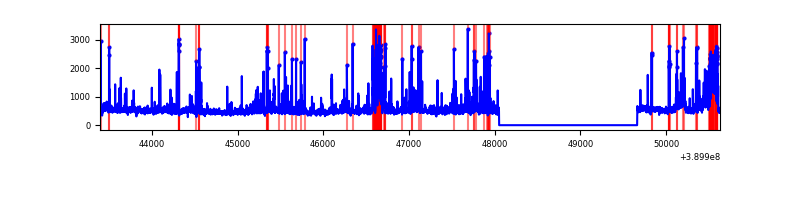 |
Top three noisy pixels from each quadrant. If the there are fewer than three noisy pixels in the level2.evt file, extra rows are filled as -1
| Pixel properties | Quadrant properties | ||||||
|---|---|---|---|---|---|---|---|
| Quadrant | DetID | PixID | Counts | Sigma | Mean | Median | Sigma |
| A | 10 | 83 | 168501 | 1216.89 | 672 | 659 | 137.9 |
| A | 13 | 6 | 10673 | 72.6 | 672 | 659 | 137.9 |
| A | 7 | 48 | 9999 | 67.72 | 672 | 659 | 137.9 |
| B | 5 | 172 | 483546 | 3838.04 | 653 | 636 | 125.8 |
| B | 5 | 255 | 262737 | 2083.11 | 653 | 636 | 125.8 |
| B | 0 | 213 | 65004 | 511.58 | 653 | 636 | 125.8 |
| C | 10 | 49 | 547589 | 3635.47 | 646 | 651 | 150.4 |
| C | 15 | 214 | 242982 | 1610.76 | 646 | 651 | 150.4 |
| C | 0 | 10 | 100101 | 661.04 | 646 | 651 | 150.4 |
| D | 7 | 223 | 220431 | 1382.48 | 649 | 631 | 159.0 |
| D | 10 | 118 | 178721 | 1120.13 | 649 | 631 | 159.0 |
| D | 13 | 249 | 148398 | 929.41 | 649 | 631 | 159.0 |
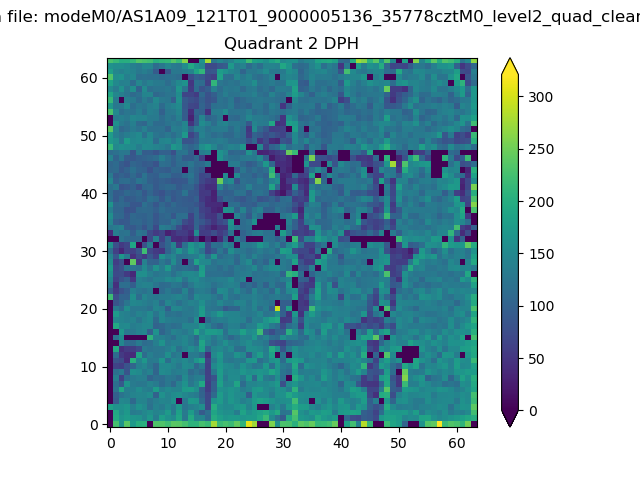
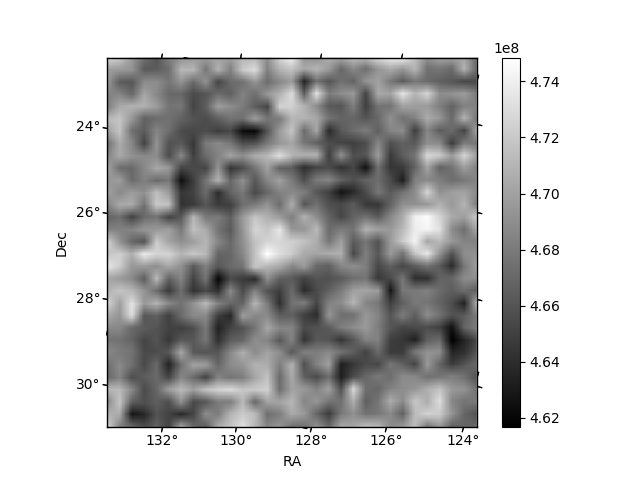
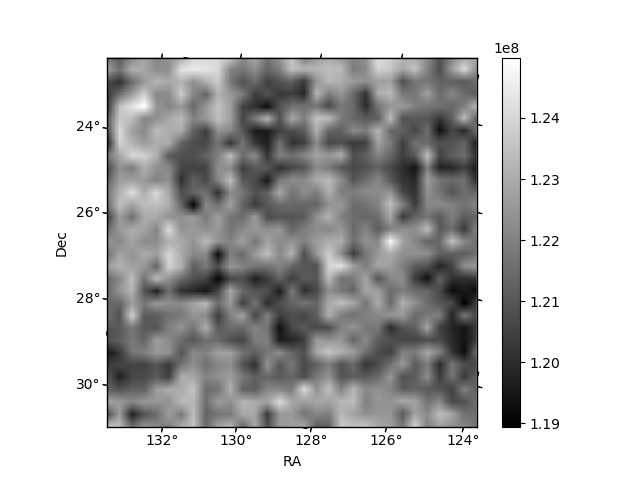
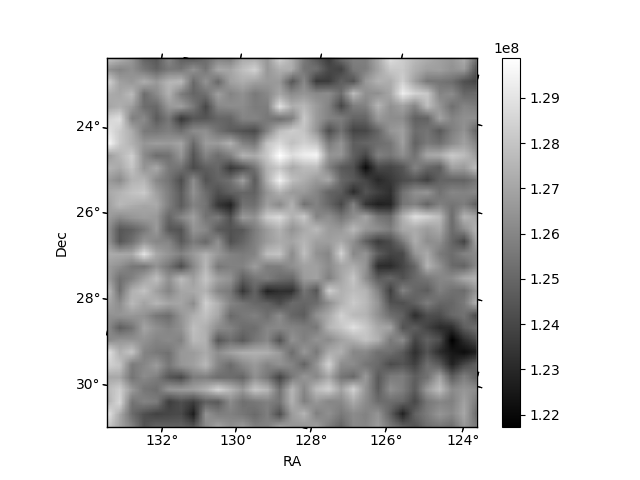
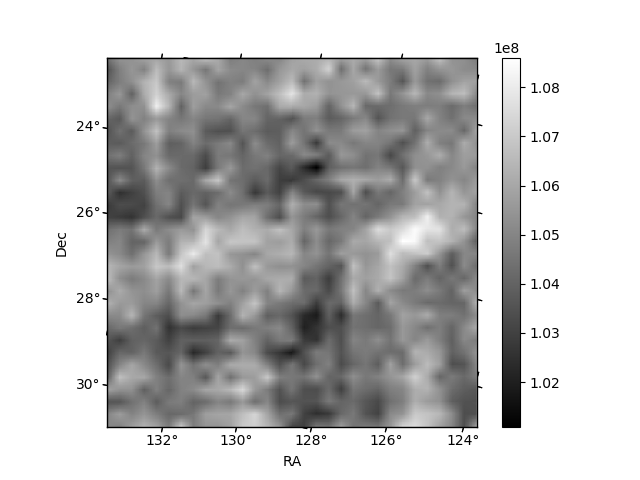
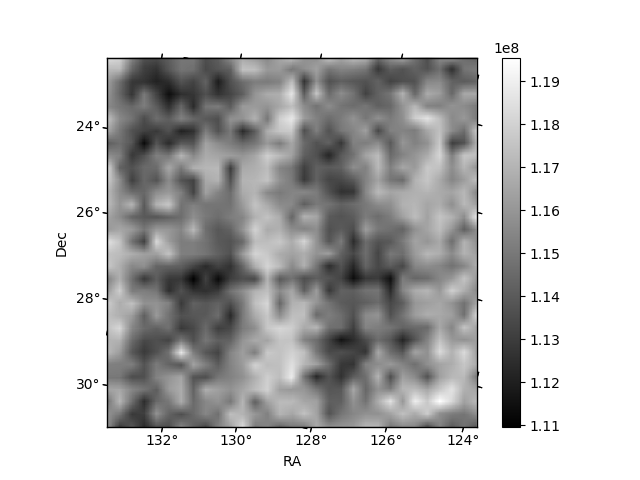
Histogram calculated using DETX and DETY for each event in the final _common_clean file
| Quadrant A | 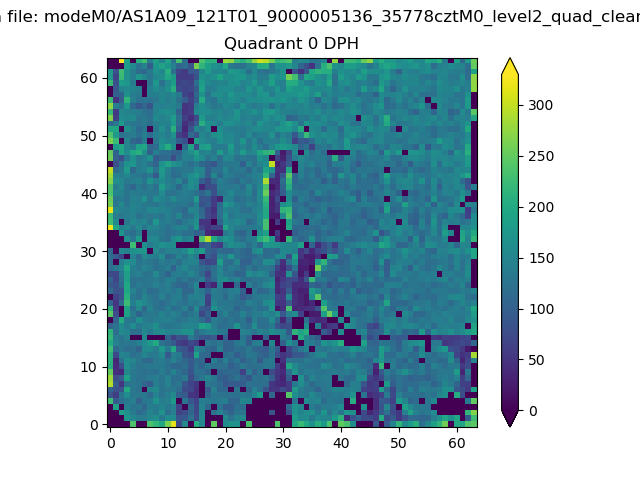 |
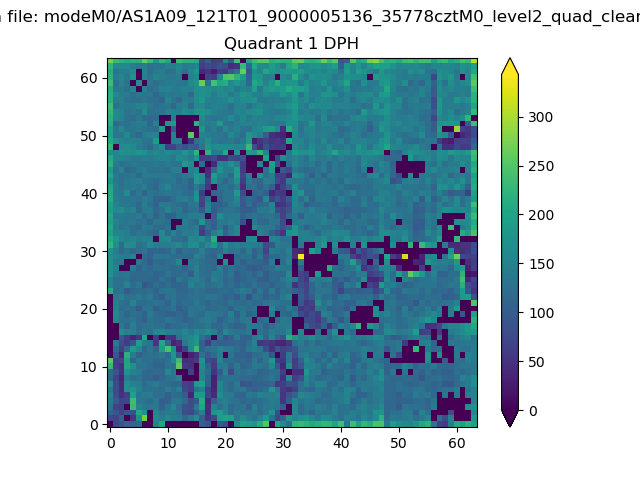 |
Quadrant B |
|---|---|---|---|
| Quadrant D | 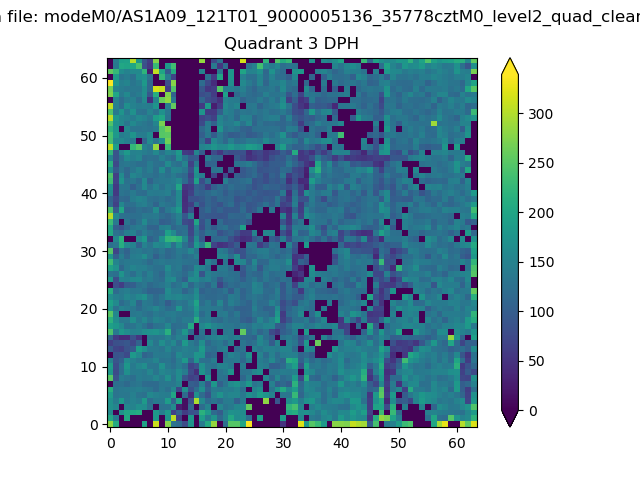 |
 |
Quadrant C |
| Plot type | Count rate plots | Images |
|---|---|---|
| Comparison with Poisson distribution Blue bars denote a histogram of data divided into 1 sec bins. Red curve is a Poisson curve with rate = median count rate of data. |
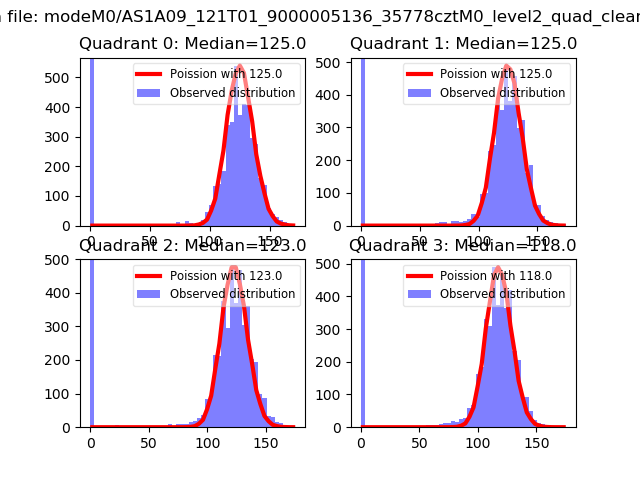 |
 |
| Quadrant-wise count rates Data is divided into 100 sec bins |
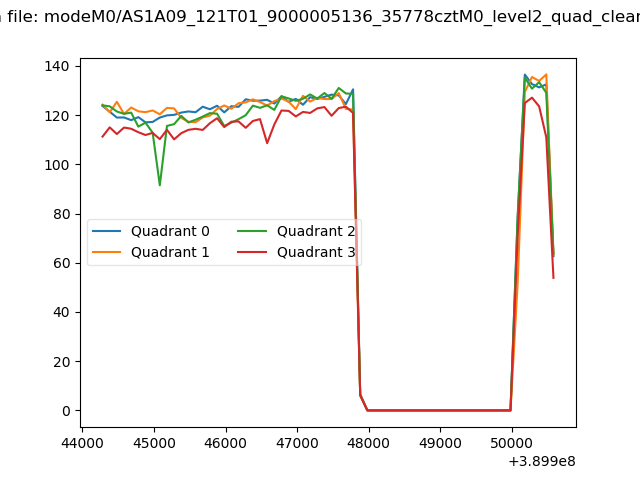 |
|
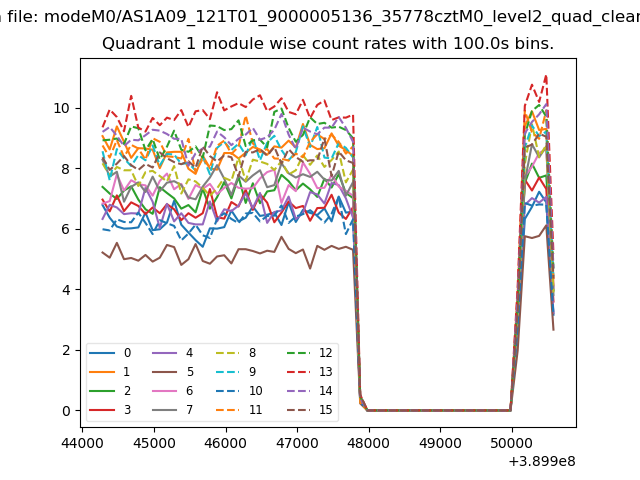
| Module-wise count rates for Quadrant A Data is divided into 100 sec bins |
 |
 |
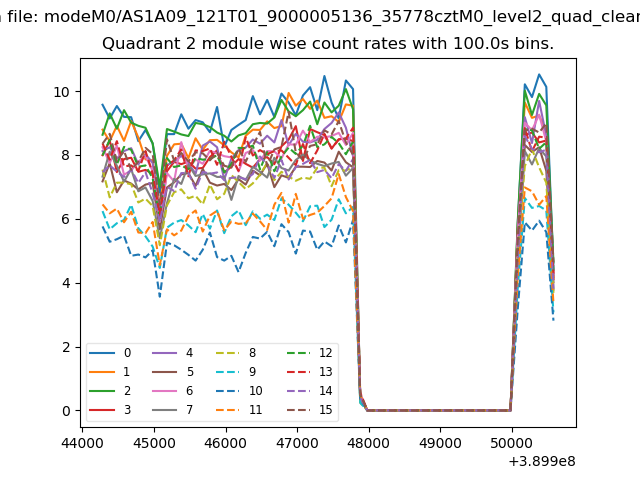
| Module-wise count rates for Quadrant B Data is divided into 100 sec bins |
 |
 |
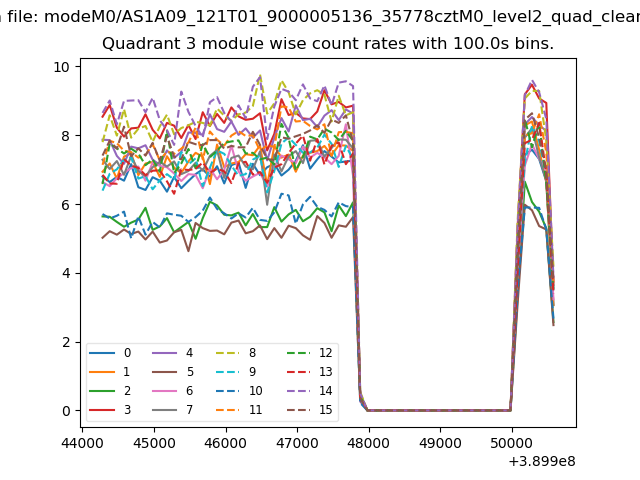
| Module-wise count rates for Quadrant C Data is divided into 100 sec bins |
 |
 |
| Module-wise count rates for Quadrant D Data is divided into 100 sec bins |
 |
 |
| Parameter | Plot |
|---|---|
| CZT HV Monitor | 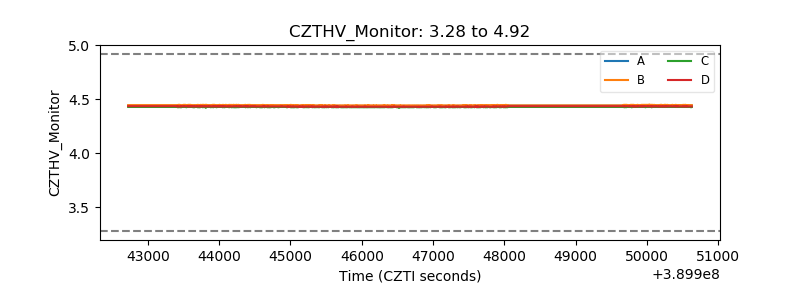 |
| D_VDD | 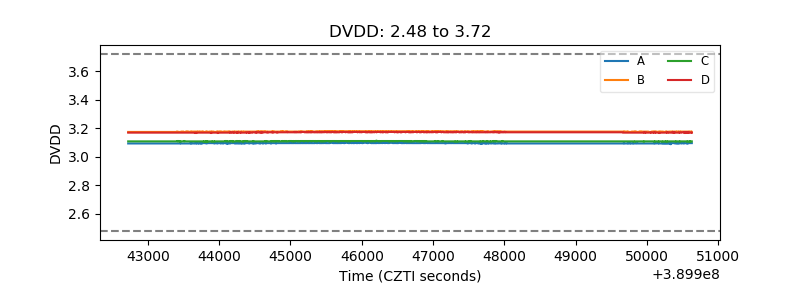 |
| Temperature 1 | 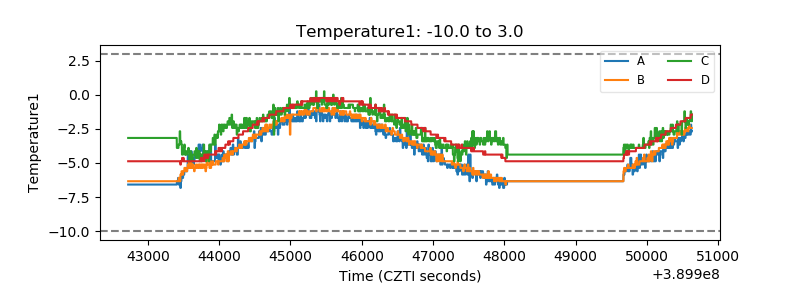 |
| Veto HV Monitor | 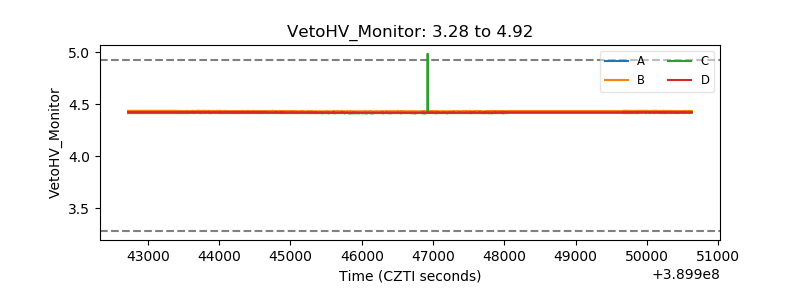 |
| Veto LLD | 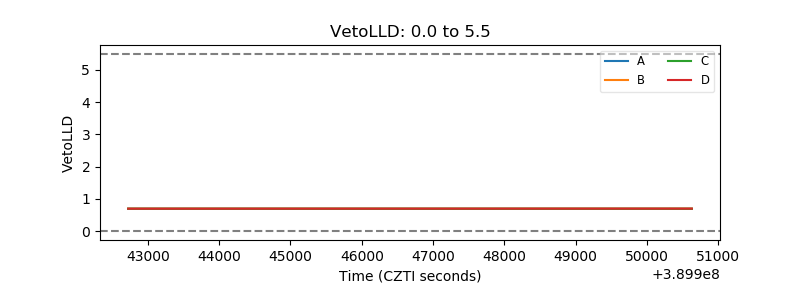 |
| Alpha Counter | 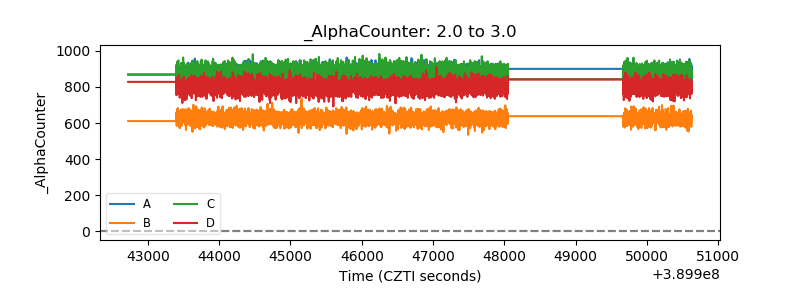 |
| _CPM_Rate | 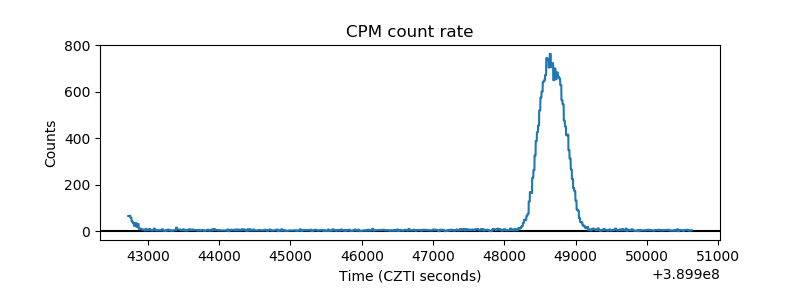 |
| CZT Counter | 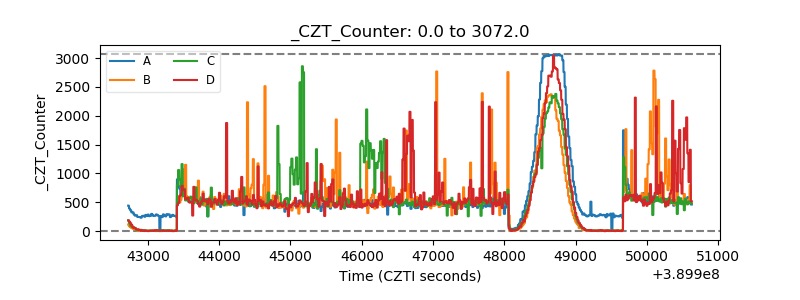 |
| +2.5 Volts monitor | 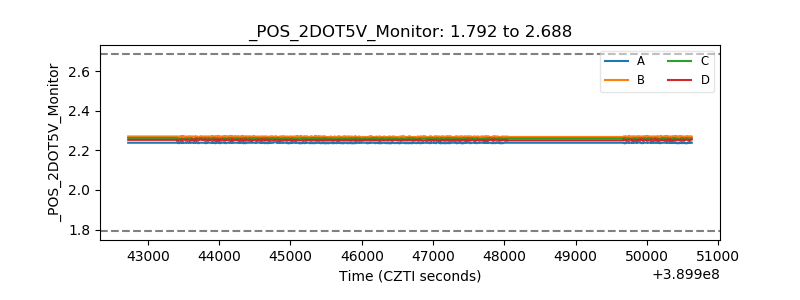 |
| +5 Volts monitor |  |
| _ROLL_ROT | 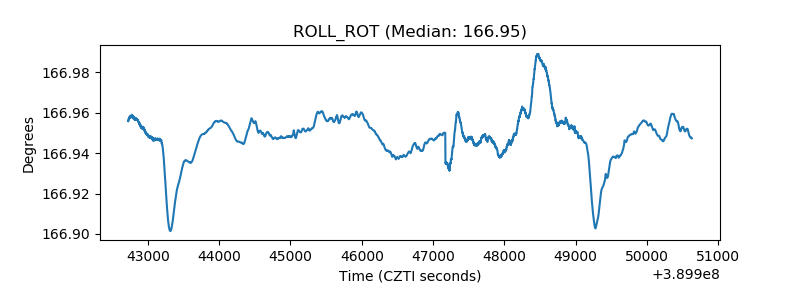 |
| _Roll_DEC | 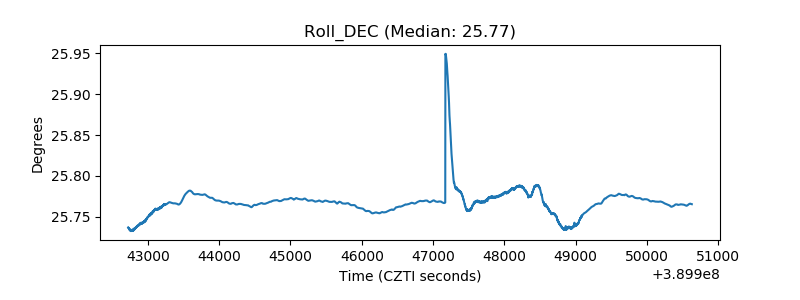 |
| _Roll_RA | 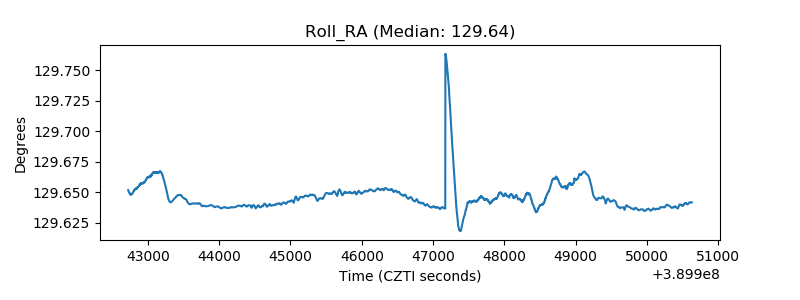 |
| Veto Counter | 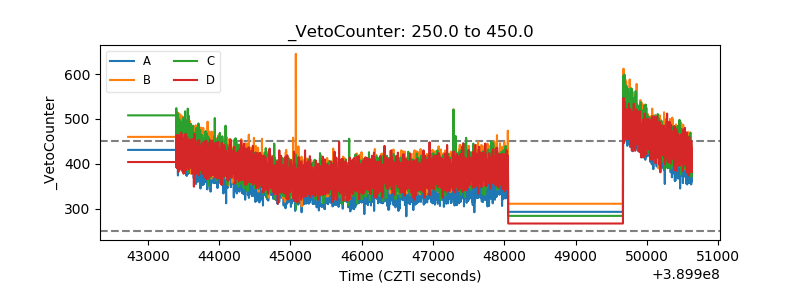 |