| Param | Original file | Final file |
|---|---|---|
| Filename | modeM0/AS1A09_029T09_9000005138cztM0_level2.fits | modeM0/AS1A09_029T09_9000005138cztM0_level2_quad_clean.evt |
| Size (bytes) | 401,837,760 | 452,543,040 |
| Size | 383.2 MB | 431.6 MB |
| Events in quadrant A | 2,339,834 | 2,588,836 |
| Events in quadrant B | 2,323,542 | 2,841,566 |
| Events in quadrant C | 2,405,936 | 2,766,807 |
| Events in quadrant D | 2,076,648 | 2,487,147 |
| Mode SS | |||
|---|---|---|---|
| Quadrant | BADHDUFLAG | Total packets | Discarded packets |
| A | 0 | 900 | 0 |
| B | 0 | 900 | 0 |
| C | 0 | 900 | 0 |
| D | 0 | 900 | 0 |
| Mode M0 | |||
|---|---|---|---|
| Quadrant | BADHDUFLAG | Total packets | Discarded packets |
| A | 0 | 139156 | 0 |
| B | 0 | 112513 | 0 |
| C | 0 | 94973 | 0 |
| D | 0 | 115934 | 0 |
| Mode M9 | |||
|---|---|---|---|
| Quadrant | BADHDUFLAG | Total packets | Discarded packets |
| A | 0 | 140 | 0 |
| B | 0 | 140 | 0 |
| C | 0 | 140 | 0 |
| D | 0 | 140 | 0 |
| Quadrant | Total seconds | Saturated seconds | Saturation percentage |
|---|---|---|---|
| A | 44000 | 4029 | 9.156818% |
| B | 44004 | 1495 | 3.397418% |
| C | 44009 | 475 | 1.079325% |
| D | 44002 | 1380 | 3.136221% |
Noise dominated data is calculated using 1-second bins in cleaned event files. If a bin has >2000 counts, and if more than 50% of those come from <1% of pixels, then it is considered to be noise-dominated and hence unusable.
| Quadrant | # 1 sec bins | Bins with >0 counts | Bins with >2000 counts | High rate bins dominated by noise | Noise dominated (total time) | Noise dominated (detector-on time) | Marked lightcurve |
|---|---|---|---|---|---|---|---|
| A | 58016 | 43943 | 0 | 0 | 0.00% | 0.00% |  |
| B | 58016 | 43998 | 0 | 0 | 0.00% | 0.00% |  |
| C | 58016 | 44000 | 0 | 0 | 0.00% | 0.00% |  |
| D | 58016 | 43973 | 0 | 0 | 0.00% | 0.00% |  |
Top three noisy pixels from each quadrant. If the there are fewer than three noisy pixels in the level2.evt file, extra rows are filled as -1
| Pixel properties | Quadrant properties | ||||||
|---|---|---|---|---|---|---|---|
| Quadrant | DetID | PixID | Counts | Sigma | Mean | Median | Sigma |
| A | 0 | 29 | 1900 | 8.75 | 611 | 574 | 151.6 |
| A | 7 | 110 | 1858 | 8.47 | 611 | 574 | 151.6 |
| A | 9 | 19 | 1854 | 8.44 | 611 | 574 | 151.6 |
| B | 2 | 9 | 2020 | 11.74 | 615 | 587 | 122.1 |
| B | 3 | 80 | 1800 | 9.93 | 615 | 587 | 122.1 |
| B | 5 | 128 | 1615 | 8.42 | 615 | 587 | 122.1 |
| C | 1 | 81 | 2020 | 8.66 | 635 | 594 | 164.7 |
| C | 1 | 80 | 1950 | 8.23 | 635 | 594 | 164.7 |
| C | 3 | 187 | 1680 | 6.59 | 635 | 594 | 164.7 |
| D | 7 | 3 | 1521 | 6.28 | 594 | 543 | 155.8 |
| D | 4 | 160 | 1503 | 6.16 | 594 | 543 | 155.8 |
| D | 10 | 189 | 1494 | 6.1 | 594 | 543 | 155.8 |
Histogram calculated using DETX and DETY for each event in the final _common_clean file
| Quadrant A | 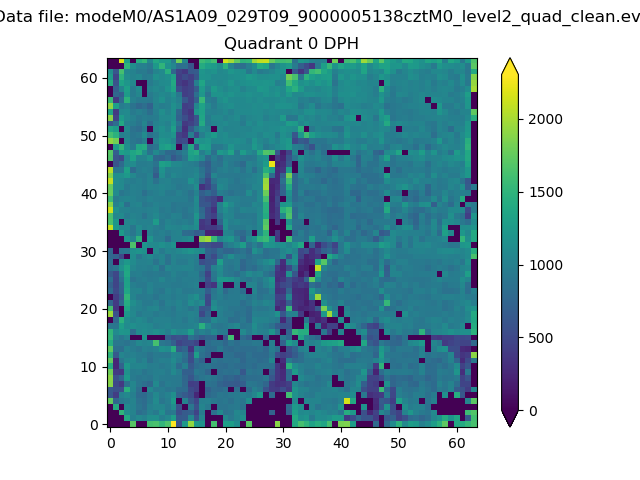 |
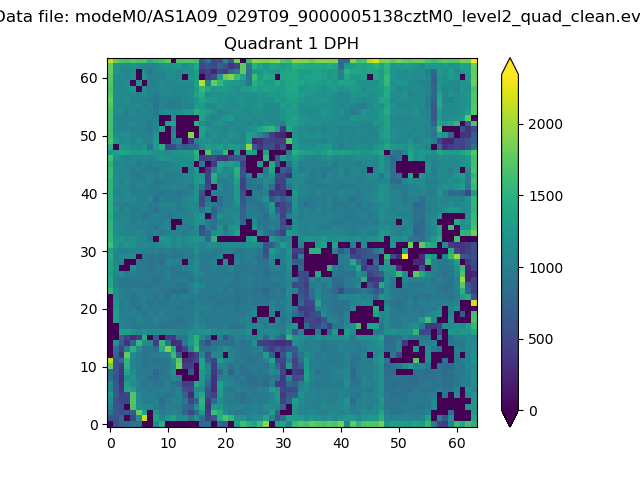 |
Quadrant B |
|---|---|---|---|
| Quadrant D |  |
 |
Quadrant C |
| Plot type | Count rate plots | Images |
|---|---|---|
| Comparison with Poisson distribution Blue bars denote a histogram of data divided into 1 sec bins. Red curve is a Poisson curve with rate = median count rate of data. |
 |
 |
| Quadrant-wise count rates Data is divided into 100 sec bins |
 |
|
| Module-wise count rates for Quadrant A Data is divided into 100 sec bins |
 |
 |
| Module-wise count rates for Quadrant B Data is divided into 100 sec bins |
 |
 |
| Module-wise count rates for Quadrant C Data is divided into 100 sec bins |
 |
 |
| Module-wise count rates for Quadrant D Data is divided into 100 sec bins |
 |
 |
| Parameter | Plot |
|---|---|
| CZT HV Monitor |  |
| D_VDD |  |
| Temperature 1 |  |
| Veto HV Monitor |  |
| Veto LLD |  |
| Alpha Counter |  |
| _CPM_Rate |  |
| CZT Counter |  |
| +2.5 Volts monitor |  |
| +5 Volts monitor |  |
| _ROLL_ROT |  |
| _Roll_DEC |  |
| _Roll_RA |  |
| Veto Counter |  |