| Param | Original file | Final file |
|---|---|---|
| Filename | modeM0/AS1A09_029T10_9000005140cztM0_level2.fits | modeM0/AS1A09_029T10_9000005140cztM0_level2_quad_clean.evt |
| Size (bytes) | 265,608,000 | 230,460,480 |
| Size | 253.3 MB | 219.8 MB |
| Events in quadrant A | 1,667,422 | 1,364,334 |
| Events in quadrant B | 1,551,216 | 1,324,114 |
| Events in quadrant C | 1,560,492 | 1,249,624 |
| Events in quadrant D | 1,375,982 | 1,151,502 |
| Mode M0 | |||
|---|---|---|---|
| Quadrant | BADHDUFLAG | Total packets | Discarded packets |
| A | 0 | 58762 | 0 |
| B | 0 | 68726 | 0 |
| C | 0 | 64113 | 0 |
| D | 0 | 69956 | 0 |
| Mode M9 | |||
|---|---|---|---|
| Quadrant | BADHDUFLAG | Total packets | Discarded packets |
| A | 0 | 133 | 0 |
| B | 0 | 133 | 0 |
| C | 0 | 133 | 0 |
| D | 0 | 133 | 0 |
| Mode SS | |||
|---|---|---|---|
| Quadrant | BADHDUFLAG | Total packets | Discarded packets |
| A | 0 | 562 | 0 |
| B | 0 | 562 | 0 |
| C | 0 | 562 | 0 |
| D | 0 | 562 | 0 |
| Quadrant | Total seconds | Saturated seconds | Saturation percentage |
|---|---|---|---|
| A | 27473 | 177 | 0.644269% |
| B | 27472 | 760 | 2.766453% |
| C | 27473 | 524 | 1.907327% |
| D | 27473 | 892 | 3.246824% |
Noise dominated data is calculated using 1-second bins in cleaned event files. If a bin has >2000 counts, and if more than 50% of those come from <1% of pixels, then it is considered to be noise-dominated and hence unusable.
| Quadrant | # 1 sec bins | Bins with >0 counts | Bins with >2000 counts | High rate bins dominated by noise | Noise dominated (total time) | Noise dominated (detector-on time) | Marked lightcurve |
|---|---|---|---|---|---|---|---|
| A | 40771 | 27471 | 0 | 0 | 0.00% | 0.00% |  |
| B | 40771 | 27467 | 0 | 0 | 0.00% | 0.00% |  |
| C | 40771 | 27460 | 0 | 0 | 0.00% | 0.00% |  |
| D | 40771 | 27436 | 0 | 0 | 0.00% | 0.00% |  |
Top three noisy pixels from each quadrant. If the there are fewer than three noisy pixels in the level2.evt file, extra rows are filled as -1
| Pixel properties | Quadrant properties | ||||||
|---|---|---|---|---|---|---|---|
| Quadrant | DetID | PixID | Counts | Sigma | Mean | Median | Sigma |
| A | 9 | 19 | 1360 | 8.73 | 435 | 412 | 108.6 |
| A | 7 | 110 | 1347 | 8.61 | 435 | 412 | 108.6 |
| A | 0 | 29 | 1301 | 8.18 | 435 | 412 | 108.6 |
| B | 2 | 9 | 1329 | 11.63 | 410 | 395 | 80.3 |
| B | 3 | 80 | 1228 | 10.37 | 410 | 395 | 80.3 |
| B | 2 | 8 | 1111 | 8.91 | 410 | 395 | 80.3 |
| C | 3 | 203 | 1322 | 8.67 | 412 | 388 | 107.7 |
| C | 1 | 81 | 1283 | 8.31 | 412 | 388 | 107.7 |
| C | 3 | 202 | 1240 | 7.91 | 412 | 388 | 107.7 |
| D | 7 | 3 | 1046 | 6.49 | 394 | 361 | 105.5 |
| D | 4 | 160 | 1034 | 6.38 | 394 | 361 | 105.5 |
| D | 10 | 189 | 1012 | 6.17 | 394 | 361 | 105.5 |
Histogram calculated using DETX and DETY for each event in the final _common_clean file
| Quadrant A | 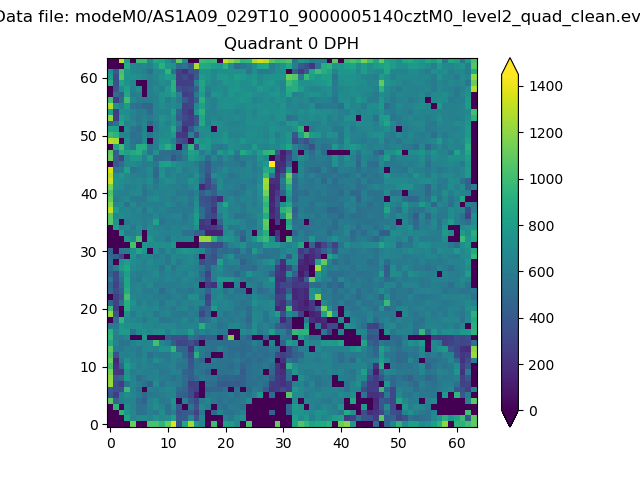 |
 |
Quadrant B |
|---|---|---|---|
| Quadrant D |  |
 |
Quadrant C |
| Plot type | Count rate plots | Images |
|---|---|---|
| Comparison with Poisson distribution Blue bars denote a histogram of data divided into 1 sec bins. Red curve is a Poisson curve with rate = median count rate of data. |
 |
 |
| Quadrant-wise count rates Data is divided into 100 sec bins |
 |
|
| Module-wise count rates for Quadrant A Data is divided into 100 sec bins |
 |
 |
| Module-wise count rates for Quadrant B Data is divided into 100 sec bins |
 |
 |
| Module-wise count rates for Quadrant C Data is divided into 100 sec bins |
 |
 |
| Module-wise count rates for Quadrant D Data is divided into 100 sec bins |
 |
 |
| Parameter | Plot |
|---|---|
| CZT HV Monitor |  |
| D_VDD |  |
| Temperature 1 |  |
| Veto HV Monitor |  |
| Veto LLD |  |
| Alpha Counter |  |
| _CPM_Rate |  |
| CZT Counter |  |
| +2.5 Volts monitor |  |
| +5 Volts monitor |  |
| _ROLL_ROT |  |
| _Roll_DEC |  |
| _Roll_RA |  |
| Veto Counter |  |