| Param | Original file | Final file |
|---|---|---|
| Filename | modeM0/AS1A09_029T10_9000005140_35800cztM0_level2.evt | modeM0/AS1A09_029T10_9000005140_35800cztM0_level2_quad_clean.evt |
| Size (bytes) | 397,402,560 | 64,391,040 |
| Size | 379.0 MB | 61.4 MB |
| Events in quadrant A | 2,713,444 | 415,077 |
| Events in quadrant B | 3,129,720 | 411,271 |
| Events in quadrant C | 2,803,222 | 390,616 |
| Events in quadrant D | 3,045,567 | 378,598 |
| Mode M0 | |||
|---|---|---|---|
| Quadrant | BADHDUFLAG | Total packets | Discarded packets |
| A | 0 | 11357 | 3 |
| B | 0 | 12576 | 2 |
| C | 0 | 11590 | 2 |
| D | 0 | 12463 | 2 |
| Mode M9 | |||
|---|---|---|---|
| Quadrant | BADHDUFLAG | Total packets | Discarded packets |
| A | 0 | 22 | 0 |
| B | 0 | 22 | 0 |
| C | 0 | 22 | 0 |
| D | 0 | 23 | 0 |
| Mode SS | |||
|---|---|---|---|
| Quadrant | BADHDUFLAG | Total packets | Discarded packets |
| A | 0 | 102 | 0 |
| B | 0 | 102 | 0 |
| C | 0 | 102 | 0 |
| D | 0 | 102 | 0 |
| Quadrant | Total seconds | Saturated seconds | Saturation percentage |
|---|---|---|---|
| A | 5050 | 128 | 2.534653% |
| B | 5050 | 106 | 2.099010% |
| C | 5050 | 159 | 3.148515% |
| D | 5050 | 184 | 3.643564% |
Noise dominated data is calculated using 1-second bins in cleaned event files. If a bin has >2000 counts, and if more than 50% of those come from <1% of pixels, then it is considered to be noise-dominated and hence unusable.
| Quadrant | # 1 sec bins | Bins with >0 counts | Bins with >2000 counts | High rate bins dominated by noise | Noise dominated (total time) | Noise dominated (detector-on time) | Marked lightcurve |
|---|---|---|---|---|---|---|---|
| A | 7052 | 5051 | 115 | 115 | 1.63% | 2.28% | 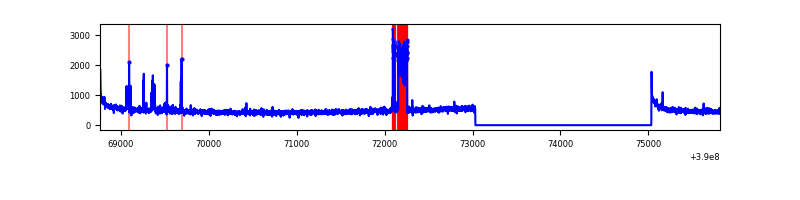 |
| B | 7052 | 5051 | 77 | 77 | 1.09% | 1.52% | 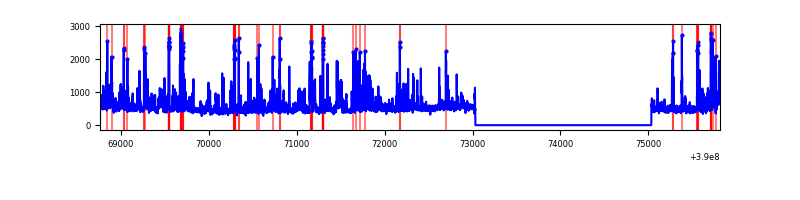 |
| C | 7052 | 5051 | 135 | 135 | 1.91% | 2.67% | 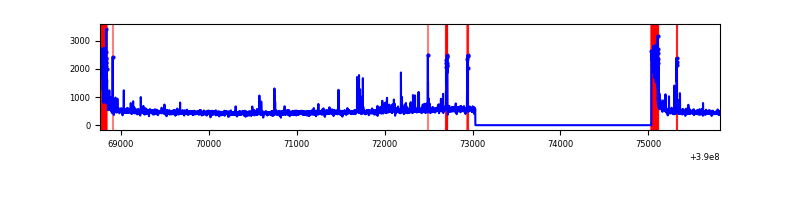 |
| D | 7051 | 5050 | 182 | 182 | 2.58% | 3.60% | 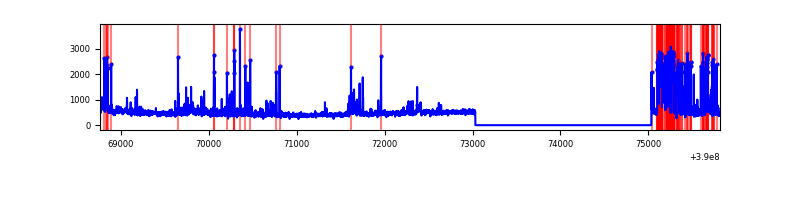 |
Top three noisy pixels from each quadrant. If the there are fewer than three noisy pixels in the level2.evt file, extra rows are filled as -1
| Pixel properties | Quadrant properties | ||||||
|---|---|---|---|---|---|---|---|
| Quadrant | DetID | PixID | Counts | Sigma | Mean | Median | Sigma |
| A | 15 | 169 | 272267 | 2354.46 | 573 | 563 | 115.4 |
| A | 10 | 83 | 158100 | 1365.14 | 573 | 563 | 115.4 |
| A | 7 | 3 | 45601 | 390.28 | 573 | 563 | 115.4 |
| B | 5 | 172 | 373882 | 3406.36 | 571 | 557 | 109.6 |
| B | 0 | 213 | 214368 | 1950.89 | 571 | 557 | 109.6 |
| B | 5 | 255 | 103376 | 938.16 | 571 | 557 | 109.6 |
| C | 0 | 10 | 354713 | 2821.44 | 542 | 545 | 125.5 |
| C | 15 | 214 | 209908 | 1667.86 | 542 | 545 | 125.5 |
| C | 0 | 207 | 75948 | 600.69 | 542 | 545 | 125.5 |
| D | 13 | 249 | 608803 | 4546.1 | 543 | 527 | 133.8 |
| D | 8 | 195 | 95003 | 706.09 | 543 | 527 | 133.8 |
| D | 2 | 153 | 47032 | 347.57 | 543 | 527 | 133.8 |
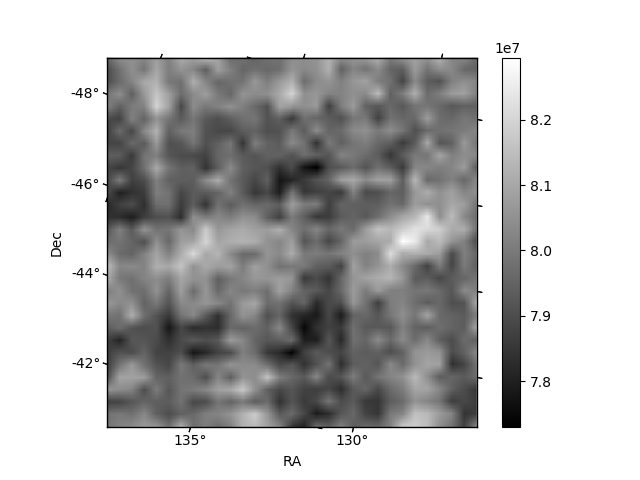
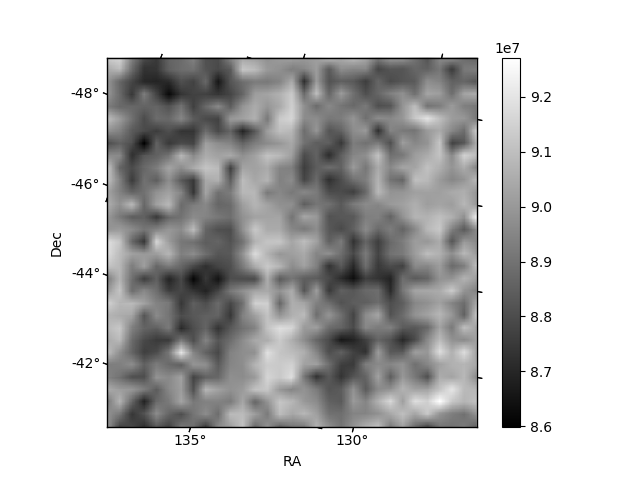
Histogram calculated using DETX and DETY for each event in the final _common_clean file
| Quadrant A | 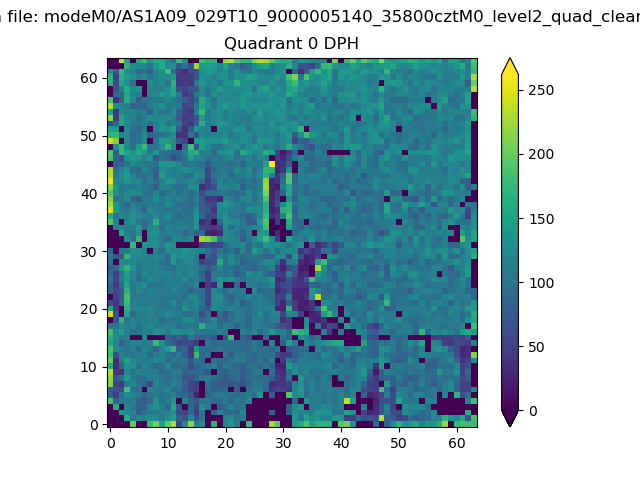 |
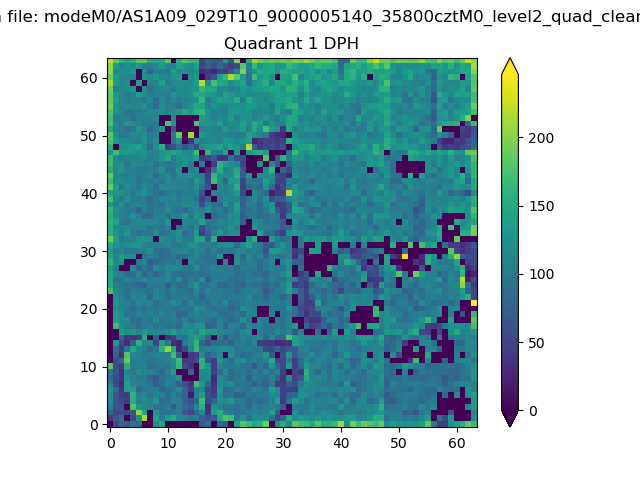 |
Quadrant B |
|---|---|---|---|
| Quadrant D | 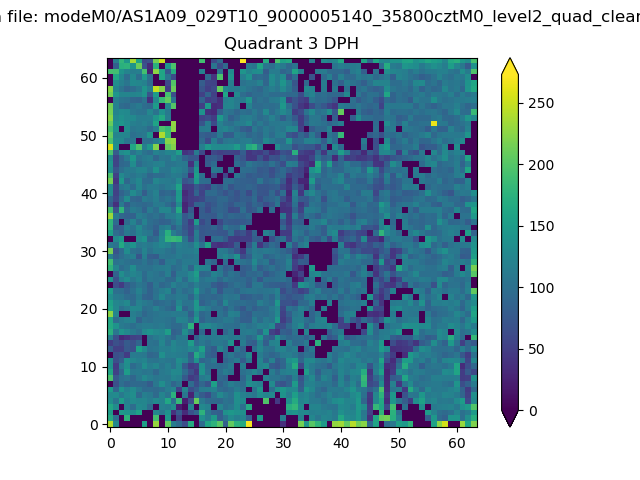 |
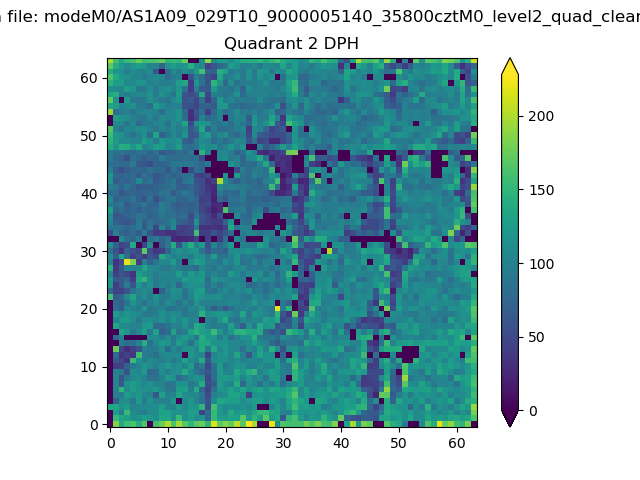 |
Quadrant C |
| Plot type | Count rate plots | Images |
|---|---|---|
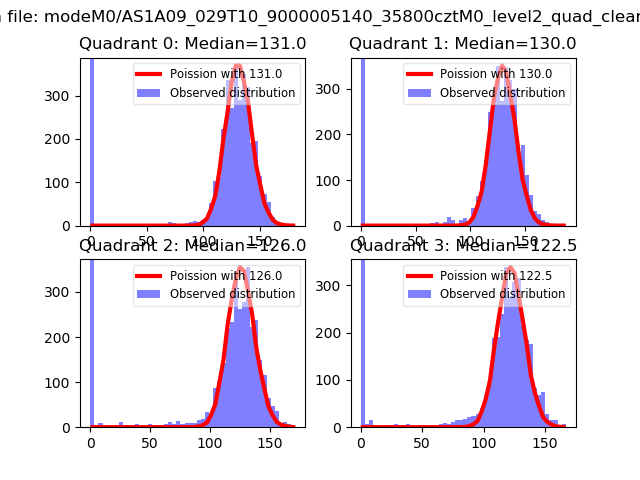
| Comparison with Poisson distribution Blue bars denote a histogram of data divided into 1 sec bins. Red curve is a Poisson curve with rate = median count rate of data. |
 |
 |
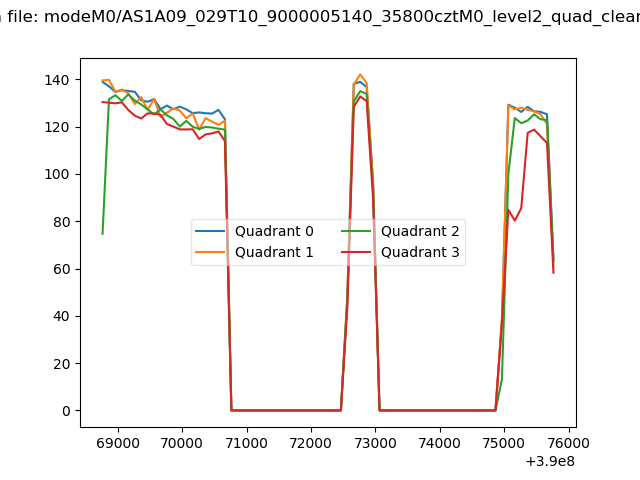
| Quadrant-wise count rates Data is divided into 100 sec bins |
 |
|
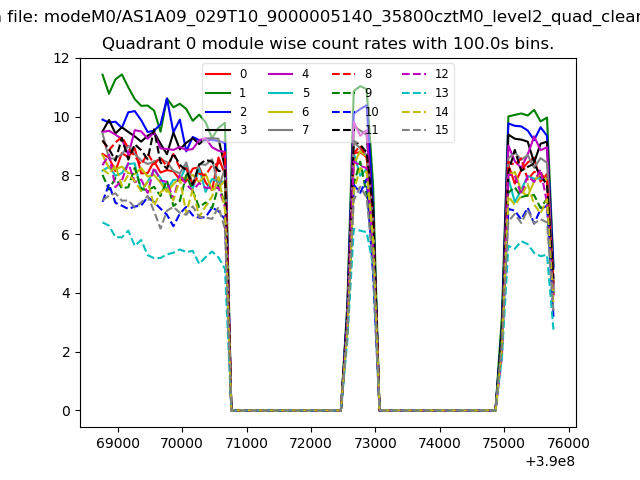
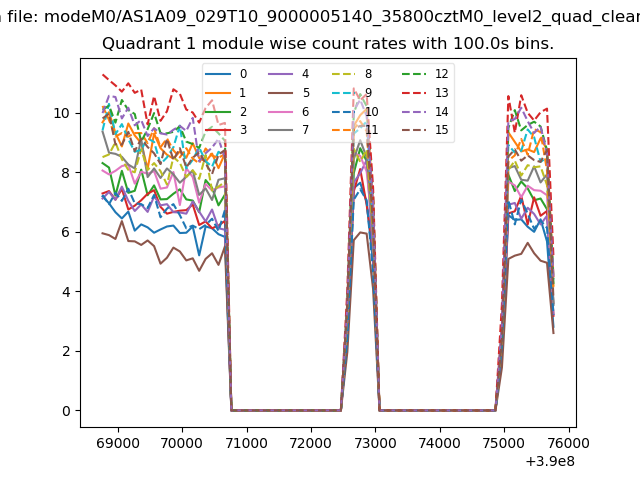
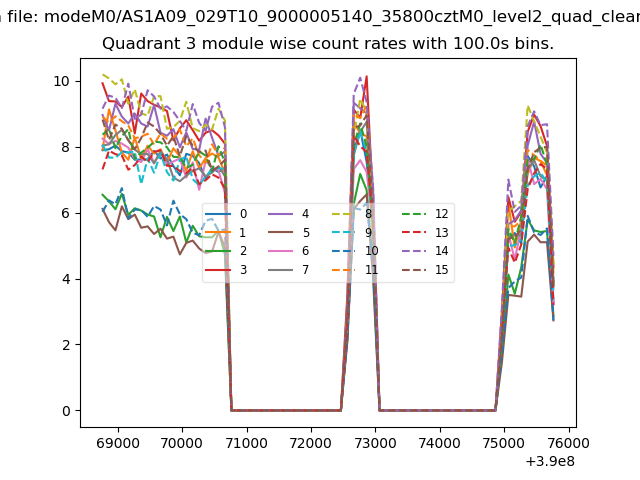
| Module-wise count rates for Quadrant A Data is divided into 100 sec bins |
 |
 |
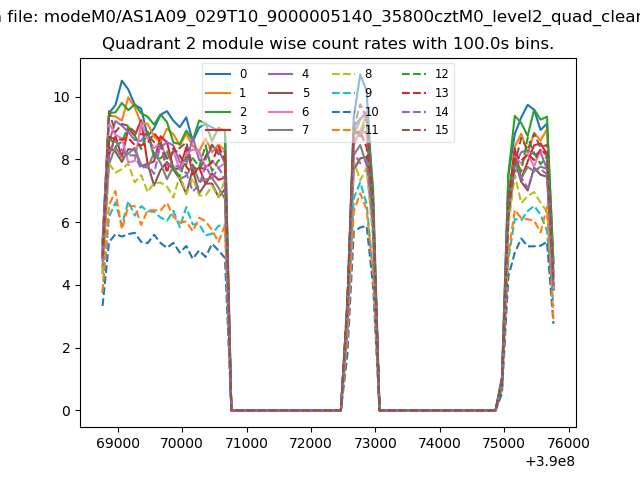
| Module-wise count rates for Quadrant B Data is divided into 100 sec bins |
 |
 |
| Module-wise count rates for Quadrant C Data is divided into 100 sec bins |
 |
 |
| Module-wise count rates for Quadrant D Data is divided into 100 sec bins |
 |
 |
| Parameter | Plot |
|---|---|
| CZT HV Monitor | 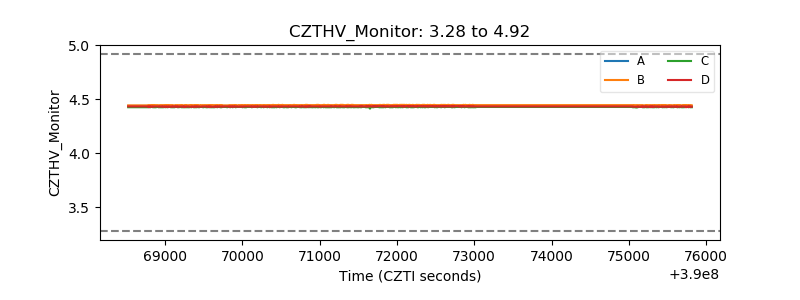 |
| D_VDD | 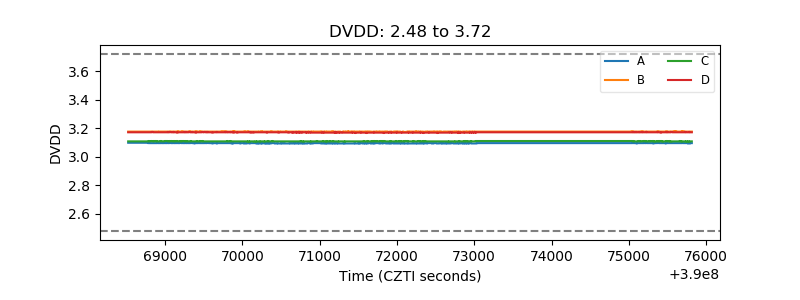 |
| Temperature 1 | 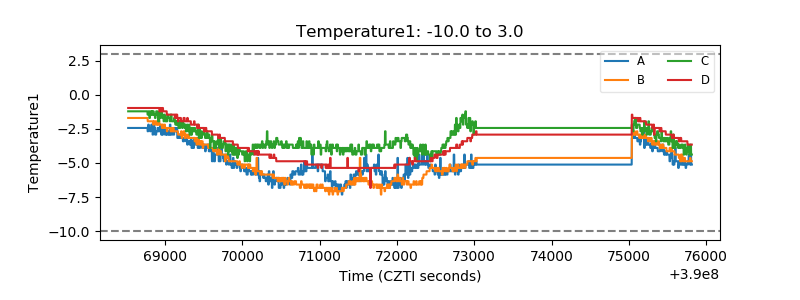 |
| Veto HV Monitor |  |
| Veto LLD | 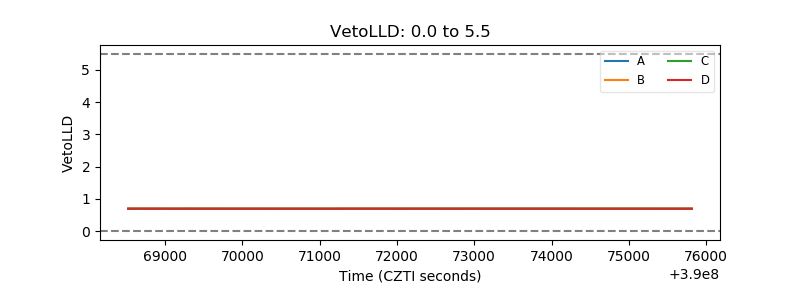 |
| Alpha Counter | 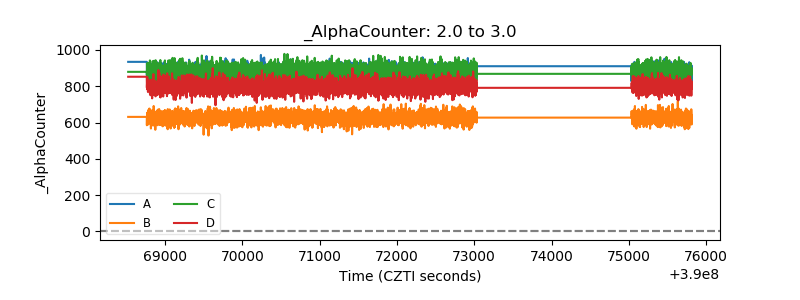 |
| _CPM_Rate |  |
| CZT Counter | 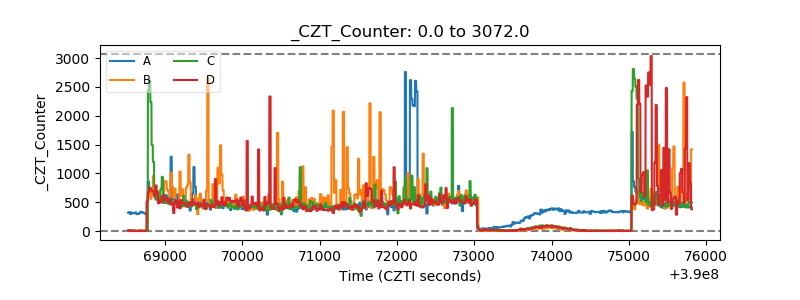 |
| +2.5 Volts monitor |  |
| +5 Volts monitor | 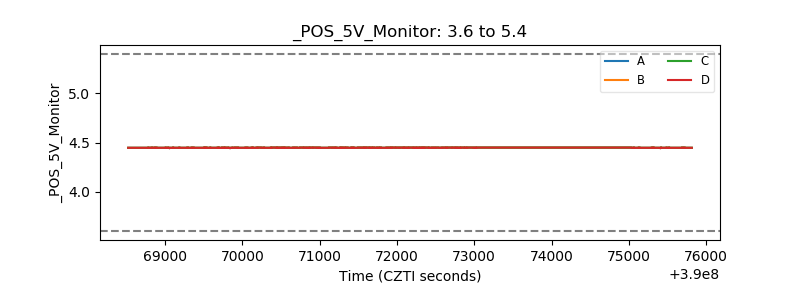 |
| _ROLL_ROT | 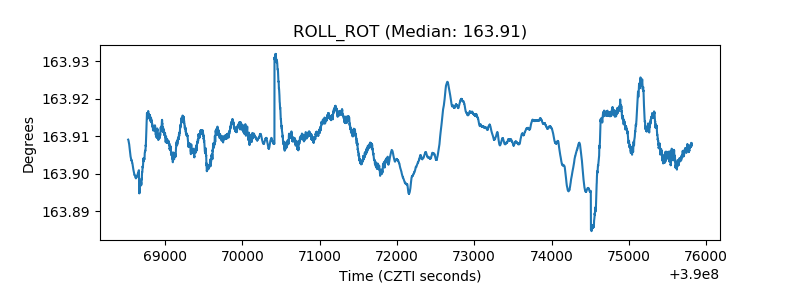 |
| _Roll_DEC | 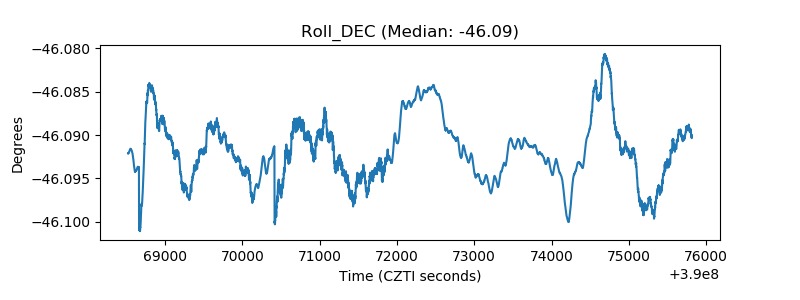 |
| _Roll_RA | 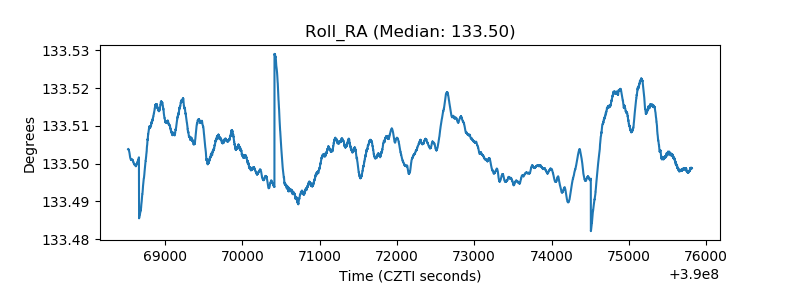 |
| Veto Counter | 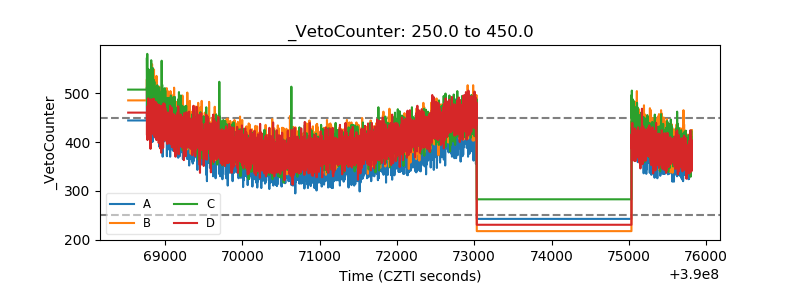 |